Archive for Player Analysis

Aaron Nola Will Make You Question Yourself

In one of the later chapters of The MVP Machine, the authors describe a working relationship between a professional baseball player (an unnamed position player) and a writer at an “analytically inclined” baseball website. The player felt that his club’s advanced scouting data wasn’t granular enough and asked the writer to supplement the information with more detail. The writer summarized that the player was basically looking at three things: “Am I squaring up the ball? Am I swinging and missing? Am I swinging at strikes?”

That last question got me thinking. As a pitcher, it is rarely a bad idea to have batters look at called strikes and swing at balls. Which pitchers, in 2020, were particularly effective at doing just that? To make that determination, I looked at Statcast data for all pitchers who threw at least 60 innings in 2020. Specifically, I looked at their outside-zone swing rate and their zone take rate – calculated as just (1 – zone swing rate) – and took the average of the two. Note that this analysis completely omits what happens if contact is made with the ball; We’re merely interested in strikes that were taken and balls that were swung at. (If you’re interested in the Statcast query and the few lines of code for this, click here.) The top 10 was as follows: Read the rest of this entry »


How Blake Treinen Reinvented Himself

Earlier this month, Blake Treinen returned to the Dodgers on a two-year, $17.5 million deal. Treinen was non-tendered by the Athletics after a down season in 2019 before signing a one-year, $10 million deal with Los Angeles that led to a decent bounceback in 2020.

While the Dodgers were also reportedly interested in adding Liam Hendriks, now a White Sox, the fact that they eventually signed Treinen to a multi-year deal suggests that they were looking closely at his performance in 2020. However, from looking at various data and video, Treinen in 2020 appears to be a particularly different pitcher than Treinen in 2018.

I’d like to take a closer look at how Treinen has changed since his time with the A’s. The first thing to note about his performance after joining the Dodgers is that his groundball rate was 65.3%, up more than 20 points from 45.0% the year before. This is more than 10% higher than in 2018, when he had the best performance of his career. Meanwhile, his strikeout rate was 20.6%, the lowest since his debut in 2015 and well under his career high of 31.7% in 2018. These numbers lead me to believe that Treinen’s change in pitching style is intentional. Read the rest of this entry »


The Best Catcher in Free Agency (Not Named Realmuto)

There are few things in baseball worth more than a star-level catcher. Playing a position that requires you to squat each day for a 162-game season makes for a lot of injuries and shortened careers, and the role of a catcher is so crucial between game-calling, baserunning control, framing, and blocking, that just playing your good defense and being pitcher-friendly will get you a long career no matter how horrible you are with the bat.

Fortunately for all teams in need of a receiver, the 2020 free agent market offers one of the rarest cases among the sport, a true five-tool catcher: J.T. Realmuto, the former Marlins and Phillies backstop, is available for his mere salary.

You want a steady bat, maybe with some thump? Realmuto walks in sporting a career .278 AVG, .455 SLG, and double-digit homers in each of his six “full” seasons in the league.

You need a reliable asset, one that punches the ticket and goes to work? He averaged over 130 games from 2015-19.

You need a rock-solid defender that can also help your guy on the mound? J.T. is there for you with a rocket arm (over 88 mph on his average throw) and a spotless fielding percentage, and while he’s behind the plate, he’ll steal strikes for your pitchers as a 95th-percentile framer does.

Heck, he’ll even run if you ask him to, dashing at over 28 mph, making him an 84th-percentile runner, an absurdity given his role on the field. Read the rest of this entry »


How Much Value Is Really in the Farm System?

Everyone knows that a strong farm system is key to the long-term success of a major league organization. They make it possible for clubs to field competitive teams at affordable salaries and stay beneath the luxury tax threshold, but how much value can an organization truly expect from their farm system? How much more value do the best farm systems generate compared to the worst ones? I decided to take a closer look.

Methodology

The first thing I did was gather the player information and rankings from the Baseball America’s Prospect Handbooks from 2001-14 and entered them into a database. I then found players’ total fWAR produced over the next six seasons, and I added them together to find the values that each farm system produced. I chose six seasons to ensure that teams wouldn’t get credit for a player’s non-team-controlled years, since the value produced would not be guaranteed for the player’s current organization. This method will reduce the total value produced by players that are further away from the majors, but the purpose of this analysis is to focus on the value of the entire farm system and not an individual player’s value over the course of their career.

Let’s look at the 2014 Minnesota Twins as an example. Below is a list of the thirty players that were ranked and the amount of WAR that each player has produced by season. Read the rest of this entry »


Julio Teheran Might Need to Re-Invent Himself

Julio Teheran’s career has been one largely defined by consistency. Over his seven full seasons in Atlanta (2013-19), he never made fewer than 30 starts or threw under 174 innings, with ERAs between 2.94 and 4.49. Arguably the most defining element of his reliability was how he consistently out-performed his peripheral numbers. In each of those seasons, Teheran considerably out-pitched both his FIP and xFIP, often by close to a full run.

Julio Teheran Previous Full Seasons
Season ERA FIP xFIP
2013 3.20 3.69 3.76
2014 2.89 3.49 3.72
2015 4.04 4.40 4.19
2016 3.21 3.69 4.13
2017 4.49 4.95 4.96
2018 3.94 4.83 4.72
2019 3.81 4.66 5.26

On the surface, it would appear that Teheran was already declining significantly over the previous three seasons, even if his ERAs failed to reflect such a story. Like many veteran starters, the easy assumption for such a decline would be diminished stuff, but his 22.4% strikeout rate in 2018 was the best of his career to date, with his 21.5% in 2019 not far behind. Teheran’s decline in Atlanta was predominantly marked by a notable loss of control — jumping from a 5.4 BB% in 2016 to 8.9% in 2017, then 11.6% and 11.0% in 2018 and 2019, respectively. Teheran’s streak of consistent results came to a screeching halt in 2020 to the tune of an 10.05 ERA, 8.62 FIP, and 6.35 xFIP, a recipe that culminated in -0.9fWAR.

But the most worrying sign for Teheran is that this is not a continuation of the previous problem. His walk rate for 2020 was 10.7%, still worse than his career average, but a slight improvement on the previous two seasons. What’s particularly alarming is that his strikeout rate plummeted to just 13.4%, while no pitcher in baseball with more than 100 batters faced had a whiff rate lower than Teheran’s 14.6%. Teheran was only hit slightly harder than previously; while his 38.7 hard hit % was notably higher than 2018’s 36.7% and 2019’s 35.4%, his average EV allowed was only slightly worse than league average at 89.0 mph, identical to his 2019 season. When paired alongside his inability to miss bats though, this high volume of hard contact led to disastrous results. Read the rest of this entry »


Introducing Probabilistic Pitch Scores and xWhiff Metrics

With the advent of the Statcast era, a lot of research has been done in attempts to measure the effectiveness of a particular pitch based on its flight characteristics. As has been noted in the past, quantifying a pitcher’s stuff and command is no easy task. However, over the past few months I have worked to build my own models in an attempt to evaluate the “filth” of any given pitch, taking more of a probability-based approach. I introduce to you my Probabilistic Pitch Scores and xWhiff metrics.

When evaluating the quality of a particular pitch, I focused my interest on three different binary outcome variables: whether or not the batter swung at a pitch, whether or not the batter whiffed on a pitch, and whether or not a pitch was thrown for a strike. Thus, my goal was to train three different types of classification models corresponding to each of these variables: a swing, a miss, and a called strike. For the actual outcomes of these models, I was less interested in the model’s decision and more interested in the predicted probability. For example, if a batter swings on a pitch with given flight characteristics, what is the probability that he will whiff? These probabilities were utilized as the basis of my metrics.

Read the rest of this entry »


Using Count Data To Find Unsustainable Performances

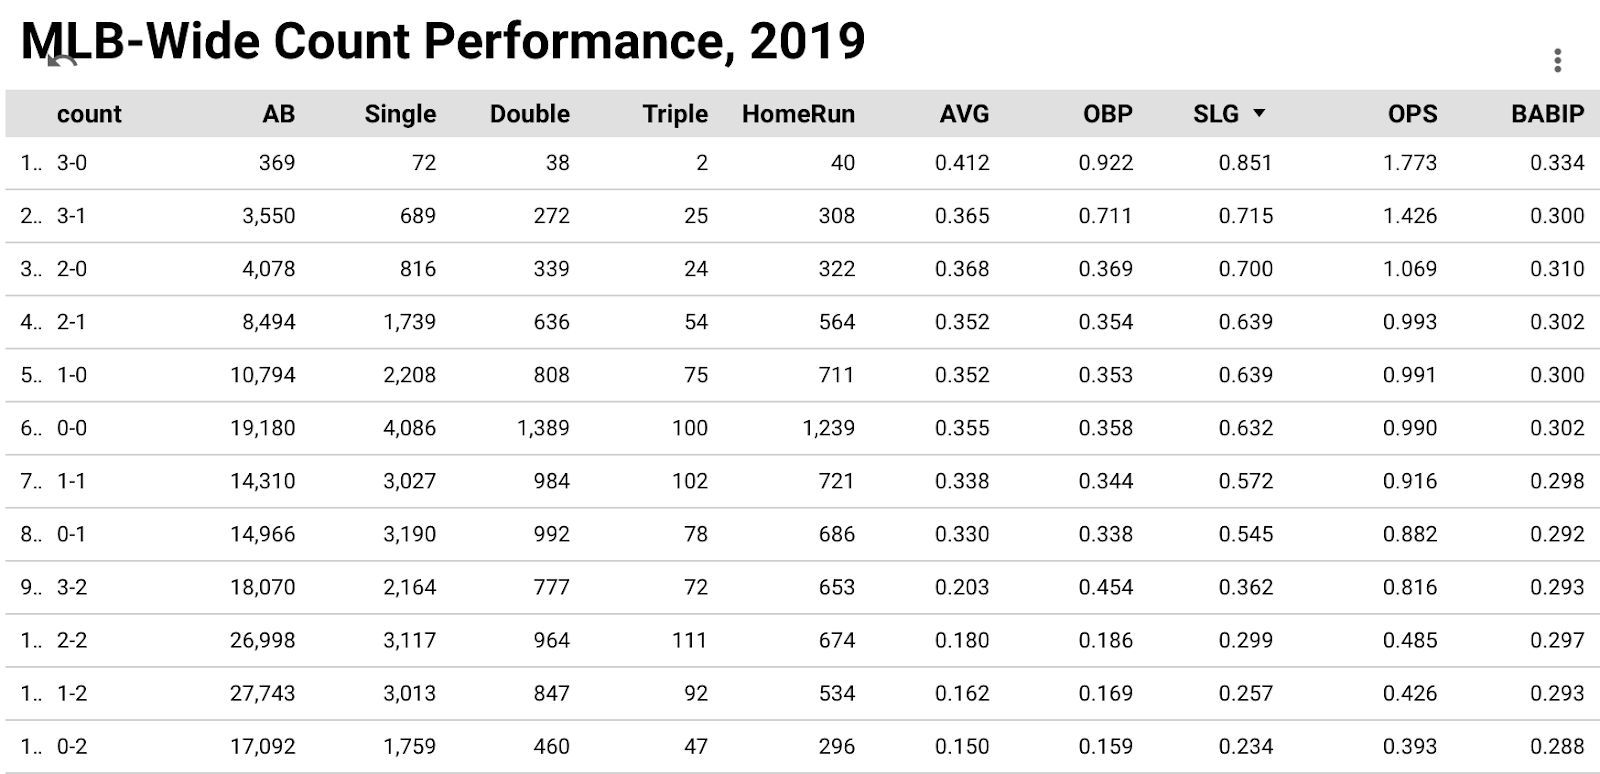
In this project I attempted to find the counts in which hitters were most successful during the 2019 season, and then find the hitters that were ending their at-bats in these counts the most in an effort to identify which players could potentially be under- or overperforming both in the past and going forward.

The data for this project was gathered by scraping Baseball Savant, which I used to create a dashboard to assist me in my analysis. I could not analyze every individual outlier performance from 2019 in this post, but the visualization I created can be accessed here, and the Github Repository for my project can be found here so you can take a look for yourself!

As the chart above shows, MLB hitters performed their best in counts with one or no strikes and their worst in two-strike counts. Using this data, I then explored individual performances in each count on the dashboard I had built to attempt to find outliers and discover who was ending at-bats in each count the most. Once players were identified, I would investigate why their performances were outliers and if their performances were sustainable. This post will highlight two of the more interesting unsustainable cases in hitters I found: Paul DeJong and
Javier Báez. Read the rest of this entry »


Finding Ray Fagan: A Minor League Mystery

Sometimes numbers tell a story. Sometimes that story is a mystery.

I came across the Baseball-Reference page for Raymond Fagan and was stunned by what I saw. It says Fagan went 13-0 with a 1.16 ERA for the Class D Oklahoma City Senators in 1915. Now the stunning part – it says it was his only professional season. Despite those dominant results, it appears Fagan never pitched again.

What happened to Raymond Fagan? Did he suffer a career-ending injury? Did he get into legal trouble and change his name? A Google search yielded no answers. This mystery required a deeper dive. Read the rest of this entry »


All Stolen Bases Were Not Created Equal

Fielding percentage is often criticized for the selection bias introduced by a player’s range (good defenders attempt more difficult plays, leading to more errors). A similar issue of selection bias is present in stolen bases. On any given pitch, it is at the sole discretion of the runner if he will steal a base or not. Naturally, the runner will only attempt a stolen base when he believes he has an advantage over the pitcher and catcher.

Ivan Rodriguez caught 46% of base-stealers throughout his career, topping out at a 60% caught stealing rate in his prime and leading the league in CS% in nine seasons. Knowing that stealing against Pudge is little more than a pipe dream for most, only the best baserunners would dare to attempt a steal. If this assumption holds, Rodriguez’s CS% would in fact be far more impressive than initially reported due to the level of competition he faces relative to a typical catcher.

To adjust for selection bias in stolen-base attempts, I developed an ELO model. For those unfamiliar, ELO ratings are a method of calculating the relative skill levels of players in zero-sum games. You might recognize ELO from chess rankings or FiveThirtyEight’s sports prediction models. These ratings can be used to directly estimate the probability of winning a match between two individuals or teams. The ratings change after each match, rewarding a win by an underdog more than a win by the favorite.

On a stolen-base attempt, the runner, pitcher, and catcher all play a major role in the outcome of the play. An argument could also be made for the importance of the fielder receiving the throw, especially when considering the select few who can make tags like this: Read the rest of this entry »


Examining Mike Trout’s Perfect Swing

Sir Isaac Newton’s second law of gravity tells us exactly how much an object will accelerate based on the given net force.

For baseball hitters, this is directly applicable considering the goal to hit baseballs as hard and far as possible. And when it comes to generating net force against baseballs, Mike Trout is an expert. He has been crushing baseballs with the league’s elite since he became a full-time regular at age 20 in 2012. Trout’s offensive production, in particular, has gone to another level over the course of his career. The following table breaks up his career into two distinct parts. The numbers show Trout’s production compared to league average, with a mark of 100 denoting exactly average.

A Tale of Two Trouts
Years wRC+ BB%+ K%+ Pull%+ Cntr%+ Oppo%+ FB%+ GB%+
2011-15 170 159 115 93 100 112 110 89
2016-19 180 222 91 100 102 98 121 78

Trout has always produced elite offensive numbers, but he’s at an entirely different level now. He has transformed into baseball’s best hitter by walking more, striking out less, and pulling more hard-hit baseballs in the air. Trout is both barreling up more baseballs and raising the launch angle of his batted balls. Unsurprisingly, he had baseball’s second-best sweet-spot percentage in 2019. Trout has talked about a gap-to-gap approach in the past but recent trends show him moving away from hitting balls the other way. Read the rest of this entry »