Aaron Nola Will Make You Question Yourself
In one of the later chapters of The MVP Machine, the authors describe a working relationship between a professional baseball player (an unnamed position player) and a writer at an “analytically inclined” baseball website. The player felt that his club’s advanced scouting data wasn’t granular enough and asked the writer to supplement the information with more detail. The writer summarized that the player was basically looking at three things: “Am I squaring up the ball? Am I swinging and missing? Am I swinging at strikes?”
That last question got me thinking. As a pitcher, it is rarely a bad idea to have batters look at called strikes and swing at balls. Which pitchers, in 2020, were particularly effective at doing just that? To make that determination, I looked at Statcast data for all pitchers who threw at least 60 innings in 2020. Specifically, I looked at their outside-zone swing rate and their zone take rate – calculated as just (1 – zone swing rate) – and took the average of the two. Note that this analysis completely omits what happens if contact is made with the ball; We’re merely interested in strikes that were taken and balls that were swung at. (If you’re interested in the Statcast query and the few lines of code for this, click here.) The top 10 was as follows:
| Name | O Swing % | Z Take % | Avg |
|---|---|---|---|
| Aaron Nola | .366 | .397 | .3815 |
| Zac Gallen | .294 | .405 | .3495 |
| Kenta Maeda | .393 | .306 | .3495 |
| Brady Singer | .271 | .427 | .3490 |
| Shane Bieber | .344 | .353 | .3485 |
| José Berrios | .312 | .384 | .3480 |
| Alec Mills | .299 | .393 | .3460 |
| Dylan Bundy | .291 | .396 | .3435 |
| Marco Gonzales | .303 | .377 | .3400 |
| Adam Wainwright | .301 | .376 | .3385 |
Aaron Nola was in a league of his own in this made-up stat. The difference between him and Kenta Maeda or Zac Gallen is as big as the difference between them and the 22nd player on the list. Let’s take a look at how Nola goes about creating uncertainty in the batters’ minds. We’ll look at what happens before he even throws a pitch as well as once it leaves his hand.
Before
Imagine you’re a major league baseball player and you are about to face Aaron Nola. Starting with the 30,000-foot view, which pitches does he throw, and how often? In 2020, the breakdown looked like this:
| Pitch Type | # | #RHB | #LHB | % |
|---|---|---|---|---|
| Changeup | 314 | 164 | 150 | 27.4 |
| Curveball | 306 | 156 | 150 | 26.7 |
| Four-Seamer | 290 | 115 | 175 | 25.3 |
| Sinker | 238 | 148 | 90 | 20.7 |
Nola throws four pitches, and he relies on three of them about equally. He used the sinker the least but still threw it about a fifth of the time. Regardless of if you’re batting righty or lefty, you have to respect the curveball and the changeup. If you’re batting right-handed, you might get the sinker more often, and if you’re a lefty, maybe the four-seamer. That said, we haven’t learned much.
What about by a particular count?

Except for the 3-0 fastball, maybe look for the 2-1 changeup? But other than the 3-0 count, we see every pitch being thrown in every count. And there really aren’t any big circles in the picture – no particular pitch dominates a particular count, with the exception of 3-0.
OK, sounds good coach. We know we will get one of four pitches, but we have very little information on which one might be coming when. Maybe we’ll learn something in the split second we have between when a pitch leaves Nola’s hand and when we have to decide whether to swing or not?
During
Now you’re standing in the batter’s box. Nola goes into his motion, and delivers the pitch.

According to Baseball Savant, Nola has a “very consistent release point.” The changeup comes in from about 4’8″, the fastballs from 4’9″, and the curveball from about 5’1.” What happens during the release is even more fun.
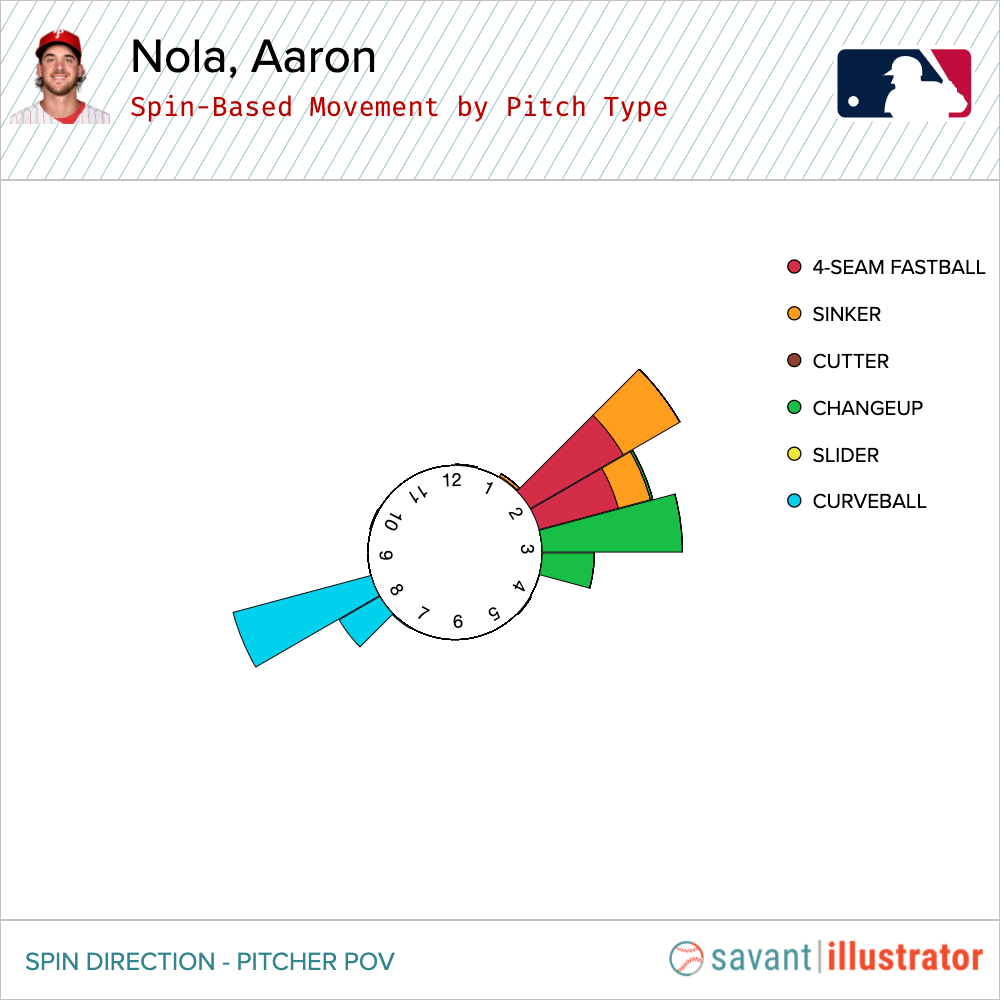
Let’s compare the two fastballs first:
| Fastball | MPH | Active Spin | Spin Axis | H. Break | V. Break |
|---|---|---|---|---|---|
| Four-Seamer | 92.8 | 98% | 1:45 | 13.9 in | 18.1 in |
| Sinker | 91.7 | 96% | 1:45 | 17.4 in | 24.4 in |
That’s two different types of a fastball, coming in at about the same velocity, thrown from the same release point, and spinning around the same axis at release. But one of them has about 3.5 inches more arm-side run and more than half a foot of additional vertical drop. I would imagine it is nearly impossible to tell them apart before one needs to make a swing decision.
If it’s hard to tell the two fastballs apart, what about the curveball?
| Fastball | MPH | Active Spin | Spin Axis | H. Break | V. Break |
|---|---|---|---|---|---|
| Four-Seamer | 92.8 | 98% | 1:45 | 13.9 in | 18.1 in |
| Sinker | 91.7 | 96% | 1:45 | 17.4 in | 24.4 in |
| Curveball | 78.6 | 86% | 7:45 | 15.1 in | 54.8 in |
The curveball averages 4.1 inches more vertical drop than other curveballs thrown at comparable speeds from comparable release points. What amplifies its effectiveness is how it compliments the fastball. Or in Nola’s case, his two fastballs.
I will not attempt to explain spin mirroring on here, as Michael Augustine does a much better job of it than I ever will. But notice that the spin axes for the fastballs (1:45) and the curveball (7:45) are exactly 180 degrees apart. In essence, the fastballs and the curveball are spinning along the same axis; the difference being that the fastballs are rotating “backwards” through the air because of the backspin on the ball, while the curveball is rotating “forwards” because of the topspin on the pitch. And for a batter to differentiate between topspin and backspin on a pitch in a split second is extremely difficult. (Seriously, go read the article. Well worth your time. There is a great animation demonstrating this point in there too.)
Alright, so what do we have so far? Three pitches that are extremely difficult to tell apart when they leave Nola’s hand and can be thrown in any count. Great. Let’s play a little game.
We have two fastballs, coming in at 92.3 mph on average, and a curveball coming in at 78.6 mph. If we were to add another pitch to upset a hitter’s timing further, how about we have it average exactly between the two at 85.45 mph ((92.3 + 78.6)/2). Also, let’s have the vertical break be halfway between the vertical break of the curve and the vertical break of the sinker, say around 40 inches.
| Pitch | MPH | Active Spin | Spin Axis | H. Break | V. Break |
|---|---|---|---|---|---|
| Changeup | 84.9 | 99% | 2:30 | 14.5in | 35.5in |
A full 40 inches of vertical drop on the changeup would be Logan Webb/Devin Williams territory. Nevertheless, the changeup fits perfectly with the fastballs and the breaking ball in terms of speed. It is released from a slightly lower spot than the fastballs but has about 10 more inches of vertical drop compared to the sinker. In 2020, opponents were just pounding it into the ground, slugging .296 on the pitch with a -6 launch angle.
To summarize, Nola has four pitches that complement one another extremely well and the ability and willingness to throw any one of them in any count. His unpredictability resulted in uncomfortable at-bats for players in 2020, who were more prone to look at strikes and swing at balls against Nola than against any other starting pitcher.
Fantastic article!
Excellent.