Evaluating the Career of Hanley Ramirez

Hanley Ramirez first came up with the Red Sox in 2005, had two plate appearances, and then was dished to the Marlins.  He officially started his regular career in 2006, and didn’t look back for the next five years.  He has often been credited for the many tools that he has or had: speed, hitting for average, and hitting for power.  But rarely has he been credited for doing all at the same time.  This article is to show you, the reader, exactly how rare Hanley Ramirez has been, and how to appreciate him correctly.

Since he came up to the major leagues in 2006 with the Marlins, Hanley Ramirez has wowed us with his skill.  In the early stages of his career, he was a young shortstop with amazing speed, good hit skill, and pop in his bat.  In that rookie season, he hit a solid .292 with an unexpected 17 home runs, and, most surprising of all, he notched 51 stolen bases.  He skipped the dreaded sophomore slump in his next big-league campaign, matching his previous total of 51 swiped bags, while improving almost everything in his stats.  He hit an amazing 29 home runs in 2007, while knocking in 81 runs and accumulating an impressive 5.2 WAR.  The most impressive part about that 2007 season, though, was his amazing .332 batting average.  

At this point in his career, many analysts and fans predicted that this would represent his regular prime stats — and what outstanding stats they were.  Yet it was not to be.  If believable, he got even better the next year, upping his homer total to 33, and improving both his walk rate and his ISO.  In addition, he raised his WAR to an astonishing 7.5.  Somehow, he did all this while dropping his BABIP 24 points, to ‘only’ .329, and stealing 16 less bases than in the previous year.  In his fourth year in the major leagues, his homer total along with that of his stolen bases dropped to below the 30 mark, but his average leaped up 40 points to .341!  His WRC+ also climbed 5 points to 149.  A less amazing year followed in 2010, but he was still impressive, hitting at a .300 clip with 21 homers and a 4.2 WAR.  

In 2011, he ended his streak of incredible campaigns, hitting for only a .243 average with a paltry 10 home runs.  In his first year as a veteran in the major leagues, Hanley picked his homer total up to 24, but his average remained below .260.  Overall, it was a pretty dismal two-year span for Hanley.  He rebounded spectacularly the next year, though, hitting .345 with 20 homers for a new team, the Dodgers.  Unfortunately, Hanley’s homer total dropped to 13 in 2014, but he kept his average up to .288.  He also drove in 71 runs that year, making the year not a complete failure.  

He didn’t keep up his good streak for long, though.  In 2015, with the Red Sox, his average dropped back down to .249, while hitting 19 home runs.  Coming into 2016, Hanley must have tweaked something in his approach, because he had his first solid year in a long while.  With everything complete, he had 30 homers and 111 runs batted in with a .286 average.  That is a comeback.  It’s crazy, though, when looking at the journey he’s been through in the big leagues.  He’s hit for power, has stolen bases, and accumulated 7+ WAR — twice!  He did all this at the plate while playing the middle infield, corner outfield, and corner infield.

So now that the whole length and breadth of Hanley’s career has been touched upon, there is now a base on which his career can be evaluated.  Starting, of course, from the year he came up, it’s obvious from the overview above that Hanley was spectacular.  It’s certainly not normal for a player of his youth (he was 23 when he broke into the majors) to be successful upon immediate entry into the premier baseball league in the world.  So when looking at his statistics from that first year, it’s not too surprising to see that his BABIP in that first year was an unrealistically high .343.  That could mean many things.  The first thought that comes to mind when seeing a BABIP that high is “an extreme overdose of luck.” However, a whole season (700 plate appearances) is long enough that luck would wear off after less than half the season went by.  The luck theory seems even more ludicrous when looking at the next four years of his career.  In those four years, he averaged a BABIP of .345.  

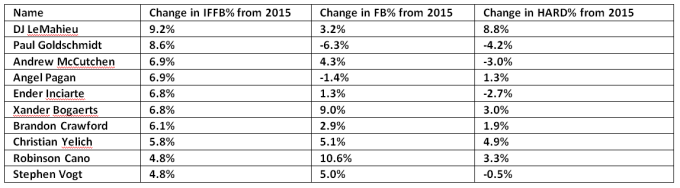
There is another well-documented theory that may be applicable to Hanley’s situation.  He could, like Paul Goldschmidt, have been hitting so many line drives that such a high BABIP is easily achieved.  However, this theory is disproved when his average line-drive percentage is seen.  He averaged a line-drive percentage around 19 percent, compared to Goldschmidt’s idealistic 24 percent.  

This is not a case when the easy way out is taken, and it’s just said “that’s just who he is, he just hits for a high BABIP!”  Indeed, it is not who Hanley is: after those five years, his BABIP dropped to just .275 and .290 for two years afterward.  Thankfully, this question is easily solved by a very simple answer, one that might have slipped through the cracks of many a research team.  Such easy an answer suffices, in a day when complicated statistical analysis-based answers are some of the only answers accepted.  This is one of the few cases in which all statistical-analysis answers are proven to be insufficient, so an old tool is called upon in place of them.  

Simply put, the answer is speed.  For the first five years of his career, Hanley had unbelievable speed, evidenced by his 196 stolen bases in that span.  Of course, speed has a bigger factor than just the occasional slow roller between first and second that was beaten out through pure speed.  Speed means the opposing team pulling in their third baseman in case of a bunt, or pulling in the whole infield so the speedster doesn’t get that aforementioned infield hit (both of these scenarios would result in an easier opportunity to get a hit, because it’s extremely hard to stop a hard-hit ball when fielders are pulled into within 75 feet of home plate).  Speed means getting hittable pitches, so one is not walked, and therefore given a chance to steal a base.  

This theory of speed makes even more sense when it’s seen that as soon as Hanley’s speed began to diminish, he stopped getting a high BABIP.  His lack of speed in the 2011 and 2012 seasons affected his whole offensive output in that span.  In those two years,  he hit for an average of .250, and stole only (for him) 41 bases during those two seasons.  His rebound the next year (.345 avg., .363 BABIP) was due in large part to an uncharacteristic line-drive percentage of 22 percent, and a hard-hit percentage close to 50.  His horrible season in 2015 was most likely because of many reasons.  During that year, he had almost no remaining speed, a chronic inability to hit the ball hard, and an array of injuries.  However, he rebounded this year, accumulating 30 homers while hitting a solid .286.  

How he did that, it’s hard to know.  He barely improved his line-drive and hard-hit percentages, and certainly did not suddenly gain speed.  It’s now safe to say that somehow, someway, Hanley has completely revamped his approach to hitting.  Now that his speed is gone for good, he still is managing to stay extremely productive while not utilizing his speed to make his stats great.  Of course, he’s not even close to being as productive as he was during that five-year stretch, but he has managed to do what almost no speedster has done in the past: stay productive after the age of 31, when speed starts to diminish.  Many a speedster has fallen prey to this ailment called aging, including (but not limited to) Vince Coleman, Carl Crawford, and Scott Podsednik.  Of course, there are many exceptions, mainly Rickey Henderson and Ichiro Suzuki.  So Hanley has joined an elite club, one that definitely does not fit his style of play.

Over his career, Hanley has proven to be able to hit for power, average, and line drives, while also running well for a while.  Out of the five tools in baseball, three are for hitting.  Hanley could be the image of each, from different points in his career.  

Speed: he had two straight 51-steal seasons.  

Average: he has a .295 career average over his 11 year tenure in the major leagues.

Power: he’s accumulated seven seasons of 20+ home runs.  

He truly is and has been one of the most talented players in the major leagues.  Despite this, Hanley remains to be one of the most underappreciated players in the major leagues.  Not many players have done what he has done in his career, yet he is viewed as a good comeback player, not as the personification of the tools in hitting.


Defense Is Cheap — and It Wins

One of the most common phrases in all of sports is “defense wins championships.” Defense isn’t flashy; it doesn’t put people in the seats (unless you’re a desperate Twins fan wanting to see Byron Buxton do more of this — or this). People like to see the home runs, the strikeouts. People also like to see the diving plays, but diving plays are a poor indicator of a team’s total defensive quality. So even the plays on defense that do put people in the seats aren’t indicative of a team’s overall level of defense. Other sports are the same way. People don’t realize the ins and outs of NBA defenses; they only see the steals and the lockdown plays — or lack thereof. NFL fans love to see big hits, but sometimes these big hits could be avoided if a team had defended the play better and stopped the ball carrier earlier.

Yes, it is true the nuances of defense can be monotonous, and this is true through all sports. Another factor about defense is the lack of a way to quantify defensive skill. Some metrics, like RPM (shameless plug to my boy Ricky Rubio, clearly a top-5 PG), try to do this for basketball. But in baseball, defense really is quantifiable, using different metrics that track can track how effective a defensive player or team is against league average. For example, read up on UZR, just one of the metrics that can put a number on a defense.

I came to this thinking on the undervaluation of defense through a different path. I had always wondered if an incredible defense could bail out an average pitching staff. I had always been interested in this facet; to reminisce, I once created an outfield of Torii Hunter, Rocco Baldelli, and Carl Crawford on MVP Baseball 2004. These were the best and fastest fielders in the game, and it seemed like they could get any fly ball. As much as I want to credit EA Sports for making an accurate game, I obviously cannot deduce the real-world effectiveness from a video game. Instead, I turned to the numbers.

To quantify how much a defense could “bail out” their pitching staff, I looked at the team’s average ERA compared to its average FIP. The difference between these numbers can somewhat quantify how much a team’s defense (and other factors) influence pitching from what we would expect it to be. For example, if a team had a FIP of 4.00, and an ERA of 3.50, this would indicate that a good defense was able to reach more balls than an average defense, meaning the team’s ERA should be lower, as there were more recorded outs than what we expect. The opposite, a team’s ERA being greater than its FIP, would indicate that a poor defense hurt their pitching staff’s performance, as they should have been able to get more balls that they did. To sum up, my hypothesis was that the teams with the largest FIP-ERA differences had great defenses, while teams that had the lowest FIP-ERA differences (negative values), had poor defenses. Now, I understand that many factors outside of defense can influence ERA, and that FIP does not perfectly match what a pitcher’s ERA would be with an average defense, but these anomalies will be canceled out in a large enough data set.

For the data, I measured playoff-contending teams (at least 85 wins) since 2002 (the furthest back I could get a value for a defensive rating) through 2015. From these teams, I parsed values for ERA, FIP, and defense, as well as the team’s payroll, runs scored, runs allowed, and run differential.

While taking my initial walks through the data, I saw two types of teams on this list. There were teams that scored few runs, but allowed even fewer, and there were teams that scored a host of runs, although they conceded a large, but lesser amount. The teams that scored little and allowed less had a common trend: they had great defenses and ERAs generally lower than FIPs. On the other hand, the teams that blasted the seams off the ball and had no problems putting runs on the scoreboard tended to have poor defenses, and their FIP-ERA difference was negative.

Using this data, I decided to run a regression analysis between a team’s defense and this FIP-ERA difference. There was a solid relationship between these two variables, with an r-squared of 0.48. This indicates that the difference between a team’s FIP-ERA difference tends to increase as the skill level of their defense increases.

fiperatodef

Now we know correlation does not imply causation, but this relationship indicates the strength within this relationship. The better a team’s defense is, the more likely their defense will be able to positively influence their pitching staff’s performance. These were teams like the 2002 Atlanta Braves, the 2011 Tampa Bay Rays, or the 2004 and 2005 St. Louis Cardinals. These teams didn’t have great offenses, but they had great defenses, they had good team ERAs, and they prevented teams from scoring runs.

On the other hand, there were teams like the 2003 and 2004 Red Sox as well as the Mid-2000s Yankees. These teams were those with massive payrolls that paid a premium for a punishing lineup. These lineups, however, lacked defensive talent, causing their pitching staffs to underperform their expected performances, as their teams’ ERAs were higher than FIPs.

So how related is this FIP-ERA difference to the amount of runs allowed? Well, pretty strong, with an r-squared of 0.46. Again, a strong relationship, this time negative, indicating that as a team’s FIP-ERA increases, the runs that team allows decrease.

fiperadiftora

To reinforce this relationship, I looked at defense and runs allowed. Again, this relationship showed a good, not great relationship, with an r-squared at 0.28.

ratodef

From these relationships, we can deduce that as a team’s defense rises in skill, the runs they allow tend to decrease and their team FIP-ERA difference tends to increase. Similarly, as a team’s FIP-ERA increases, the amount of runs a team allows decreases. From these relationships, we can conclude that these three variables are related.

As a team’s defense increases, they can positively influence the effectiveness of their pitching staff and will decrease their runs allowed. This may seem like common sense, and it probably is.

Now when we look at Bill James’ Pythagorean Win Expectation and other similar formulae, we notice that a team’s expected winning percentage is not dependent on the runs they score, but rather, their run differential. So yes, if you want to, you can construct a team like the Bronx Bombers and spend millions to assemble the some of the best lineups of recent history. If you’ll do that, you’ll hit score a host of runs, and with decent pitching and decent fielding (or below-average defense and good pitching — like those mid-2000s Yankees teams), you’ll be able to outscore your opponents and have a high run differential.

Or, you can assemble a team that will limit the amount of runs you’ll give up, by investing in defense. You will be able to compensate for average hitting and pitching, as you will boost your pitching staff’s effectiveness, and you will reduce the need for your offense to put up great numbers. Again, we have seen teams like this. The 2002 Braves were a combination of good defense, great pitching (aided by that defense), and average or perhaps even below-average offense; yet, this team won 101 games by scoring a mediocre 702 runs on the season (the average for the NL was 720 that season, 747 for all of baseball). Similarly, the 2011 Tampa Bay Rays put up 707 runs, against an American League average of 723, and still put up 91 wins and made the playoffs with good pitching and better defense. In fact, FIP would indicate their pitching was expected to perform right at American League average, a 4.08 ERA, yet they posted a 3.58 ERA.

Moreover, in that same season, the Los Angeles Angels won 86 games on just 667 runs, as they had even better pitching than the Rays. FIP would indicate the Angels’ pitching would be around a 3.94 ERA with league-average defense, but it was at a 3.57 ERA. The impact of good pitching paired with defense clearly is high, and I can’t think of one better, final example than the 2010 World Series-winning San Francisco Giants, who couldn’t have reiterated this structure any better: great pitching, great defense, and below-average offense.

So when one is trying to construct a team, and, unlike with the Yankees or Red Sox, money is a constraint, one might want to consider investing in defense. I say this because I looked directly at the relationship of a team’s payroll and their defensive ability, and it actually produced a negative relationship.

salarytodef

I know this data may be influenced by the fact that salaries have increased essentially every year in the span between 2002-2015, but if this truly did influence the graph, it would show either two things. Teams recently may have lessened their focus on defense and spent on hitting and pitching (explaining why defense-oriented teams had smaller payrolls); or, even with the rising caps, teams have still been able to assemble winning rosters by focusing on defense. Whether it is the first condition or the second, or perhaps a combination of both, perhaps defense is undervalued in today’s MLB. I doubt I’m the first to figure this one out, but the Cubs have far and away the best defense in baseball. Also, the Red Sox and Indians have stellar gloves as well, forming a solid second-tier level of defense that has put them in playoff position. So maybe Jason Heyward’s contract shouldn’t look so bad after all.

You don’t have to score a ton of runs to be a playoff baseball team. You just have to score more than the other team does, which can be done through limiting the amount of runs they score. It may seem like common sense, but common sense eludes us all at times.

There are many ways to construct a baseball team, and this might be just one more. And for stingy owners, it wouldn’t break the bank.


Has Tyler Flowers Finally Blossomed?

As expected, it was mostly a miserable season for the rebuilding Atlanta Braves. The team struggled mightily, especially on offense. The Braves scored the second-fewest runs in baseball. They owned an 86 wRC+, third-lowest in the MLB. In fact, they only had two hitters with a wRC+ of 100 or higher. The first is unsurprisingly Freddie Freeman, who sat at a sterling 153 wRC+. In second, there is a modest surprise: it’s Tyler Flowers, who sat at a 111 wRC+.

Rebuilding teams generally strut out their top prospects regularly, but they also play high-upside guys they signed off of the scrap heap. Flowers fits the latter description. Although he was drafted in the 33rd round, he raked in his first three professional seasons:

Season Team G PA HR SB BB% K% ISO BABIP AVG OBP SLG wOBA wRC+
2006 Braves(R) 34 150 5 0 10.70% 20.00% 0.186 0.326 0.279 0.373 0.465 0.389 135
2007 Braves(A) 106 445 12 3 11.00% 16.60% 0.190 0.339 0.298 0.378 0.488 0.387 133
2008 Braves(A+) 122 520 17 8 18.80% 19.60% 0.206 0.342 0.288 0.427 0.494 0.415 154

His first full season in 2007 produced an awesome 133 wRC+ and led to Flowers’ first prospect ranking. Baseball America named him the Braves 12th-best prospect after that year. He didn’t get another chance to be ranked in the Braves system after 2008 though, because he was traded right after the season ended. He headlined a package of prospects that went to the White Sox for Javier Vazquez and reliever Boone Logan. Vazquez went on to pitch 219.1 innings with a 2.87 ERA that season for the Braves, and Boone Logan would go on to become a pretty solid lefty specialist (although he wasn’t effective for the Braves).

The other prospects in the deal (Jonathan Gilmore, Brent Lillibridge, and Santos Rodriguez) were not as highly regarded as Flowers. Soon after the deal was completed, the post-2008 season prospect rankings were released by Baseball America. Flowers was ranked the fourth-best prospect in the White Sox system and the 99th-best prospect in the majors. Lillibridge came in at eighth in the organization, Rodriguez came in at 18th, and Gilmore came in at 21st.

The other prospects would go on to become non-factors. Gilmore and Santos have never reached the majors. Lillibridge has a 60 wRC+ in 784 MLB PAs and a negative defensive value, netting him a career WAR of -1.7.

Meanwhile, Flowers steadily climbed up the organizational ladder. His first season with the White Sox was great in Double and Triple-A:

Season Team G PA HR SB BB% K% ISO BABIP AVG OBP SLG wOBA wRC+
2009 White Sox (AA) 77 317 13 3 18.00% 24.00% 0.246 0.383 0.302 0.445 0.548 0.444 177
2009 White Sox (AAA) 31 119 2 0 8.40% 26.90% 0.152 0.394 0.286 0.364 0.438 0.363 126

That year, he even earned a September call-up. After the season, BA ranked him as the White Sox No. 2 prospect and 60th overall, and FanGraphs ranked him as the White Sox’s best. Unfortunately, in his next season, Flowers only managed a 108 wRC+ in Triple-A in 412 PAs. His strikeout rate escalated to 29.4%. Still only 25, he improved in his next season, garnering a 148 wRC+ in 270 Triple-A PAs (although his strikeout rate was a staggering 31.1%). This warranted Flowers’ first extended look in the majors. He was given over 100 PAs in each of the next five seasons, but he could never quite reach his potential. He showed power at times, with a .199 ISO in 282 PAs in his first two years, boosted by 12 homers. However, with a walk rate below 6% in the next three seasons, coupled with a K-rate of over 30% in two of those three seasons, Flowers could never get on base at a solid clip. To make matters worse, his power bottomed out. His ISO shrank to .118 last year in 361 PAs. Here are his offensive numbers on the White Sox overall:

PA H 2B 3B HR R RBI SB CS BB% K% ISO BABIP AVG OBP SLG wOBA wRC+
1360 279 50 2 46 119 142 2 5 6.30% 33.20% 0.155 0.311 0.225 0.288 0.380 0.295 84

So, despite tallying 27.3 defensive runs above average (according to FanGraphs) in his first five seasons, the White Sox non-tendered Flowers after 2015 because of his poor offensive output. The Braves (again!) scooped him up for a mere $5.3 million guaranteed over two years. That gamble seems to have paid off, because Flowers had his best offensive season in the majors this year. In 325 PAs, his walk rate is back up to 9%, above league average and his second-best in a season. His strikeout rate is down to its lowest ever, at 28%. His ISO, though still below league average, is up 33 points. His BABIP has skyrocketed, at .364, the highest of his career. All of this has led to a .270/.357/.420 triple slash, with a .338 wOBA and a 110 wRC+. What’s going on? Had Flowers made any changes? Is he finally going to reach his potential? Let’s find out.

First, let’s take a look at Flowers’ plate discipline. His O-Swing%, at 27.2%, is his lowest since 2011. That puts him in a tie for 79th-lowest out of the 266 hitters with at least 300 PAs this year. His below-average O-Swing% paired nicely with an above-average Z-Swing% (67.9%). He has the 63rd (out of the 266 hitters) best differential in those two categories (O-Swing minus Z-Swing). Basically, Flowers has been laying off of balls and swinging at strikes.

Possibly because he was swinging at better pitches, Flowers made much more contact. His swinging-strike rate (percentage of swings and misses against all pitches he has seen) dropped to 11.6%, easily the lowest of his career. His contact rate (percentage of contact against all swings) rose to 74.6%, a career best as well. While these two marks are still below average, they represent a significant improvement for Flowers.

Better selection seems to have led to better contact quality for Flowers. This year, he posted easily the lowest Soft% (13%) and highest Hard% (44.3%) contact percentages of his career. Using the sample of 266 hitters from earlier, Flowers tied for the 17th-lowest Soft%, and he had the fourth-highest (!) Hard% (just above teammate Freddie Freeman!). Statcast agrees wholeheartedly that Flowers improved his contact quality. He had the fifth-highest (!) average exit velocity among the 272 hitters with at least 170 batted-ball events this season. He added 3.2 MPH to his average exit velocity since last year. Statcast also says that Flowers tied for the fifth-highest (!) estimated swing speed out of the 294 hitters with at least 150 batted-ball events this year. In addition, he also dropped his popup rate (IFFB%) by more than 50% from last year. Lastly, his Pull% dropped a ton this year. He tied for the 38th-lowest Pull% among the sample of 266 hitters from earlier. Since he doesn’t pull many grounders, it’s harder to shift on him. Therefore, he’ll get more base hits on grounders. These improvements make it look like Flowers can maintain a high BABIP.

While these are all good developments, part of his improving plate discipline may just be because Flowers saw his lowest percentage of pitches in the zone since 2011 (45.8%), so it was easier for him to take more walks. In addition, many of these improvements are so much better than anything Flowers has ever done in the majors, so I’m guessing some regression is in order, especially in these areas:

O-Swing% Contact% SwStr% Soft% Hard% IFFB% Pull%
2016 27.2% 74.6% 11.6% 13.0% 44.3% 5.3% 34.9%
Career 31.0% 69.2% 15.1% 18.6% 33.1% 10.5% 41.8%

Another knock on Flowers: generally, exit velocity leads to more power, but most of the good numbers for Flowers there have come from his exit velocity on grounders, which won’t lead to more power. He had the third-highest average exit velo on grounders, but only the 26th-highest on fly balls plus line drives. However, 26th out of 272 is still good.

Despite the high average exit velocity, Flowers had the 19th-highest rate out of 272 in terms of barrel hits/batted-ball events (which is still good, but not quite as good as the other exit-velo leaders). This is another reason why Flowers may have a lower-than-expected power output.

Overall, there were definitely some encouraging signs from Flowers this year. He was more disciplined and he made more and better contact. His power should improve if he keeps hitting the ball hard and swinging at good pitches. In addition, although he had a negative Defensive Runs Added this year for the first time, his framing has improved tremendously in the last couple of years. He saved over 13 runs this year (fourth-best in the majors) after saving over 22 last year (second-best).

Flowers’ success in the minors supports his success this year somewhat, but then again, this is his first above-average offensive season in the majors (in six tries), and he’s not getting any younger (he’s 30). Furthermore, since BABIP is volatile, even for hitters with great contact quality like Flowers, it will be hard for him to be consistently good, unless his power improves (which it probably should) and he maintains his strides in plate discipline. He’ll probably be given enough at-bats for us to find out, given the Braves’ level of terribleness and his defensive prowess.

Data is from FanGraphs, Baseball America, StatCorner, and Baseball Savant.

Thanks for reading!


The 2016 All-WAR Team

The regular season is over. The playoffs are upon us. Award season will soon be rearing its head. Let’s take a very simple look at each position’s resident WAR leaders. All WAR data taken from FanGraphs.

1st Team
National League American League
C:  Buster Posey
1B: Freddie Freeman
2B: Daniel Murphy
3B: Kris Bryant
SS: Corey Seager
LF: Christian Yelich
CF: Dexter Fowler
RF: Bryce Harper
4.0
6.1
5.5
8.4
7.5
4.2
4.8
3.4
C:  Jonathan Lucroy
1B: Miguel Cabrera
2B: Jose Altuve
3B: Josh Donaldson
SS: Fransico Lindor
LF: Jose Ramirez
CF: Mike Trout
RF: Mookie Betts
4.6
4.9
6.6
7.6
6.3
4.6
9.4
7.7
TOTAL: 43.9
AVG: 5.5
TOTAL: 51.7
AVG: 6.5
2nd Team
National League American League
C:  Wilson Ramos
1B: Anthony Rizzo
2B: Jean Segura
3B: Justin Turner
SS: Brandon Crawford
LF: Starling Marte
CF: Charlie Blackmon
RF: Stephen Piscotty
3.5
5.1
5.0
5.6
5.6
4.0
4.1
2.7
C:  Salvador Perez
1B: Edwin Encarnacion
2B: Robinson Cano
3B: Manny Machado
SS: Carlos Correa
LF: Khris Davis
CF: Jackie Bradley Jr.
RF: Adam Eaton
2.2
3.8
6.0
6.4
4.9
2.6
4.9
6.0
TOTAL: 35.6
AVG: 4.5
TOTAL: 36.8
AVG: 4.6

I have excluded the DH as to keep both leagues’ data as similar as possible for comparison.

Interesting notes:

  • The AL has a much higher WAR overall and per player.
  • The top NL outfielders had a rough year with WAR. Not only do they total 12 WAR (2/player) less than the AL; outside of the C position, they are the lowest in the NL.
  • The NL players account for 79.5/285.5 WAR or 28% of the NL WAR total. While the AL accounts for 88.5/284, or around 31% of their total.

I find it particularly interesting that you only have to go two deep before finding players who didn’t manage a 3 WAR seeing as a 3 WAR is generally considered a solid MLB starter.

Players WAR 2016 (971)
WAR 7.0+ 6.0 5.0 4.0 3.0
# Players 5 13 23 47 62
% of League .5% 1.3% 2.4% 4.8% 6.4%

It’s not hard to see how truly exceptional the top players in the league are when compared to their peers across a 162-game season.

What sticks out most to you?


Rick Porcello’s Shot at the Cy Young Award

You’ve probably read countless treatises on the reasons that Chris Sale, Corey Kluber, or Justin Verlander would be more deserving of the Cy Young Award this year.

Well, I’m sorry to disappoint, but Rick Porcello is probably going to win the award. It’s going to upset a lot of quantitative purists that adjust for everything. Pick your favourite value-added statistic, and Rick probably doesn’t quite win it, or there is an inherent flaw where you can take something away from him on the stats that he did lead (WHIP and BB allowed). The truth is that this year’s winner will reflect quantitative and qualitative considerations.

Consistency, volume, and increasing difficulty  

He, of the never-meltdown. Rick allowed five runs once, and never failed to give his team 5.0 IP in any start this year. Not to suggest that innings-eating alone should be rewarded — Wade Miley, take a bow — but Porcello has provided a quality start in every start since June 28 (with the exception of one 4 ER, 6.2IP appearance on July 24). Tim Britton captures it well in a recent article for the Providence Journal, noting that every other candidate has been shelled a few times, and Hamels not once, not twice, but fifce! I’m sure it was nice for the boys in the dugout to know that if they played reasonably well offensively, that there was a very good chance to win every time Porcello was on the mound, and with it, a good chance that losing streaks would be rare for the team. A casual observation, much as any season-ticket holder in Boston might note, is that Porcello made one of the worst pitchers’ parks into a graveyard. 13-1, with a 2.88 ERA in Fenway, is no easy task.

With a decent start Friday night, Porcello finished with 223 IP. Both Sale and Verlander just clipped that, but Porcello finished near the highest inning total of the candidates, so workload could also be a consideration.

It also got no easier as the game wore on as he was better each time through the order: .264, .230, .195, and .121. Yes, Kluber has managed to pitch to some of the best soft contact this season, but that alone is not going to win the award, and is a fringy measure that does not have full traction from the press.

Image

Porcello puts in the work, keeps his head down, and would appear to be pretty humble about it. Most people didn’t even notice him over there in Boston. Porcello perhaps did not need to contend with throwback jerseys, but making confetti of your uniform isn’t the spirit of the game, and may well have left a Windy City starter as another man out this year.

Punishing wins & The Contender Effect

While it may be in vogue to punish pitchers for having good teammates, making allowance for consistency, Porcello has still won 22 games. Say what you will, but most people want a winner. A winner in a big market, with big stories, and a big slugger, are good things all-around for the league. Too often pitchers are victimized for the fielders behind them, but what is rarely addressed is that a pitcher can sometimes deploy this to his advantage, and Porcello has certainly made the best use of his team in this regard.

Frequency bias in the awarding of the AL Cy Young

Major League Baseball’s penchant for sharing has been well documented. This is well covered by a certain Managing Editor with a man who hits and walks, and who has been oft-written as being the ‘best-hitting guy’ every year, but who will likely finish second because, gosh, he’d much rather share with a friend from Boston with a winning smile. The writers association hasn’t allowed a repeat AL Cy Young winner since Pedro in the 99 & 00 seasons, and what I will call a ‘gap’ winner since 04 & 06 with Johan Santana. In both those cases, first-place votes were unanimous, and that certainly won’t be the case with this year’s crop. Kluber is ‘too soon’ (2014) and Verlander is too, well, I don’t know what, but he won it in 2011. Since Detroit failed to make the playoffs, I suppose you could pull in the Contender Effect that leaks into the psyche of proletariat, and certainly to some extent, with the voters.

Conclusion

It’s not that Porcello is so much more deserving of the award, but rather, that nobody else has distanced themselves from the pack so as to make themselves most deserving. In addition, he’s made a timely run for it against other guys who have ‘been here before’ or have given other reasons to not vote for them. He’s had some luck, but he has also shone in two of the leading controllable areas — by limiting walks (first among starters) and hits (first among starters in WHIP). There are qualitative factors that will affect the outcome and for these reasons, I think we’ll be crowning someone that has not won the award yet and that’s good for the game.


Why Extending the Blue Jays Spring Training Location Isn’t In Tampa Bay’s Best Interest

Last week, the Tampa Bay Times reported that the City of Dunedin and the Toronto Blue Jays put together a proposal that would keep the Blue Jays in Dunedin for another 25 years at a cost of $81 million dollars. The money invested in the project would be spent to upgrade the Blue Jays training facility, making it a year-round operating facility for the organization, and refurbish Florida Auto Exchange Stadium, expanding the stadium from 5,000 to 8,000 seats.

For nearly three years, my writing has taken a holistic view on baseball in Tampa Bay. I have taken to heart the premise of Major League Baseball and the mayors of our largest cities that Tampa Bay is a Major League region. In May of this year, I wrote an article for regional political website that asked whether local politicians believe this premise. I argued that unfortunately local politicians are acting in their own local self-interest and dividing Tampa Bay into four spring training/Minor League regions.

Last season, I wrote a post on another Rays blog that stated Tampa Bay is the fifth-most overextended sports market in America. The data for this post, from the American City Business Journals, stated Tampa Bay is currently $86 billion below where they need to be in personal income to support all the pro sports in the market. The study unfortunately did not include arena league football (Tampa Bay Storm), lower-level professional soccer (Tampa Bay Rowdies), and spring training, all of which locals in Tampa Bay spend money on.

This is why extending the Blue Jays in Tampa Bay is a bad idea. Allowing the Blue Jays to leave would allow other sports to receive fan dollars and aid their existence, removing one obstacle from an already overcrowded market. If the region values its major sports, it must allow the minor sports to walk away.

There are plenty of arguments used by the Blue Jays, the City of Dunedin, Bonn Marketing, and the team of hired economists that show why extending the Blue Jays is a good idea. This post will look at many of these points and provide alternate or opposing views.

Market Assumptions

In 2016, Blue Jays Spring Training attendance increased 5%. They were the only team in the Tampa Bay area that had a spring training attendance increase in 2016. Here is the Blue Jays spring training attendance since 2005.

First, the Blue Jays had their highest attendance the same year they had their most wins in 11 years. While this is not coincidence, there is little correlation between wins and attendance in previous seasons. This year, they again have a chance to win 90 games and make the playoffs. That should bode well for spring training attendance in 2017 and we can probably predict a similar turnout to 2016.

But what happens when the Jays stop winning? Will attendance fall below 5,000 again?

Second, the released economic studies detail how valuable spring training is to Pinellas County. The study states that of the over 70,000 fans that attended Blue Jays spring training, 79% resided outside of Pinellas County. These tourists brought in $70.6 million in income to Pinellas County.

If we subtract 5% from the $70.6 2016 income, we can estimate a $67 million impact in 2015. In 2015, the tourism total for Pinellas County was $4.65 billion.

Therefore in 2015, the Blue Jays accounted for 1.4% of Pinellas County’s tourism income.

The Dunedin-Blue Jays study fails to account for the other spring training venues. If 23,539 (32.4%) of the Jays spring training attendance stayed in Pinellas County, did they see the Phillies and Yankees who also train in the local region? If the Jays left, the region might only lose one night of visitors’ stay, not the entire 7.4 nights reported. Because of the other local teams, the Jays cannot assume they are the only cause of visitors.

Next, let’s breakdown the Blue Jays 2016 spring training attendance:

  • 72,652 total
  • Non-county attendance: 57,395 (78.9%)
  • In county attendance: 19,257 (26.5%)
  • Out of state: 23,539 (32.4%)
  • In state/Out of county: 33,856 (58.9%)

While we can safely assume the out of state fans stay in local hotels, what about the “in state/out of county”?

Local Spring Training Market Conflicts

Of the Jays 16 games in Dunedin in 2016, 7 were against teams with local ties (Phillies, Yankees, and Rays). Fans for those games could have either been from Hillsborough County or stayed at a hotel to also see another team’s games.

As for the 19,257 Pinellas County residents that went to see the Blue Jays spring training in 2016, their money could be spent on any other leisure activity, to include supporting the Tampa Bay Rays regular season games a month later and 21.7 miles away.

Many spring training supporters do not understand regional money spent on spring training could be spent on the Rays. They argue that the Rays don’t train in Tampa Bay, so they are not potential gainers of local spring training spending. Proponents of this view need to understand that money in hand on March 30 does not disappear on April 1. Fans of 28 other teams (Arizona excluded) wait until April to spend leisure money on baseball. If they are fans of an out-of-town team, they wait until that team visits their local team. This spending behavior is done all over the nation.

Waiting until the Blue Jays visit Tropicana Field would help the Rays’ bottom line and support Major League Baseball in the region. When locals buy tickets to spring training, they are spending their annual leisure money on a replacement good available before the premium product is released.

In 2016, the Rays accounted for 60% of all baseball tickets sold in the Tampa Bay area. This was an increase from the 58% in 2015, but far from the 71% of tickets sold to Rays games in 2009 and 2010. As a small-market team, the Rays can’t afford to have that much revenue diverted from their pockets. The Dunedin-Blue Jays agreement might even decrease the Rays percentage and give them less market share.

According to the Tampa Bay Times, 40% of the $81 million cost will go to stadium renovations. The goal is to expand capacity at Florida Auto Exchange Stadium by over 30%. If the Jays sell-out every spring training game (highly unlikely, but possible), their total spring training attendance will be 112,000. This would place the Blue Jays on level with the Pirates in Bradenton, who play in 8,500-seat McKechnie Field. Florida Auto Exchange Stadium would still be smaller than Bright House Field in Clearwater and Steinbrenner Field in Tampa.

A key missing piece in the presentations provided by the Blue Jays and the City of Dunedin is expected attendance. Where is an indicator of increased demand? Just because they’ll build it, doesn’t mean fans will come.

If fans do fill the new 8,000 facility, does the city and the team expect an increased amount of out-of-state fans to visit the new stadium or do they expect the same ratio of demand?

Using the same ratio of people from Pinellas County (26.4%) and assuming 100% sell-outs, 29,568 local residents will be spending money on a substitute baseball product in March 2019 onward. That is 10,000 more tickets purchased by money that could be going to the local Major League team.

Florida State League Market Impact

Following spring training, the facility will still be in use for the Florida State League season. Attendance for Florida State League baseball in Dunedin has been less than stellar. From 2010 to 2015, the Dunedin Blue Jays ranked last in the Florida State League in total and per game attendance. They did not rank last in 2016 due to the relocation of the Lakeland Flying Tigers to a smaller facility while their home stadium was being refurbished.

The current population of Dunedin is less than 40,000. Dunedin is one of the smallest towns in America to host a Minor League team. To fill an expanded Florida Auto Exchange Stadium would mean 20% of the entire population would have to attend. That is a huge demand for a small town.

Only 5.4 miles from the home of the Dunedin Blue Jays is Bright House Field, home of the Clearwater Threshers. Although they rarely play on the same day (only seven times in 2016), these two teams are in direct competition for hyperlocal dollars. They are the same product at the same level for the same cost. The Clearwater Threshers, however, play in a stadium off a major thoroughfare and have excelled in promotions, enabling them to close in on Florida State League attendance records.

The Dunedin Blue Jays would have to increase attendance by at least 300% to match the Clearwater Threshers. Unless new fans are created, expanding Florida Auto Exchange Stadium would likely cannibalize the attendance of the Clearwater Threshers, especially when the Dunedin park is in its “honeymoon phase”.

Emotional Factors

The City of Dunedin promotes that Dunedin is the only location the Blue Jays have called their spring home in their 40-year existence. While this has emotional value, the Dodgers were in Vero Beach from 1949 to 2008 before moving to Arizona and Dodgertown was among the most revered spring training locations in Florida. Teams move; it is the nature of finding the best place for business.

While there may be a bond between the Blue Jays and the City of Dunedin, according to polling, that bond has not translated into support for the Blue Jays. According the New York Times/Facebook survey in 2014, the top three most “liked” teams in Zip Code 34698 are the Rays (49%), the Yankees (16%), and the Red Sox (6%).

Understandably, Dunedin Mayor Julie Bujalski does not want the Blue Jays to leave. She is an elected official and maintaining the status quo is preferred to a loss that could cost her in the next election. She also doesn’t want to be the mayor who lost local revenue provided by spring training, although there is dispute whether or not revenue actually is what team-sponsored studies say it is.

On the other hand, there are many reports of areas such as Winter Haven, Florida, that have lost spring training and not suffered at all economically. University of South Florida Economics Professor Phillip Porter has been often quoted saying that “nothing changes” when a team skips town. Doubtful the City of Dunedin contacted Porter. They did however, contact Bonn Marketing, a Tallahassee, FL marketing firm that has written positive reports about spring training in Florida since 2009.

Other Blue Jays Options

Instead of reinvesting in Dunedin, the Toronto Blue Jays had several other options. They could have done any of the following:

  • Move to Clearwater and split the Phillies facility
  • Move to Viera, Florida where the Nationals recently vacated
  • Move to Kissimmee, Florida where the Astros recently vacated
  • Move to Port Charlotte and split the Rays facility

Of these options, only moving to Clearwater would keep the Blue Jays in a Major League market.

Due to the closed nature of the Dunedin and Toronto Blue Jays negotiations, we will never know what other options the Blue Jays considered. All we know is what they want in Dunedin and that Dunedin seemingly bid against itself.

Conclusion

Contrary to what the City of Dunedin, the Toronto Blue Jays, Bonn Marketing, and their hired economists have promoted, extending the Blue Jays in Dunedin is a bad idea. Until the Tampa Bay Rays are a successful franchise and have the same potential revenue as other small-market teams, local officials should decline renewal of spring training facilities in Tampa Bay. They should stop hedging their bets against the Rays and providing local residents inferior baseball goods in which to spend their money.

Even with tourism, Tampa Bay is not a big enough market to support Major League Baseball, four spring training facilities, and four Minor League teams. Declining to renew the Blue Jays and allowing them to find a new home in Florida is in the best interest of the region.


Should David Ortiz Play First Base In the World Series?

I have the mixed blessing of living in New England, so I unavoidably run into local sports radio once in a while. They’re already looking ahead to the Red Sox’ inevitable World Series appearance, and of course given David Ortiz’s unprecedented combination of offensive skills and just incredible foot pain/immobility, there’s a legitimate question of whether the Red Sox should play him in the field when they lose the DH in World Series road games. Just a quick-hit here on some of the relevant numbers.

I’m not going to address in this article the extent to which playing the field might limit his ability to hit or run. I don’t dispute that that could be significant, but I have no idea how to value that.

The way I see it, there are three options:

1. Move Hanley Ramirez over to 3B, play Ortiz at 1B, take Travis Shaw out of the lineup.
2. Replace Ramirez with Ortiz at 1B, keep Shaw.
3. Don’t start Ortiz, but do pinch-hit with him in a high-leverage situation.

We’ll make the following assumptions: I’m going to estimate that Ramirez will have the same defensive value at 3B that he had last year in LF (-22.9 runs), and I’m going to further estimate that Ortiz will have the defensive rating of some of the worst 1Bs in baseball over the past few seasons (-25 runs). Travis Shaw was worth 6.6 runs of defense playing mostly 3B this year. Ortiz was worth 27.6 runs of offense + baserunning, Ramirez 17.1, and Shaw -10.3. We’ll estimate that playing Ortiz would get him 4.4 plate appearances per start, whereas if he doesn’t start, he gets one plate appearance in a situation that has a leverage index of 2.

Scenario 1: Ortiz gives you 2.6 runs at 1B, Ramirez -5.8 runs at 3B, total of -3.2 runs.
Scenario 2: Ortiz gives you 2.6 runs at 1B, Shaw -3.7 runs at 3B, total of -1.1 runs.
Scenario 3: Ramirez gives you 1.8 runs at 1B, Shaw -3.7 runs at 3B, and Ortiz gives you 27.6*(1/4.4)*2 = 12.5 runs at PH, total of 10.6 runs.

Seems like the best option here by a decently wide margin is to use him as a pinch-hitter, and I’m surprised at how much of the value comes from just the pinch-hit appearance. Fairly robust to my assumptions, too — if you assume a leverage index of 1 in his one plate appearance, you still get the highest total with Ortiz as a PH. You could also give him a defensive rating of -15 (which would be incredibly generous) and the PH scenario comes out on top. Anything else I’m missing? Other lineup options for the Red Sox?


The Home Run Conundrum: Is It a Matter of How You Spin It?

I was looking into a separate but overlapping issue when I ran into the puzzling home run question. As has already been pointed out in prior research, exit velocities (EV) are up about a half a mile per hour over the last year; however, for most, this is not really a satisfying conclusion given the relatively small expected distance change from that amount of an EV increase. There has to be more to the story.

My other overlapping project was initially looking into loft. There seems to be an organizational push for more loft and players have made comments along these lines. Although the benefits of loft in terms of incremental runs are well-known, there has been very little discussion of the cost side of the equation – what is a player sacrificing in terms of optimal bat path / ball path matching? Of the three ways to generate loft, what is the cost for each and how do they rank? More to follow on all that in another article.

Organizations and players have touted backspin even longer than the more recent focus on loft. In terms of additional distance from backspin, it is significant. Research by Alan Nathan indicates spin could add 30-50 ft starting from a low spin rate. What if backspin was a key piece in the missing home run puzzle?

Since spin rates on hits are not yet available, I created a Distance Model based on EV and LA data from Baseball Savant where combinations of both EV and LA could be held constant (to a tenth) in order to separate out Unexpected Distance where spin is likely the largest component. I excluded all balls hit at Coors Field and focused on balls hit 90 MPH or more between the launch angles of 15 and 45 degrees. The Unexpected Difference was calculated for each hit in the range above for 2015 and 2016. Since the data showed a clear bias depending on the location of the hit, I made the following adjustments to take out directional bias based on the 2015 data:

Hit Location          Directional Bias (Ft)

Pull-Side Gap                   +17

Oppo-Side Gap                 + 7

Center                                + 7

Pull                                    –  6

Oppo                                  -12


Clearly, balls hit predominantly with backspin have more lift than those hit flat or with side-spin. Considering that Coors Filed alone was a +17.5 average difference, the average ball hit to the pull-side gap is about the same magnitude as hitting at 5,200 feet. Just for fun, I ran the Unexpected Distance for a pull-side gap hit at Coors Field — a whopping 39.8 feet!

Analysis of Launch Angle Buckets

On the whole, exit velocity, launch angle and distance on well-hit balls (>=90 MPH and >=15 degree LA) are all little changed from last year. However, the launch-angle buckets indicate that backspin is likely a factor, particularly in the 30-35 and 35-40 degree segments which account for a combined 58% of the increase in HRs over 2015 while only representing a combined 32% of the categories. Additionally, the majority of the 6ft and 7ft increase in these categories, respectively, are coming from the Mean Unexpected Distance (MUD) — or most likely spin.

15-20 20-25 25-30 30-35 35-40 >40
Chng EV (MPH) 0.4 0.4 0.6 0.5 0.3 0.1
Chng Avg. Dist (Ft) (1.1) 1.4 2.5 6.0 7.1 2.8
Chng MUD (Ft) (3.6) (0.9) 0.3 3.9 5.6 2.5
Chng HRs (23) 90 111 190 54 (7)

Note: Home runs in both years only include those with EV and LA data.

Looking at the distribution of balls in the launch-angle groups over the past two years, there has been very little movement between the groups other than a slight move from the lowest to the highest group (below).

Distribution of Balls Hit >=90 MPH and >=15 Degrees

15-20 20-25 25-30 30-35 35-40 >40
2015 23.3% 20.6% 17.8% 13.6% 9.7% 15.0%
2016 22.6% 20.6% 17.8% 13.6% 9.6% 15.8%


As reflected in the data, it is not that there are significantly more lofted balls being hit but the ones in the 30-40 degree range are being hit with significantly more backspin relative to last year.

In diving into the home runs in the 30-40 degree category for both years, I was expecting to see players with either high or increasing MUD values. While there were some of those players…

HRs in the 30-40 Degree Group (Backspin Gainers)

2015 HRs 2016 HRs Chng 2015 MUD 2016 MUD MUD Chng
Brad Miller 2 7 5 (3.7) 8.3 12.0
Ryan Braun 4 9 5 (1.9) 8.1 10.0
Mookie Betts 4 8 4 0.6 8.9 8.3


There were also some in the “flat” hitting group that were simply just hitting the ball “less flat than last year” that are showing up in the positive MUD change group…

HRs in the 30-40 Degree Group (Flat Hitters – Hitting Less Flat)

2015 HRs 2016 HRs Chng 2015 MUD 2016 MUD MUD Chng
Kris Bryant 13 25 12 (17.0) (10.2) 6.8
Evan Longoria 3 13 10 (4.0) 0.0 4.1
Miguel Cabrera 3 9 6 (8.4) (5.6) 2.8
Victor Martinez 4 11 7 (5.5) (2.0) 3.5


At this point, I was about to conclude that spin is definitely a factor but it could just be noise rather than an organizational push for more loft and/or backspin…and then I read Jeff Sullivan’s post the other day and now it all fits! Look at the table below of the players with the highest and lowest MUD values for 2016 and see if you can find it.

Top 10 MUD (Backspin Hitters) 2016 Avg EV Avg LA Avg Dist MUD
Max Kepler 97.3 24.6 362.2 16.7
Melky Cabrera 97.0 24.1 349.3 12.5
Martin Prado 95.8 23.9 346.9 11.7
Ketel Marte 94.9 23.7 340.1 11.2
Aledmys Diaz 97.8 26.4 357.7 11.1
Cheslor Cuthbert 97.4 24.9 346.7 11.1
Aaron Hill 95.9 25.0 345.0 11.0
Yangervis Solarte 97.5 27.1 355.4 9.8
Alexei Ramirez 94.4 29.3 348.1 9.2
Adeiny Hechavarria 95.8 24.6 342.8 9.2
Average 96.4 25.4 349.4 11.3


Bottom 10 MUD (Flat Hitters) 2016 Avg EV Avg LA  Avg Dist MUD
Freddie Freeman 100.0 27.8 343.2 (14.6)
J.D. Martinez 102.1 27.7 355.7 (13.1)
Addison Russell 99.0 27.1 343.1 (12.4)
Chris Davis 101.5 28.6 358.7 (11.2)
Joe Mauer 97.7 25.2 330.2 (10.7)
Trevor Story 99.2 28.0 350.1 (10.6)
Kris Bryant 100.1 29.8 353.1 (10.2)
Joey Votto 98.8 28.2 344.2 (9.5)
Mark Teixeira 99.5 26.8 348.1 (9.4)
Nick Castellanos 99.5 28.3 350.0 (8.8)
Average 99.8 27.8 347.6 (11.0)


Yes, of course! The answer is that it is not just because chicks dig the long ball, it’s that the market that values the players digs the long ball. Notice the significant difference in the exit velocities of the two groups. The players who are relying on spin are doing so because they have to get more distance and HRs out of their existing tool kit and are willing to pay (in terms of consistency) in order to get it. The players with higher exit velocities and hence more “natural power” can continue in their square hitting ways since they have no need to pay a high price for something they already possess. I didn’t average the height and weight of the two groups but I think it is clear that the backspin group is significantly smaller in stature than the flat-hitting group. Note the 2 ft average distance advantage of the backspin group with a whopping 3.4 lower average MPH difference!

Another interesting tidbit from the above data is the average launch angle is significantly lower for the higher backspin group. While this may seem counter-intuitive, it actually makes complete sense – in order to get backspin, you have to have less loft in the swing and rely on the ball contact point for loft. Since this is no easy feat, balls will tend to come off the bat with more variability with many hits matching the amount of loft in the swing and hence a lower trajectory.

What is happening with the home run issue is not randomness that is going to revert to the mean. It is a secular trend that is the result of the incentives in the system. Hitting for average with no power is out of style and players, particularly those with lower EVs, are likely responding by getting the ball out of the park any way they can – whether it is swinging harder, utilizing more backspin, or hitting to the shorter (pull) side of the field. (Could the latter be the next big trend?) While there will likely be additional findings regarding the home run question, the way I see it, at least part of it is as clear as MUD.


Modeling Walk Rate Between Minor League Levels

After reading through Projecting X by Mike Podhorzer I decided to try and predict some rate statistics between minor league levels. Mike states in his book “Projecting rates makes it dramatically easier to adjust a forecast if necessary.”; therefore if a player is injured or will only have a certain number of plate appearances that year I can still attempt to project performance. The first rate statistic I’m going to attempt project is walk rate between minor league levels. This article will cover the following:

Raw Data

Data Cleaning

Correlation and Graphs

Model and Results

Examples

Raw Data

For my model I used data from Baseball Reference and am using the last seven years of minor league data(2009-2015). Accounting for the Short-Season A (SS-A) to AAA affiliates I ended up with over 28,316 data points for my analysis.

Data Cleaning

I’m using R and the original dataframe I had put all the data from each year in different rows. In order to do the calculations I wanted to do I needed to move each player’s career minor league data to the same row. Also I noticed I needed to filter on plate appearances during a season to make sure I’m getting rid of noise. For example, a player on a rehab assignment in the minor leagues or a player who ended up getting injured for most of the year so they only had 50-100 plate appearances. The minimum plate appearances I ended up settling on was 200 for a player to be factored into the model. Another thing I’m doing to remove noise is only attempting to model player performance between full-season leagues (A, A+, AA, AAA). Once the cleaning of the data was done I had the following data points for each level:

  • A to A+ : 1129
  • A+ to A: 1023
  • AA to AAA: 705

Correlation and Graphs

I was able to get strong correlation numbers for walk rate between minor league levels. You can see the results below:

  • A to A+ : .6301594
  • A+ to AA: .6141332
  • AA to AAA: .620662

Here’s the graphs for each level:

atoaplusbbrategraph

aplustoaamaporig

aatoaaabbrategraph

Model and Results

The linear models for each level are:

  • A to A+: A+ BB% = .63184*(A BB%) + .02882
  • A+ to AA: AA BB% = .6182*(A+ BB%) + .0343
  • AA to AAA: AAA BB% = .5682(AA BB%) + .0342

In order to interpret the success or failure of my results I compared how close I was to getting the actual walk rate. FanGraphs has a great rating scale for walk rate at the major league level:

fangraphsbbrate
Image from Fangraphs

The image above gives a classification for multiple levels of walk rates. While based on major league data it’s a good starting point for me to decide a margin of error for my model. The mean difference between each level in the FanGraphs table is .0183. I ended up rounding and made my margin for error .02. So if my predicted value for a player’s walk rate was within .02 of being correct I counted the model as correct for the player and if my error was greater than that it was wrong. Here are the models results for each level:

  • A to A+
    • Incorrect: 450
    • Correct: 679
    • Percentage Correct: ~.6014
  • A+ to A
    • Incorrect: 445
    • Correct: 578
    • Percentage Correct: ~.565
  • AA to AAA
    • Incorrect: 278
    • Correct: 427
    • Percentage Correct: ~.6056

When I moved the cutoff up a percentage to .03 the model’s results drastically improve:

  • A to A+
    • Incorrect: 228
    • Correct: 901
    • Percentage Correct: ~.798
  • A+ to AA
    • Incorrect: 246
    • Correct: 777
    • Percentage Correct: ~.7595
  • AA to AAA
    • Incorrect: 144
    • Correct: 561
    • Percentage Correct: ~.7957

Examples

Numbers are cool but where are the actual examples? OK, let’s start off with my worst prediction. The largest error I had between levels was A to A+ and the error was >10% (~.1105). The player in this case was Joey Gallo. A quick glance at the player page will show his A walk rate was only .1076 and his A+ walk rate was .2073 which is a 10% improvement between levels. So why did this happen and why didn’t my model do a better job of predicting this? Currently the model is only accounting for the previous season’s walk rate, but what if the player is getting a lot of hits at one level and stops swinging as much at the next? In Gallo’s case he only had a .245 BA his year at A-ball so that wasn’t the case. More investigation is required to see how the model can get closer on edge cases like this.

galloatoasnippet
Gallo Dataframe Snippet

The lowest I was able to set the error to and still come back with results was ~.00004417. That very close prediction belongs to Erik Gonzalez. I don’t know Erik Gonzalez, so I continued to look for results. Setting the min error to .0002 brought back Stephen Lombardozzi as one of my six results. Lombo’s interesting to hardcore Nats fans (like myself) but I wanted to continue to look for a more notable name. Finally after upping the number to .003 for A to A+ data I was able to see that the model successfully predicted Houston Astros multi-time All-Star 2B Jose Altuve’s walk rate within a .003 margin of error.

altuvedfsnippet
Altuve Dataframe snippet

What’s Next:

  • Improve algorithm for generating combined season dataframe
  • Improve model to get a lower error rate
  • Predict strikeout rate between levels
  • Eventually would like to predict more advanced statistics like wOBA/OPS/wRC+

Paul Goldschmidt Has a Pop-Up Problem

When we were growing up, my dad would sometimes refer to my sister and me as ingrates. I always had a sneaking suspicion that statement was ruthless. I was young and under the assumption that he provided us everything we needed and wanted because that was what he was designed to do. In a sense, that perception of him probably does reflect the “ungratefulness” that young children tend to posses, innocent as it may be, what with a child’s inherently feeble comprehension of interpersonal relationships. I am now the parent of a two-year-old boy and just the other night he saw a commercial for a Power Wheels Jeep Wrangler that elicited the following outburst:

“I want to go in there!”

“I want one!”

Finally he turned to peer into my eyes and, in order to accentuate the severity of his next mandate, he raised his index finger and spoke;

“Daddy, better buy me one.”

His tone became dramatically more somber than it had been for the first two exclamations, and it made me laugh the hardest. I am certain I was the narrator of many statements similar to this as a kid, but the reality is, when kids are given everything they want, it’s up to the parent to understand that if there is a perceived lack of gratitude, it is a direct byproduct of the parent’s efforts to make them happy or even to keep them alive.

Lately I’ve been thinking of how I can be really ungrateful for even truly fine baseball seasons. Even some All-Star seasons disappoint me, and I know I’m not alone. If Mike Trout was in the middle of putting up a 5-win season, we’d all be talking about what could be wrong with Mike Trout. When players set the bar so ridiculously high we tend to hold them to that standard for better or worse. As an actual example, it’s completely understandable to be disappointed by Bryce Harper’s 2016 season after last year’s masterpiece. The reality is, however, that he’s 23 and has currently produced 3.4 WAR. His baserunning and defense have been positives and he’s compiled over 20 home runs and 20 stolen bases while hitting 14 percent better than league average; that’s damn fine and yet it’s still a damn shame.

Paul Goldschmidt, meanwhile, is hitting .301/.414/.494 and has accrued 4.7 WAR and might surpass 30 SB this year. His 136 wRC+ is still great even if it’s not quite the 158 he’s put up over the last three seasons. So why do I feel the loathsome inklings of disappointment bubbling inside of me? Firstly, and admittedly shallow of me, I like my Goldschmidt with more extra-base hits. For the first time in his professional career, at any level, Goldschmidt’s ISO starts with a number under 2. It’s possible he has a nice final week and brings that number up into the .200 range, but there are still some potentially concerning blips in his batted-ball profile that could portend of further decline in production. What I’m referring to most specifically, as the title suggests, is that Paul Goldschmidt has developed a pop-up problem.

From 2011 through 2015, Goldschmidt’s cumulative IFFB% was 4.8%. This year it sits at 14%. He has 17 IFFB this year, which is the same amount he had in the three previous seasons combined. Pop-ups aren’t good as they’re essentially as productive as a strikeout. Here are the 10 players with the biggest increases in IFFB% in 2016 compared to 2015 among qualified hitters in both years.

top-10-chart

I’m not suggesting there’s a positive correlation between popping up and performance, but it’s easy to make sense of some of the names that appear on this list. If you watched Josh Donaldson break down his swing on the MLB Network, you know that a lot of players are thinking about not hitting the ball on the ground because damage is done in the air. Did you know that DJ LeMahieu, at the time of this writing, has a higher slugging percentage than Goldschmidt? That’s bonkers. The league’s slugging percentage last year was .405, and this year it’s .418, but this group of players, minus Goldschmidt, have added, on average, 21 points to their slugging percentage, and part of that, for this group, has to be chalked up to putting more balls in the air.

popupsimprove

What I’m hoping to highlight is that what is even more troublesome for Goldschmidt is that he is the only player in this top 10 who had an increase in their IFFB% while also seeing his fly-ball rate and hard-hit rate drop.

goldschmidtpopsdown

So I have what could be an insultingly obvious hypothesis: since Goldschmidt has long been a quality opposite-field hitter, I am theorizing that pitchers are exploiting him with more fastballs up and in where he can’t quite get his hands extended. A cursory glance at his heat map vs. fastballs in 2015 and 2016 reveals a minor shift in approach by the league.


 goldschmidt-fb-2015goldschmidt-fb-2016

Besides the obvious, which is that pitchers are avoiding the zone even more than they had before, we can see just a bit more red in the specific zone I was referring to. It’s not so glaring or even enough information to make any conclusions, so let’s see if that area is where pitchers are getting Goldy to pop up. On the year, per Brooks Baseball, he has 22 pop-ups, 19 from fastballs and three from offspeed pitches. The 17 that are classified as IFFB by FanGraphs are plotted in the graph below.homemade-heatmap

*the two pitches towards the outside corner (for Goldschmidt) are sliders.

However, it’s not as if pitchers have previously avoided throwing Goldschmidt up and in; it just appears, despite his overall swing rate being at a career-low 39%, he’s upped his swing rate against fastballs by over five percentage points in that specific area just above 3.5 ft. And that area has the largest concentration of his pop-ups.  Looking at the entire area middle/up/and in to Goldschmidt, he has increased his swing rate from 57.2% in 2015 to 60.7% in 2016 while staying away from lower pitches in general. It’s a philosophy that is being echoed throughout baseball right now, and it is not at all a bad plan, but it has caused him, either deliberately or due the effect of swinging at these pitches more often, to go to the opposite field this season less than he ever has. This also is not necessarily a negative shift in regards to a batted-ball profile, but from 2013 – 2015 Goldschmidt was the fifth-most productive hitter in baseball going the other way, and in 2016 he’s 33rd. That represents a drop in wRC+ from 204 to 158, and from a .729 SLG (.329 ISO) to a .647 SLG (.255 ISO). I’ve long since regarded Goldschmidt to be in the same tier of hitters as Trout, Votto, Cabrera, and pre-2016 McCutchen, and it would be a shame for him to move away from a facet of his game that enables him to produce at that elite level.

At the end of this season I don’t think I’ll actually be all that worried about Goldschmidt; I can reconcile a 136 wRC+, even if it would feel a little disappointing. I wrote about Paul Goldschmidt last year and I wasn’t worried then, either. But I do think if I’m going to take a 136 wRC+ for granted I should place that appreciation toward the catalyst for this change in Goldschmidt’s performance, and a lot of that credit has to go to the pitchers who have induced 17 IFFB from a player who only averaged 5.7 over the last three seasons.

Now I know that setting up a pitch has so much more to do with an entire at-bat, game, or even season than the pitch that was thrown immediately before it, but for this exercise I want to look at the pitch that caused Goldschmidt to pop up and how it relates to the pitch thrown immediately before it. It’s crude and does not tell the whole story, but it still shows a definite approach — and, for all intents and purposes, it’s probably a decent representation of a general tactic used across the league for inducing pop-ups. I found all the data I needed using PITCHf/x at Brooks Baseball and I recorded the velocity, horizontal movement, vertical movement, horizontal location, and vertical location of each pitch Goldschmidt popped out on as well as the same data set for each set-up pitch if there was one (which would be in any situation where Goldschmidt did not pop up on the first pitch of an-bat). Below you’ll find a plot that shows the average location and characteristics of each pitch.

poppy-uppies

And here is that data in a table represented as the average difference between the two plot points.

pitchdiff

Doesn’t it make you feel warm when something fits into the shape you had pegged it to be? That’s just really simple and makes a hell of a lot of sense. Or maybe I feel warm for taking something that was disappointing and turning it into something I can really appreciate.  Now if you’ll excuse me, I have a Power Wheels Jeep Wrangler to buy.