Author Archive

The St. Louis Cardinals Have a Type

This series will cover various trends I’ve observed major-league baseball teams following. Some trends will be analytical while others will be more…”conceptual.” Trends may span a season, or even several, it doesn’t matter, I don’t want to limit myself out of the box. Ideally, I’d like to cover all 30 teams, but I also don’t want to expect too much of myself out of the box, either. After all, I don’t have Francisco Lindor’s smile to pull it off.

Image result for francisco lindor trips on bat gif

Maybe that kind of thinking is limiting — not the part about Lindor’s smile (though in a weird way it does tie in), but maybe I like to undertake something with the caveat that I might not follow through because of experience, mine or others (see Stevens, Sufjan — 50 states project). Or maybe I don’t want to underestimate the extent of my laziness. Or maybe I’m just a glass-half-empty kind of guy…

And maybe all of this relates to my face.

From Wikipedia: “Physiognomy is the assessment of a person’s character or personality from his or her outer appearance, especially the face.”

It’s no secret that we’re all judged on our outer appearance. Some studies have shown it even relates to how well we’re paid. A predisposition towards handsome exists in baseball, too. It’s in the old scouting maxim, “the good face,” which essentially is the baseball colloquialism for “hottie.” But it can also refer to the potential presence of naturally-elevated levels of testosterone, as a strong jaw and well-defined cheekbones are sometimes indicative of the hormone.

Hogwash! Right? Well, have you ever wondered what it would be like to look like Brad Pitt and thought about how differently people would react to you? Now, I’m not talking about a matter of right or wrong, but people would generally respond more positively to you, both socially and professionally, and that does have an impact on confidence, which plays a massive, albeit intangible role in a baseball player’s on-field success.

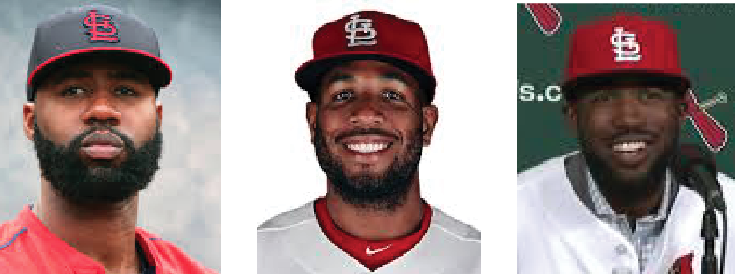
But, come on. With all the advanced methodology we have to evaluate players, isn’t the “The Good Face” adage a thing of the past? I’m sure it’s probably lost some of its weight in the player-evaluation process, but it hasn’t disappeared. In fact, in the evaluation process used by (arguably) the most successful team of this decade, it’s very much alive. In recent memory, there have been enough handsome doppelgangers in their mix to wonder if the “Cardinal way” isn’t some iron-clad philosophy the organization established to allow them to get the most out of their young players, but that it might just be a certain type of guy!

You’re at FanGraphs, and so I assume you’re a savvy individual and that you know a ruse when you read one, but I want to qualify this writing by saying that this proposition is roughly ~0.0000000000000001% serious. Okay, so essentially, there are six archetypes for Cardinals players’ faces.

  1. The Wain-Os

oval

Pseudoscience says: “If you have an oval face shape, you always know the right things to say.”
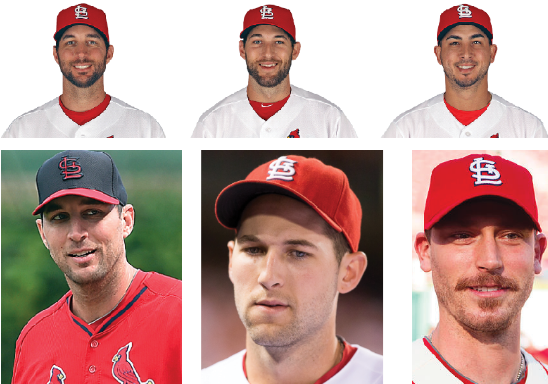
wain0

2. The Kozmakazies

square

Pseudoscience says: “If you have a square-shaped face, you are gung-ho and a total go-getter.”
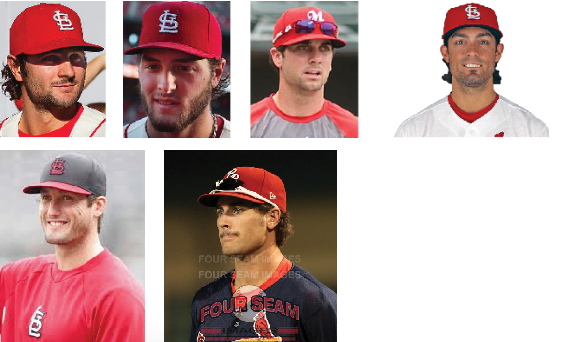
squaress

3. The DesCarpenSons

rectang

Pseudoscience says: “You value logic and you’re a really good thinker. Plus, you’re an awesome planner.”

4. The Lynnburger

heart

5. The Ambiguous Pham

ambig

Pseudoscience says: “If you have a diamond face shape, you’re a control freak. You’re very detail-oriented…”

6. We Don’t Want No Scruggs

oblon

Pseudoscience says: See the Wain-Os

Yes, it helps they’re in the same uniform, and yes, I very obviously cherry-picked some of those, but aren’t you still a little floored? The variation here rivals the lack of distinguishability featured among the male contestants on the Bachelorette.

So isn’t this proof of old-school scouting at work? What gives with all the talk of the Cardinals’ cutting-edge front office — are they just masquerading with the hiring of NASA data analysts and organizational philosophies? Or have they truly married the new school and old school? Maybe there is something to building a roster of similar-looking players that prevents “fault lines” from forming.

Or maybe…

Think back to the hacking scandal of 2015. The Cardinals’ new Director of Scouting, Christopher Correa, hacked the Astros’ database for information on players regarding the draft, bonuses, and trade talks. Keep in mind, he was working for the Cardinals, not a brand-new expansion team; he could’ve hired anyone he wanted to work for him. He could’ve had his own NASA data analyst, just like Jeff Luhnow had done before him. I know that in the minds of these men, there’s a lot at stake, and so they look for any competitive advantage they can, but this scenario feels like it’s the smartest kid in class copying off the other smartest kid in class on a math test.

So what did Jeff Luhnow have access to that Correa didn’t?!

It was one file, actually. A file buried deep within the infrastructure of the Astros’ database. A file called “Stardust” (Yes, like in Rogue One). Allow me to explain.
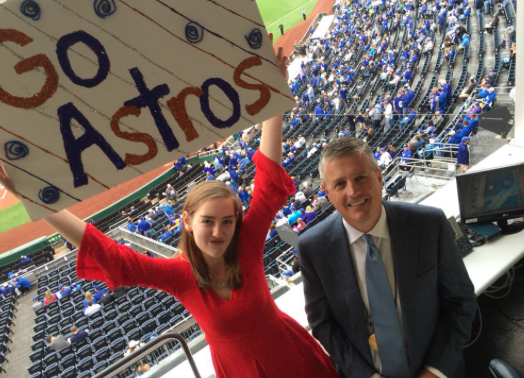
This is daughter Luhnow. Her name and age are unknown (Jeff did not respond to my tweets), but my wife estimates her to be 19 in this photo. If we work off that number, she’s at least 20 now, and that means she’s probably been able to identify boys she thinks are cute for around 15 years, which lines up perfectly with when her dad was hired by the Cardinals in 2003.

Imagine it, “it’s easy if you try;” one day, a five-year-old daughter Luhnow wandered into her dad’s office and climbed up onto his lap while he was looking at some files of some players he was targeting to acquire. Mostly just talking to himself, Jeff explained the pros and cons of each player to his daughter and showed her their pictures. When he got to a young pitcher in the Atlanta Braves’ farm system, she put her hands to her mouth and giggled. “What’s so funny?” Jeff asked his suddenly-bashful daughter. Her face was nuzzled in her dad’s chest, so the words were a bit muffled, but Jeff heard them clear as day. “He’s cute,” she responded.

It was a strange moment for Jeff — he wrestled back the protective instincts welling up inside him, but as he looked at the picture of the lanky, young right-handed pitcher, he realized that she wasn’t wrong. Adam Wainwright was handsome in an awkward, President’s son kind of way.
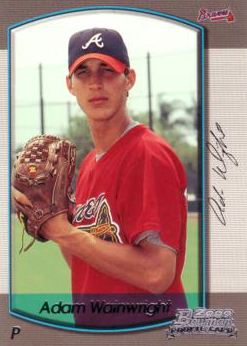
While this was the deciding factor for Jeff, he was thrilled that he wouldn’t have to admit that to his bosses, because Wainwright was also a top-100 prospect. So the Cardinals sent J.D. Drew and Eli Marrero to the Braves for Wainwright, Jason Marquis, and Ray King (an admittedly motley crew).

Jeff remembered that moment and would, from time to time, call his daughter into his office and gauge her reactions to the players he’d show her. Eventually, however, he didn’t need to call her in anymore. Daughter Luhnow liked baseball, and liked looking at the pictures of the young men; it was like reading a Teen Beat magazine with her dad!

Before I go any further, I want to note that this is one of those conceptual pieces I referred to in the intro, and that the parts about daughter Luhnow are entirely fictitious. There are also no underlying misogynistic themes at play here. I believe a woman could run a major-league baseball team as well as any man — I just think the idea of a team as renowned and successful as the Cardinals being run on the lustful whims of a teenage girl is really funny.

So the way I see it, she had her own Excel spreadsheet where she could rate the features of potential acquisitions on the same 20 – 80 scale as scouts. She could comb through high-school, college, minor-league, and major-league rosters and highlight her favorite guys by coming up with an overall score.

This authoritative list, while completely undisclosed until now, has unwittingly been at the center of a couple of controversies. It is what ultimately drove the wedge between Walt Jocketty and the Cardinals, and also, as previously mentioned, is the holy grail that Christopher Correa was in search of when he hacked the Astros’ database — and what he is currently serving a 46-month jail sentence for.

About the moves that Correa made without the elusive “Stardust” file. He had an idea of her type of guy based on previous transactions, and he was able to make some quality, daughter-Luhnow-inspired acquisitions. Of course, that’s hardly a silver lining. Try explaining to your cell mate that you’re in prison for hacking into someone else’s computer for a list of cute, young men (some of which are still in high school!).

You get it. You’re on board. The Cardinals’ success has largely been driven by a teenager’s romantic fantasies. Okay, maybe not. Regardless, I still have a hard time telling the difference between Adam Wainwright and Michael Wacha and I want to see if you are any better. Here are eight pictures of the two Cardinal pitchers, four of each; in the comments section, please attempt to sequence these correctly, and that’s it. This is what happens in the doldrums of the offseason!

answer-key


BatCast the Bat Flip Tracker: Oh, How the Wood Was Chucked

“Make baseball fun again” is Bryce Harpers outcry against baseball fundamentalists who continue to police emotions and enforce baseball’s expressionless professionalism.  “Shut up and play the game right” might be something you’d hear uttered from the fundamentalist’s side — ideally through tobacco-glazed teeth — and maybe by Brian McCannThe discourse is of course more involved than that, covering everything from retaliatory plunk balls to bat flips, and anytime something marginally inflammatory happens, it’s beaten so hard that we’re reminded how boring our lives are that we have to discuss the same things over and over and over.  I know you can picture the media package that accompanies the discourse: a young, brash, exquisitely coiffed, generational talent, who was hit in the ribs in his first ever plate appearance (then proceeded to steal home), is unabashedly passionate about a “fun” revolution in baseball.  His eye black is adorned like war paint; he has emojis on the bottom of his bats; his helmet never stays on his head when he runs the bases; and yes, he “pimps” his home runs.  Cut to Joey Bats‘ ALDS bat flip and the ensuing brawl and then connect it with Rougned Odor’s haymaker; cut to Brian McCann standing at home plate waiting for Jose Fernandez after his first career home run; then enter the commentator: “Is this wrong?”

While baseball’s moral code on gaining an edge is unpredictable, there’s always been the idea that individuals conform to the game, not the other way around.  Harper’s sermon won’t shatter the code of conduct, but it might move the needle, if it hasn’t already.  For example, I can’t think of a standout incident this season because of a bat flip.  That’s good! Because bat flips are really fun!  There’s really no need to overthink it.  There were plenty of memorable bat flips this year, and in an effort to make some fun out of baseball when there is no baseball being played, I’m breaking out my bat flip tracking equipment (a ruler, a stop watch, and a parabolic trajectory calculator) that I introduced last year, and booting up BatCast for a look back at the year’s most memorable wood-chucking moments.
A brief recap: arriving at these numbers is a sloppy and wildly imprecise affair.  I pull videos, gifs, and stills of a bat flip and start by measuring the height of the player as he appears on my screen.  I convert that measurement into the player’s real-life size and reference this ratio, as well as measurements on the baseball field, and rough estimates, to arrive at some of the data I present to you in meters and feet: initial height, apex, and distance.  Using a stopwatch or the time stamp on YouTube, I can declare a fairly accurate hang time of the bat.  Angles are roughly noted using the batter and the ground to form a 90-degree angle and are adjusted in the parabolic trajectory calculator.

Let’s kick this off:

Exhibit A – The one that’s probably at the forefront of your mind:

Asdrubal Cabrera

Date Inning Leverage Index ΔWE% Implication
09/22/16 11 4.42 82.5% 0.5 gm ld in WC

Statcast

Exit Velocity Launch Angle Distance
102 mph 28.50 393 ft

Le Flip

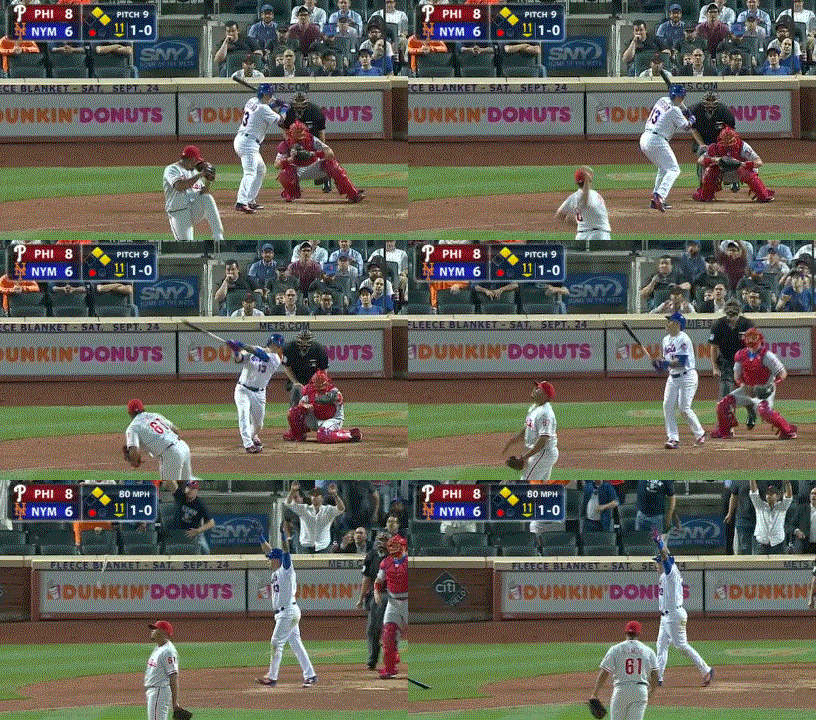
asdrubalbatflip092216

How about in slow motion?

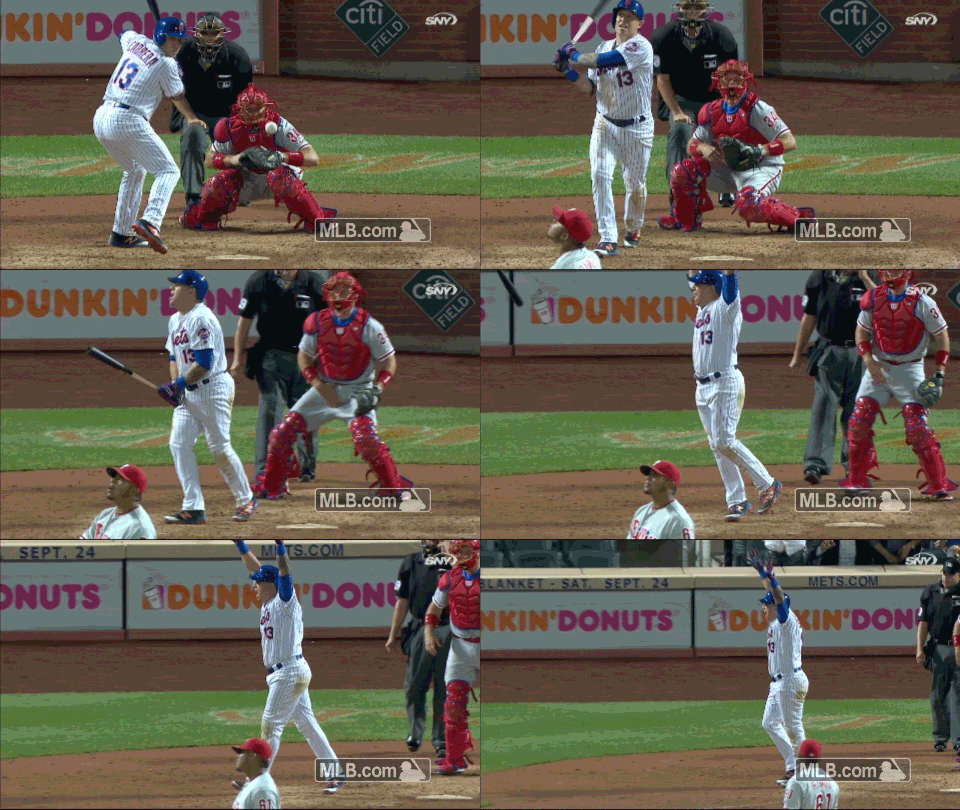
092216_asdrubal_walkoff_slomo_med_m9up6w4p 

Ejaculatory!
How many of his teammates do you think saw that flip?  They may have seen the tail end of it, but I’m willing to bet zero saw the flip in its entirety because everyone in the dugout was gazing at the ball in flight.  But this was a no-doubter.  Edubray Ramos resigned to the outcome likely before the ball had reached its apex.  The Phillies weren’t playing for anything at this point, but the Mets?  Before this pitch, the Mets were tied with the Giants and Cardinals for the top wild-card spot.  Before this pitch, in the 9th inning, Jose Reyes erased a two-run deficit with a home run of his own, only to see that lead given up again when Jeurys Familia and Jim Henderson allowed two runs to score in the top of the 11th.  After this pitch, this game ended and they had a half-game lead on any team in the National League for the first wild-card spot.  That bat flip is a team effort.  There’s some “I did it” in there, but the way he looks towards the dugout and offers his bat up towards his teammates makes this feel like “We did it!”

The numbers:

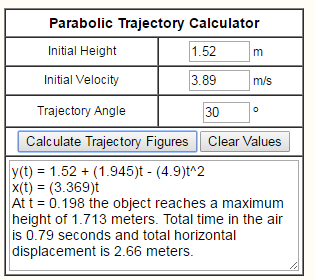
Cabrera is listed as 6′ tall.  On the freeze frame I measured, he’s 1.9″ tall.  So our key tells us that 1″ on the screen is 37.9″ in real life.  When he releases the bat, he does so from about shoulder height and we’ll call 5′ (1.52 m) in real life.  The acme is, it appears, not a great deal lower than the top of Asdrubal’s head, so we’ll tally that down at 5′-7″ (1.71 m).  To me, the launch angle looks to be right around 30 degrees, and we’ll refine this number once we get them in the parabolic trajectory calculator.  The duration of flight I’m using is the average number I’ve come up with through timing the video 10 times — 0.79 seconds.

Parabolic Trajectory Calculator:

ptraj

BatCast

Exit Velocity Launch Angle Acme Distance
8.7 mph 30 Deg 5’-7” 8’-9”

Exhibit B – A Man Possessed:

Matt Adams

Date Inning Leverage Index ΔWE% Implication
07/22/16 16th 1.71 42.7% 2nd straight walk-off for Cardinals

Statcast

Exit Velocity Launch Angle Distance
105.8 mph 28.34 444 ft

636048353090779282-gty-579171664-83514488_1469294083291_4281277_ver1-0

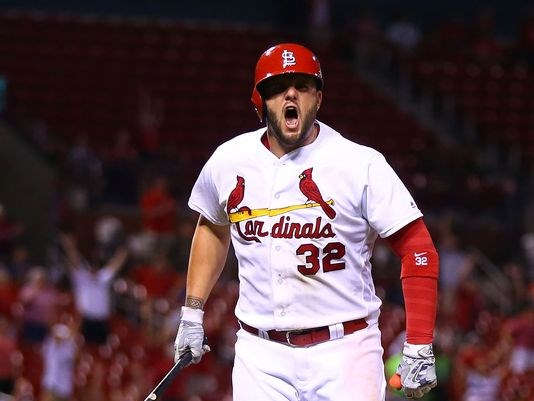
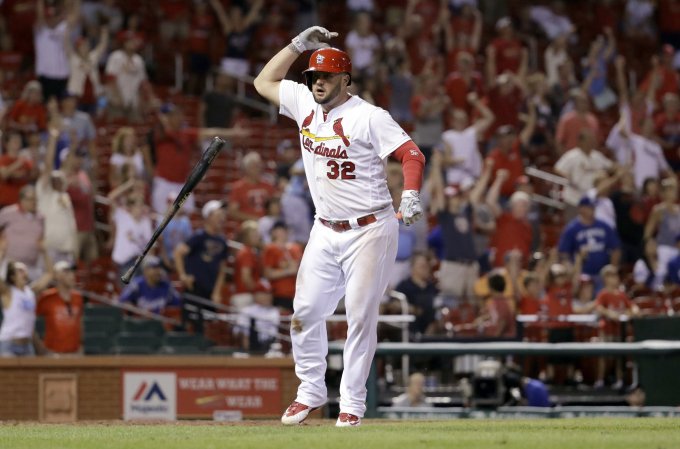
If this picture was part of an emotional intelligence quiz, I’m sure the answers given as to what facial expression is being displayed would vary greatly.  To accurately assess the information in this picture it may behoove one to understand that, in baseball, home teams wear white and that the man in the background is most likely a fan of the home team and that his hands are held high in jubilation.  If you’re only looking at the horrifying ogre in the foreground who appears to be screaming at 67 Hz+, the pitch only a dog can hear, you’d be hard-pressed to say that is a happy man.  In fact, he may not be happy yet — he’s likely evoking a form of relief, having just exorcised the demons one faces when up to bat in the 16th inning of a tie baseball game; he looks like pure adrenaline.  Most of us don’t get to experience a moment like this in our lifetime so we don’t have a really strong reference point for what he’s feeling, but luckily you know what this article is about and there’s a gif:

giphy

PUMP! PUMP! PUMP IT UP!

That’s all lizard brain right there.  It’s a little undignified, but that’s the beauty of it.  Matt Adams is a dense, hulking man, and that makes it a little scarier and a little sillier.  Look:

matt-adams-b809f422f7cc9370

Sassy.

The numbers:

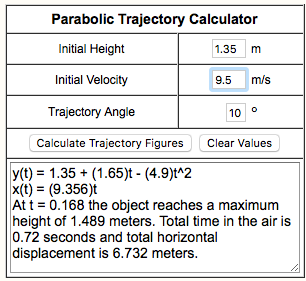
This one is especially hard to measure because of Adams’ primitive (yet graceful) movements.  I extracted these numbers using the still image and the video:

screen-shot-2016-11-28-at-10-04-38-pm

BatCast

Exit Velocity Launch Angle Acme Distance
20.6 mph 10 Deg 4’-11” 22’-1”

Exhibit C – Into the Batosphere

Yoenis Cespedes

Date Inning Leverage Index ΔWE% Implication
08/29/16 10th 1.23 47.0% The first baseball bat in outer space (for America – Korea has several).

Statcast

Exit Velocity Launch Angle Distance
101.9 mph 28.33 416 ft

Yoenis Cespedes made it into my BatCast segment last year with his nifty flip in the NLDS.  This flip follows a similar trajectory but he varies his look this time with a cross-bodied toss.  It’s rude:

082916_cespedes_bat_toss_med_k3thrcyn (1).gif

“Hold my drink, bitch.”

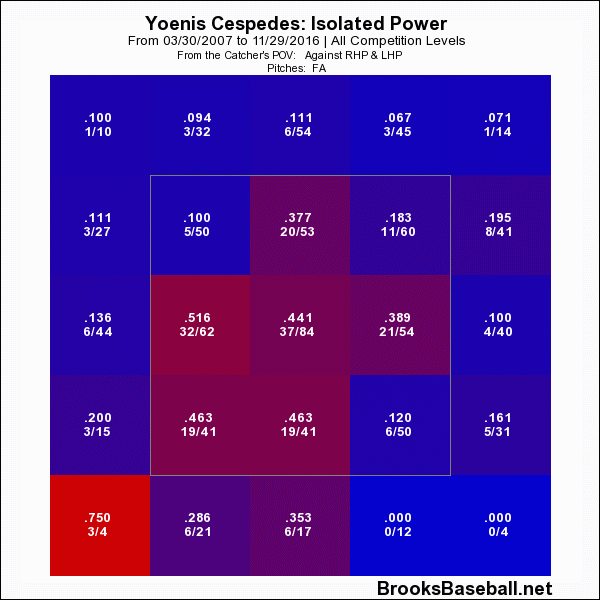
While the lesson here is obvious, the mistake is not as easily avoided: get the fastball ball UP and in on Cespedes.

plot_h_profile

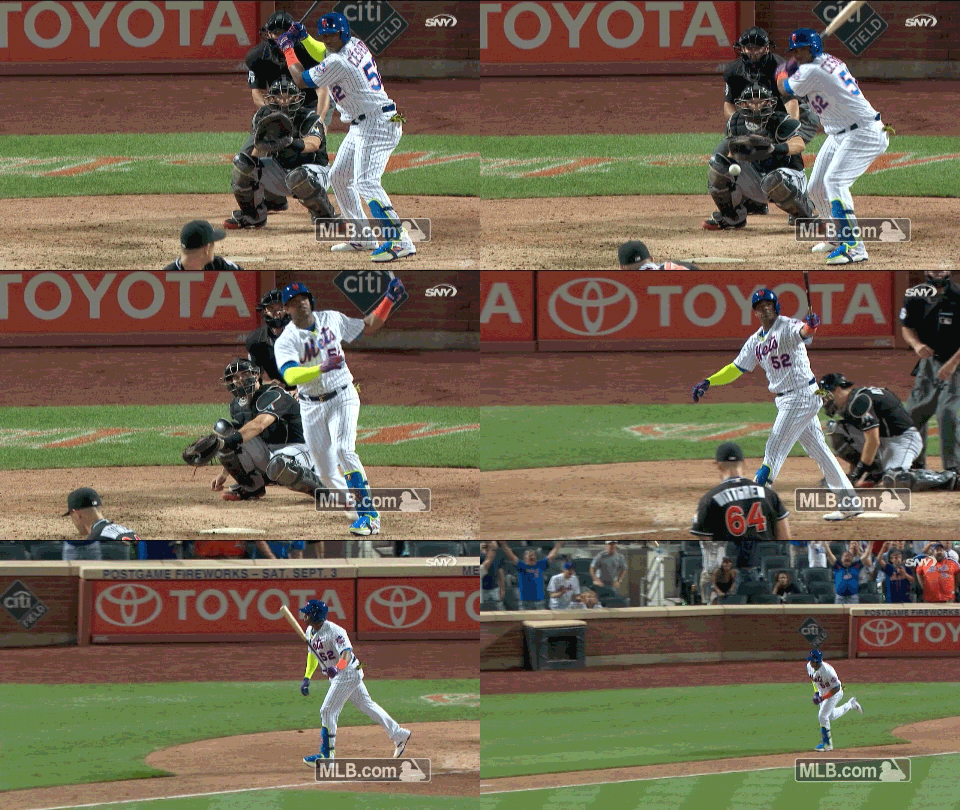
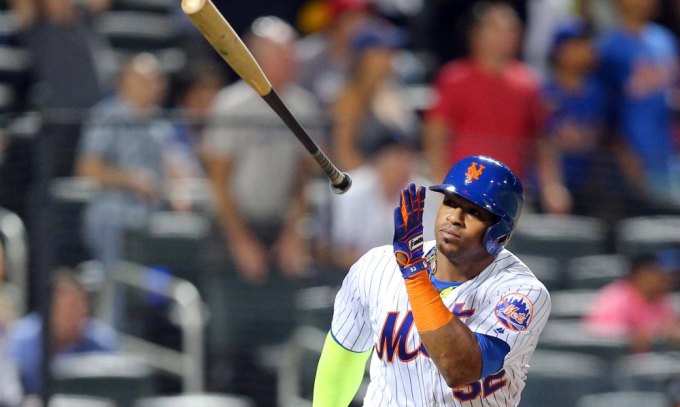
Because of the evidence we have, the numbers for this bat flip will be even more rough than the others — by the way, I hope you’re not a mathematician, and I apologize if you are.  The data we can gather is the launch angle and at what time stamp the bat reaches it’s highest point.  Here’s a better view of the angle:

USP MLB: MIAMI MARLINS AT NEW YORK METS S BBN USA NY

Can we agree on shoulder height for the initial launch height to make things easier?   Let’s call it 5′ since Cespedes is 5′-10″.  We’ll say the bat was launched at a 70-degree angle and in the gif the bat appears to reach it’s apex at just before 0.4 seconds.

BatCast

Exit Velocity Launch Angle Acme Distance
9.2 mph 70 deg 12’-6” 4’-11”

Exhibit D – The “I probably didn’t even need this bat to hit this home run” flip

Bryce Harper

Date Inning Leverage Index ΔWE% Implication
09/10/16 8th 3.63 30.5% Bryce’s helmet probably won’t fall off when he’s running the bases.
Statcast
Exit Velocity Launch Angle Distance
99.7 mph 26.39 377 ft

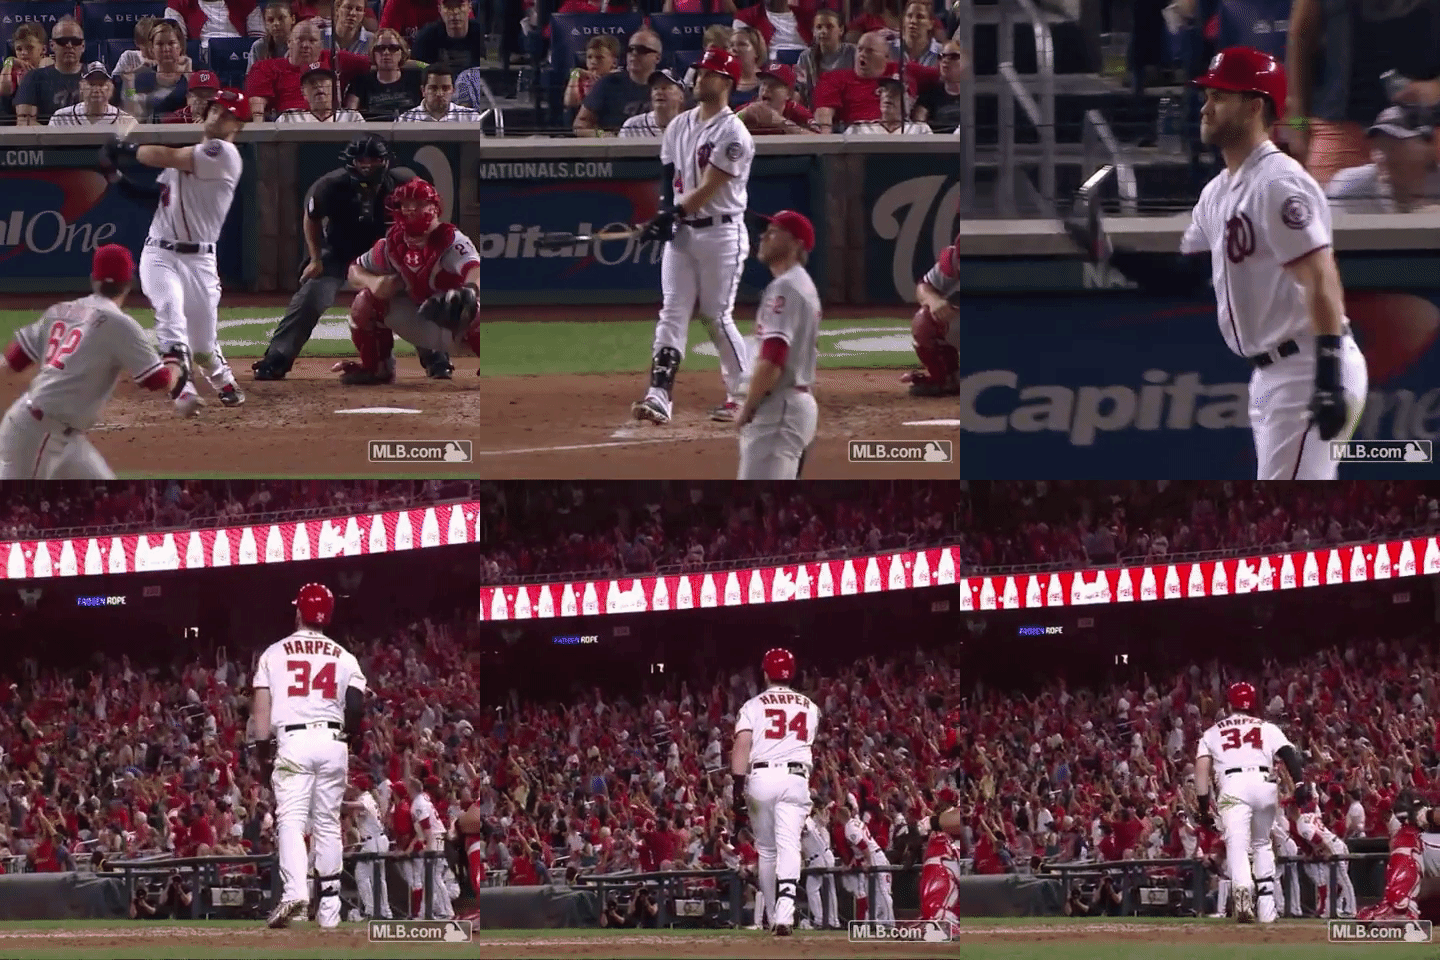
After my long-winded intro it’s fitting to get to feature Bryce Harper in this piece.  He probably didn’t have as much fun this year as he did in 2015, but he appears to have gotten some enjoyment out of this shot.
wp-1480462655679.gif

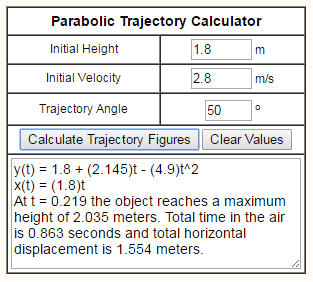
Correct me if I’m wrong, but I believe that is what the kids call “Swagadoscious.”  I’ll just get right to the point this time.

bharpflipp


BatCast

Exit Velocity Launch Angle Acme Distance
6.3 mph 50 deg 6’-8” 5’-1”

Those are the ones that stuck out to me as the best flips of the year and I hope you were able to move past the rough estimates and get some enjoyment out of that as well.  I should note that Joc Pederson’s bat flip in the NLDS is omitted because I cannot find substantial evidence of an acme or distance.  And while a lefty going across his body like he did is pretty exotic, the uncertainty he exudes, combined with his panicked sashay, makes this effort pretty uncool.

pedersonbattoss_echl1ngh_il9khrdi

(Scherzer looks super imposed here)

So what can we pretend to glean from this?  Based on WPA, it’s probably not surprising that Harper had the most disproportionate bat flip.  Looking at the Statcast data, Harper’s home run was also the “weakest” out of the group.  So I guess even if Bryce Harper says what he says just so he can get away with being a little douchey, he’s holding up his part of the deal.  Of course, bat flips aren’t what make baseball fun.  Baseball is fun because we can see so much of our own lives in the game — it’s the humanity.  It provokes endless curiosity and it will reward you if you know where to look.  It’s the only game that can end, not because of time, but with one swing, and flip, of the bat.

Don’t be afraid to clue me in to bat flips in the future — my Twitter handle is in my bio (below).


Joe Morgan’s Secret Socialist Baseball Regime

A popular theme this preseason was parity.  Truth be told, it’s been quite popular since the 2014 preseason projections forecast the smallest disparity between the best and worst teams at least going back to 2005Since then, the term has been so worn out that BuzzFeed included it on their end-of-the-year list of “words that need to be stricken from the Saber community” (source needed).

While the AL was the main driver of parity-related conversation, it might be worth mentioning that the results show that the AL was more lopsided than it was in 2015 while the NL’s gap was more compressed compared to the previous season despite the existence of the Chicago Cubs World Champion Chicago Cubs.  It’s not that that’s incredible — projection systems are conservative and variables such as sequencing and luck are still unpredictable.  Reflections of these points can be seen in Texas’ record in one-run games, or the Phillies and Braves performing better than they expected, or the Twins performing more like the Phillies and Braves were expected to.

It’s possibly reasonable to think that, as front offices skew more towards advanced analytics, the trend of increased parity will continue.  Of course that’s too simple of a statement as revenue sharing and luxury-tax measures have played their part in balancing out the competitive environment as well.  But as front offices progress it’s more likely that the true-talent level at the major-league level will span a smaller range, fewer and fewer at-bats will go to poor players, and the top players should be more evenly distributed throughout the league, speaking in terms of true talent.

This article, however, is not really about anything based in analytics or reality and I don’t know how to segue from my intro into delivering to you what I set out to do any better than asking you to assume some truly ridiculous prerequisites:

  1. MLB and the owners of all the teams only care about the viewer’s experience
  2. Unpredictable variables have become somewhat predictable. This includes some luck, breakouts, injuries, and rapid declines or dips based on smaller injuries.  This does not mean, however, that Runs and RBIs are predictable; it just works out perfectly by FanGraphs WAR
  3. The public is unaware of the predictability of baseball and there is an Illuminati-type presence in baseball headed by a board of trustees that includes, ironically, but obviously, Joe Morgan
  4. Payrolls are dictated by the outcomes that MLB knows will happen and are strictly performance-based – by FanGraphs WAR
  5. Rosters are reconstructed every single year
  6. Reconstructing rosters has no effect on luck or sequencing or ballpark effects (maybe all ballparks have the same dimensions)
  7. The DH is in both leagues but is only reserved for a portion of games throughout the year; teams are required to allocate at least 140 PA to pitchers
  8. Dave Stewart somehow managed to mess up his last season as the Diamondbacks GM (They just happened to be the last team I constructed and there wasn’t enough WAR left to make them as good as the other teams — the Cubs got dinged by this, too.)

What I did was export all the data I felt was relevant from the leaderboards and build 30 rosters based on the average number of Plate Appearances, Games Started, Innings Pitched, and WAR.  The numbers for the league break down like this:

Offense

PA (Non Pitchers): 179,218 (5,974.93/team)

WAR (Non Pitchers): 572 (19.07/team)

PA (Pitchers): 5,366 (178.87/team)

WAR (Pitchers): -2.6 (-0.09/team)

Pitching

GS: 4856 (161.87/team)

IP: 43306.3 (1443.54/team)

WAR: 429.5 (14.32/team)

The only other things I wanted to be consistent with reality were the distribution of plate appearances by position and accounting for the IP by position players.  The first caveat doesn’t work out perfectly, but you’re not going to find a team that received 1,500 PA from their catchers and only 900 from all three outfield positions combined.  The second one, however, I believe I perfected.

After I had built the 30 rosters I realized they were only distinguished by a roster number, so in order to assign each roster a team, I simply took an alphabetical list of the team names and went down one by one with a random number generator and matched that team and random number to the roster with the corresponding number.

Here’s a link!

Who was on your favorite team?  Considering the public doesn’t know about the basically flawless projection systems, how did your team do compared to how you thought they would do? How much would this affect the way you watch the game?  How much would this affect your team loyalty?  Would you enjoy this?  Is this the dumbest exercise you’ve ever seen?  Is Joe Morgan a genius for complaining about the lack of dynasties while he secretly pulled strings to get all teams to be perfectly balanced, competitively, thereby creating a socialist baseball regime?


illuminati

I’ll do this again when the 2017 rosters and projections are set so we can follow up on “equal” roster construction.


Paul Goldschmidt Has a Pop-Up Problem

When we were growing up, my dad would sometimes refer to my sister and me as ingrates. I always had a sneaking suspicion that statement was ruthless. I was young and under the assumption that he provided us everything we needed and wanted because that was what he was designed to do. In a sense, that perception of him probably does reflect the “ungratefulness” that young children tend to posses, innocent as it may be, what with a child’s inherently feeble comprehension of interpersonal relationships. I am now the parent of a two-year-old boy and just the other night he saw a commercial for a Power Wheels Jeep Wrangler that elicited the following outburst:

“I want to go in there!”

“I want one!”

Finally he turned to peer into my eyes and, in order to accentuate the severity of his next mandate, he raised his index finger and spoke;

“Daddy, better buy me one.”

His tone became dramatically more somber than it had been for the first two exclamations, and it made me laugh the hardest. I am certain I was the narrator of many statements similar to this as a kid, but the reality is, when kids are given everything they want, it’s up to the parent to understand that if there is a perceived lack of gratitude, it is a direct byproduct of the parent’s efforts to make them happy or even to keep them alive.

Lately I’ve been thinking of how I can be really ungrateful for even truly fine baseball seasons. Even some All-Star seasons disappoint me, and I know I’m not alone. If Mike Trout was in the middle of putting up a 5-win season, we’d all be talking about what could be wrong with Mike Trout. When players set the bar so ridiculously high we tend to hold them to that standard for better or worse. As an actual example, it’s completely understandable to be disappointed by Bryce Harper’s 2016 season after last year’s masterpiece. The reality is, however, that he’s 23 and has currently produced 3.4 WAR. His baserunning and defense have been positives and he’s compiled over 20 home runs and 20 stolen bases while hitting 14 percent better than league average; that’s damn fine and yet it’s still a damn shame.

Paul Goldschmidt, meanwhile, is hitting .301/.414/.494 and has accrued 4.7 WAR and might surpass 30 SB this year. His 136 wRC+ is still great even if it’s not quite the 158 he’s put up over the last three seasons. So why do I feel the loathsome inklings of disappointment bubbling inside of me? Firstly, and admittedly shallow of me, I like my Goldschmidt with more extra-base hits. For the first time in his professional career, at any level, Goldschmidt’s ISO starts with a number under 2. It’s possible he has a nice final week and brings that number up into the .200 range, but there are still some potentially concerning blips in his batted-ball profile that could portend of further decline in production. What I’m referring to most specifically, as the title suggests, is that Paul Goldschmidt has developed a pop-up problem.

From 2011 through 2015, Goldschmidt’s cumulative IFFB% was 4.8%. This year it sits at 14%. He has 17 IFFB this year, which is the same amount he had in the three previous seasons combined. Pop-ups aren’t good as they’re essentially as productive as a strikeout. Here are the 10 players with the biggest increases in IFFB% in 2016 compared to 2015 among qualified hitters in both years.

top-10-chart

I’m not suggesting there’s a positive correlation between popping up and performance, but it’s easy to make sense of some of the names that appear on this list. If you watched Josh Donaldson break down his swing on the MLB Network, you know that a lot of players are thinking about not hitting the ball on the ground because damage is done in the air. Did you know that DJ LeMahieu, at the time of this writing, has a higher slugging percentage than Goldschmidt? That’s bonkers. The league’s slugging percentage last year was .405, and this year it’s .418, but this group of players, minus Goldschmidt, have added, on average, 21 points to their slugging percentage, and part of that, for this group, has to be chalked up to putting more balls in the air.

popupsimprove

What I’m hoping to highlight is that what is even more troublesome for Goldschmidt is that he is the only player in this top 10 who had an increase in their IFFB% while also seeing his fly-ball rate and hard-hit rate drop.

goldschmidtpopsdown

So I have what could be an insultingly obvious hypothesis: since Goldschmidt has long been a quality opposite-field hitter, I am theorizing that pitchers are exploiting him with more fastballs up and in where he can’t quite get his hands extended. A cursory glance at his heat map vs. fastballs in 2015 and 2016 reveals a minor shift in approach by the league.


 goldschmidt-fb-2015goldschmidt-fb-2016

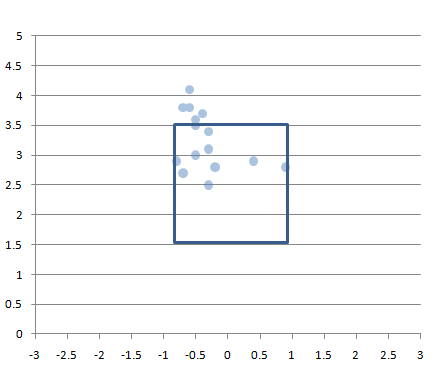
Besides the obvious, which is that pitchers are avoiding the zone even more than they had before, we can see just a bit more red in the specific zone I was referring to. It’s not so glaring or even enough information to make any conclusions, so let’s see if that area is where pitchers are getting Goldy to pop up. On the year, per Brooks Baseball, he has 22 pop-ups, 19 from fastballs and three from offspeed pitches. The 17 that are classified as IFFB by FanGraphs are plotted in the graph below.homemade-heatmap

*the two pitches towards the outside corner (for Goldschmidt) are sliders.

However, it’s not as if pitchers have previously avoided throwing Goldschmidt up and in; it just appears, despite his overall swing rate being at a career-low 39%, he’s upped his swing rate against fastballs by over five percentage points in that specific area just above 3.5 ft. And that area has the largest concentration of his pop-ups.  Looking at the entire area middle/up/and in to Goldschmidt, he has increased his swing rate from 57.2% in 2015 to 60.7% in 2016 while staying away from lower pitches in general. It’s a philosophy that is being echoed throughout baseball right now, and it is not at all a bad plan, but it has caused him, either deliberately or due the effect of swinging at these pitches more often, to go to the opposite field this season less than he ever has. This also is not necessarily a negative shift in regards to a batted-ball profile, but from 2013 – 2015 Goldschmidt was the fifth-most productive hitter in baseball going the other way, and in 2016 he’s 33rd. That represents a drop in wRC+ from 204 to 158, and from a .729 SLG (.329 ISO) to a .647 SLG (.255 ISO). I’ve long since regarded Goldschmidt to be in the same tier of hitters as Trout, Votto, Cabrera, and pre-2016 McCutchen, and it would be a shame for him to move away from a facet of his game that enables him to produce at that elite level.

At the end of this season I don’t think I’ll actually be all that worried about Goldschmidt; I can reconcile a 136 wRC+, even if it would feel a little disappointing. I wrote about Paul Goldschmidt last year and I wasn’t worried then, either. But I do think if I’m going to take a 136 wRC+ for granted I should place that appreciation toward the catalyst for this change in Goldschmidt’s performance, and a lot of that credit has to go to the pitchers who have induced 17 IFFB from a player who only averaged 5.7 over the last three seasons.

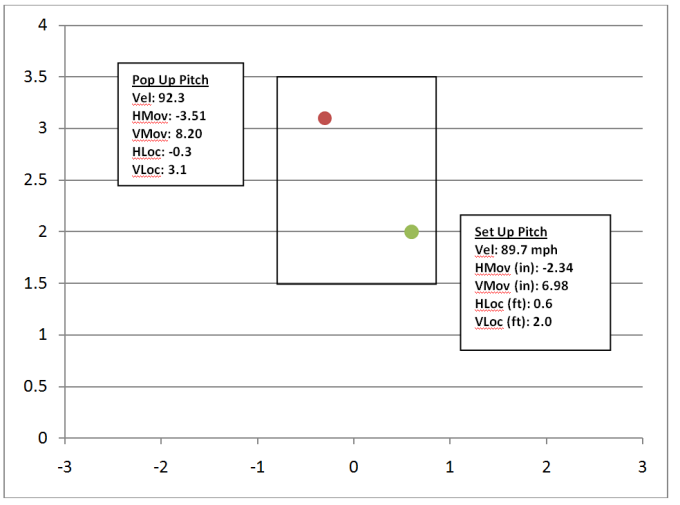
Now I know that setting up a pitch has so much more to do with an entire at-bat, game, or even season than the pitch that was thrown immediately before it, but for this exercise I want to look at the pitch that caused Goldschmidt to pop up and how it relates to the pitch thrown immediately before it. It’s crude and does not tell the whole story, but it still shows a definite approach — and, for all intents and purposes, it’s probably a decent representation of a general tactic used across the league for inducing pop-ups. I found all the data I needed using PITCHf/x at Brooks Baseball and I recorded the velocity, horizontal movement, vertical movement, horizontal location, and vertical location of each pitch Goldschmidt popped out on as well as the same data set for each set-up pitch if there was one (which would be in any situation where Goldschmidt did not pop up on the first pitch of an-bat). Below you’ll find a plot that shows the average location and characteristics of each pitch.

poppy-uppies

And here is that data in a table represented as the average difference between the two plot points.

pitchdiff

Doesn’t it make you feel warm when something fits into the shape you had pegged it to be? That’s just really simple and makes a hell of a lot of sense. Or maybe I feel warm for taking something that was disappointing and turning it into something I can really appreciate.  Now if you’ll excuse me, I have a Power Wheels Jeep Wrangler to buy.


The Case For Jake Arrieta as the Most Dominant Pitcher of All Time

C.R.A.P.  It’s a fairly modern affliction that affects a great deal of people like you and me — and by ‘you and me’ I mean internet users.  It’s clear that the internet, like all of mankind’s greatest achievements, is not without drawbacks.  Never before have we been so connected, and never before have we heard the terms: Athazagoraphobia (Fear of missing out), ‘Paradox of Choice’, and ‘Intellectual Technologies’ (just Google it — because I can’t remember what it means).  The level of connectedness is so intense that on a day-to-day basis, I feel like I meet people whose personalities are plagiarized patchworks of charismatic, yet ill-informed internet voices (myself included).  And then, of course, there’s C.R.A.P., which stands for Combative Responses to Antipodal Posts.  An amusing component of C.R.A.P. is the ferocity with which contrary opinions are met with online; I have experienced 30 years of life and not once have I heard strangers communicate with each other in the manner that they do in the comments section of baseball blog posts on the internet.

To be clear, I’m not completely condemning the common vernacular found in said comments sections, because debate and conversation simply happen differently when we’re responding to a pun that’s a screen name rather than a face with eyes.  On Thursday, the 21st of April, Jeff Sullivan wrote a piece titled, The Case for Noah Syndergaard as Baseball’s Best Pitcher, and the comments section is littered with people who suffer from C.R.A.P.  In my opinion, if you actually read the article, you’d be able to tell that Jeff isn’t declaring Syndergaard the best pitcher, but based on his stuff and recent results, there’s definitely a case for it, hence the title.  Essentially, I think Jeff is saying that it’s possible Syndergaard is taking that step, and he’s open to the idea.  Jeff did a great job (as always, thank you, Jeff) as evidenced by reactions to the article.  He got us thinking and he got us discussing — some of us liked what Jeff had to say and some of us clearly weren’t receptive to the idea.  At all.  To his credit, Jeff did exactly what he’s supposed to do.

Now before we nosedive into the reasoning behind the outlandish title of this article, I want to get a few things out of the way: First and foremost, I’m sorry for throwing gasoline on an already raging fire.  Second, I think Clayton Kershaw is the best pitcher in baseball because of his sustained dominance (1.98 ERA over his last 1066.1 IP).  Certainly that doesn’t mean that pitchers can’t be better than Kershaw for a period of time, however, it’s just that while others rise and fall to his level, Kershaw remains.  And finally, I think Pedro Martinez is the best pitcher of all time.  That’s partly because I was born in 1985, and partly because I read it on the internet.  Mentioning Pedro is a good time to tie back into Jeff’s article.  To quote:

…Right now, in 2016, Syndergaard has a 23 ERA- and a 22 FIP-, through three starts…

Believe it or not, Kershaw has 37 three-start stretches with an ERA- no higher than 23. He has just seven three-start stretches with an FIP- no higher than 22. What Syndergaard is doing, Kershaw has done several times. But it’s not like this is Kershaw’s resting level. And Syndergaard is just as much about the scouting as he is about the stats.

That 23 ERA- just happens to be the number I was looking for.  During his peak (97 – 03), Pedro was preposterously good, posting a K-BB% of 26.1%, a 47 ERA-, and a 52 FIP-.  The acme of his peak came in a 22-game stretch spanning the 1999-2000 seasons when he posted an ERA- of 23 and an FIP- of 33.  His K-BB% was an unruly 34%, and he allowed just 95 hits in 168.1 IP.  Marvel at the overall line: 

August 3, 1999 – June 14, 2000

GS IP TBF H R ER HR BB K ERA WHIP FIP GSv2 K-BB% ERA- FIP-
22 168.1 635 95 25 21 7 31 247 1.12 0.75 1.51 84 34.0% 23 33

Again, that 23 ERA- is what I’m focusing on because it’s the number we saw in Mr. Sullivan’s article.  I could not find a better or equal stretch of dominance, based on ERA-, over 22 games, than Pedro’s going back to 1969…until Jake Arrieta.  Looking at only regular-season games, dating back to July 2nd of 2015, Arrieta has produced that magic 23 ERA- number we’re looking for:

July 2, 2015 – April 21, 2016

GS IP TBF H R ER HR BB K ERA WHIP FIP GSv2 K-BB% ERA- FIP-
22 162 590 84 19 16 4 31 159 0.89 0.71 2.12 75 21.7% 23 55

For those of you who prefer FIP I say leave your C.R.A.P. in the comments section, because as we gain more data, we learn that pitchers have some modicum of control over the quality of contact they allow, and at this point it’s probably safe to say that Jake Arrieta is a proven FIP-beater, even if he’s earned this title in less time than it takes others.  But Arrieta’s streak is now actually at 24 starts in the regular season, and two of those have been no-hitters.  His line:

June 21, 2015 – April 21, 2016

GS IP TBF H R ER HR BB K ERA WHIP FIP GSv2 K-BB% ERA- FIP-
24 178 647 91 20 17 4 33 173 0.86 0.70 2.09 76 21.6% 22 54

Pop the confetti!  Blow your vuvuzelas! Or Tweet!  That 22 ERA- is something we’ve never seen over such a large quantity of starts (at least going back to 1969 — and at least with my hack-job research)!

What this means in the scope of baseball’s long history isn’t nothing.  It’s a marvelous line.  Of course, it is just one number I’m looking at, and ERA-, like the internet, is not without flaws.  It’s arguable and perhaps even likely that Pedro’s line, with that 34.0% K-BB%, is more impressive (that mark was 293% better than league average — lolz).  But Arrieta has two no-hitters.  However, if we look at quality of opponents, well, Pedro’s line becomes more impressive because the teams he squared off against combined for an average wRC+ of 102, whereas Arrieta’s opponents averaged 94 wRC+.

Dave Cameron wrote an article about Arrieta’s ability to control the quality of contact he allows, and as we learn more about this skill, perhaps we’ll revere it a little more — never as much as strikeouts, but definitely more than we do now.  One of Jeff’s points about Syndergaard is that he undoubtedly has the arsenal and command to become the game’s top arm.  Arrieta has legit weaponry as well, but I don’t think anything we’ve ever seen from a starter matches what Syndergaard is throwing.  We know Arrieta’s story up to this point, which makes his sudden-ish ascent to a level where he can put a streak together like the one he’s on more interesting, if not more impressive.  What he does from now until the end of his career will go a long way in determining the weight this current streak holds.  If he flames out, or loses his ability to induce weak contact, it will be seen as a lucky blip; but if he rallies off another few years of 5 – 8 WARs and 50 ERA-es, then we’ll feel better about objectively putting his streak into an historical perspective.  As of right now, even despite his current run, I’m nowhere near putting Arrieta’s name in with the all-time greats (yes, the title was click-bait, spare me the C.R.A.P.), but, like Jeff in regards to how he feels about Syndergaard, but to a lesser extent, I’m open to it.  And that’s about as far as it goes for me — but I’m so contented to sit here and watch the debate unfold, violently, online.


2016 Composite Projections: Everything in One Place

Behold! A grotesquely indulgent spreadsheet.

In order to circumvent my rambling and better understand anything in the table you may find mystifying, skip down the page until you see the link for the spreadsheet again…

In Kyle Kinane’s 2010 stand-up set, which is immortalized in listenable format under the title, “Death of the Party”, he delivers his despondent outlook on life like a brilliant, seemingly drunk poet.  There is a specific passage in which he speaks to his self-worth as it relates to his time spent as a gourmet cake decorations salesman; he refers to himself as:

“a stripped-bare toothless cog spinning freely and ineffectually in the working machine of society.”

Magnifique! As bleak as that is, I’m sure most of us have felt that way at one point or another – and not just about our jobs.  As I grow older, I’ll be 31 this year; I find it harder to separate anything I do from a bigger scale, which of course leads to bouts of nihilism and depression; which leads to imaginary scenarios of myself never allowing my son to believe in Santa Claus – which is just anxiety over the idea of being a bad parent coupled with a dash of hopelessness about my existence.  Looking back on my life sometimes yields the same results.  I’ve spent an insane amount of my life’s time playing, watching, predicting, thinking about, and listening to baseball.  We could say that it’s a strange existence, but then I guess you could say that about anything.

But man!  Making this spreadsheet every year (mainly) at work really makes me feel like a ne’er-do-well.  I’ve become so hyper focused I tune out co-workers and sometimes I feel like it’s brought on Asperger’s-like symptoms.  For these reasons, this is probably the last time I’ll be doing this, albeit the first time I’m sharing this with other people.

My own projections started out (years ago) incredibly optimistic, as fans’ projections are wont to be and while I’ve refined them, and I really do love to do them.  However, I realized that in a world with Steamer, ZiPS, and PECOTA, among others, the best results are yielded from a composite projection system (I’ve won my main league five of the last seven years using this system with no finishes outside the top three).

The systems used to create this Composite Projections System include:

Steamer, ZiPS, PECOTA, Marcell, Rotochamp, ESPN, my own projections, previous year performance (2015), a three-year average stat line, and for players with limited or no MLB experience, high-level minors numbers are regressed and thrown in as well.

I understand using 2015 and past three-year average is a little redundant as it’s baked into almost all the projection systems, but I do it because those numbers aren’t regressed in any way.

Let it be noted that a lot of the work on this spreadsheet isn’t mine. It’s an amalgamation of many different sites, authors, and ideas. I’ll try to parse it out for you the best I can and hopefully you can find it usable.

2016 Composite Projections

The first two rows are the headers – the first row is for hitters and the second row is for pitchers.

Hitters:

For the hitters, you should recognize all the stats until FAVG (Column AC).  It’s a crude quotient and it stands for Fantasy Average.  It really only provides value over larger sample sizes if it even provides any value at all.  I like to use it to compare players that may end up with similar lines at the end of the season (Cespedes, A. Jones, C. Gonzalez) or players who have played in parts of the last couple seasons (Justin Turner).

The equation for hitters is simply:

(Hits + Runs + Home Runs + RBI + Stolen Bases) / At-Bats

Since all offensive stats are weighted equally, there’s a ton wrong with this, but generally speaking their can be a few tiers:

Tier 1: .700+ FAVG: elite offensive production, likely from a number-three hitter.  (Only Trout, Goldschmidt, Stanton, McCutchen, M. Cabrera, Bautista, and Encarnacion occupy this tier as an average score over the last three years.)

Tier 2: .650 – .699: Usually players that make up rounds 2 – 3. 20/20 players or players with monster power.

Tier 3: .600 – .649: Players that excel in maybe 2 – 3 categories.  It’s likely to be HR/RBI guys that either score a lot of runs or hit for a decent average as well.  Less likely to be the super speedy guys, but if they score runs and add somewhere close to 10 – 15 HR, they’ll be here – think Altuve, Cain, Blackmon types.

Tier 4: .550 – .599: Here are the speedy players like Dee Gordon (though he may have moved up to the next tier by now.  Solid players inhabit this realm, too.

Tier 5: .500 – .549: Catchers probably.  Or single skill players, and bottom of the lineup dudes.

Tier 6: .499 and below: steer clear.

Column AD is titled ZIMM and it’s yanked directly from Jeff Zimmerman’s Draft Prep article from 2015.  It’s actually a series of three posts and I did not run any positional adjustments for my table.  The only other difference is that I used 5.9 as my adjusted slope for SB so that stolen bases aren’t so heavily valued – although that may be a mistake on my part due to the depressed stolen base environment in MLB.

Moving over one column to the right, R.R. stands for Roster Resource, and the numerical value signifies the projected lineup spot for each player.  If they are on the DL, I have provided with where I think a player will be slotted once he returns from injury.  If they are a back-up or are going to start in the minors it will say BE for Bench, or AAA (despite what level they might start at).

2Pos is just a column to denote second-position eligibility, which is why it is empty for most hitters.

The next five columns are lifted directly from Fantasy Pros‘ Average ADP page.  This is the recommended way to sort these rankings as the default (column A) is set to my current rankings.

Now we see FAVG and ZIMM again, followed by more stats.  These are all representative of a player’s average production over the past three years.

The headers for the colorful sections should be self-explanatory.  The cells coated green are skills that are exactly at, or above league average.  The more green cells the better, obviously.  The reports were exported from FanGraphs except for the exit velocity data (columns CD – CJ), which I pulled from Baseball Savant.

Pitchers:

The first thing we’ll run into that looks strange is A. Score.  This column rips data from Eno Sarris’  Arsenal Scores series.  If a pitcher’s arsenal score was not available in his table for 2015, I went back and took them from the 2014 installment.

FAVG for Pitchers:

(Innings Pitched – Hits – Earned Runs – Walks + Strikeouts + Wins + Saves) / Innings Pitched

As with hitters, this works better with more information.  There’s also the caveat that starters and relievers cannot be compared.

Tier Kershaw: Clayton Kershaw – he’s the only starter with an average FAVG of over 1.00 over the last three years.

Starter Tiers

Tier 1: .800 – .999 – it’s mainly Scherzer and Sale, although players will jump in and out of this tier (as with others).

Tier 2: .700 – .899 – While the term is vague, these guys are still fantasy aces.

Tier 3: .600 – .699 – fringe ace guys, or perceived aces.

Tier 4: .550 – .599 – pitchers with above average K rates, but not elite numbers.

Tier 5: .300 – .549 – either more contact oriented starters, or good K guys who have a bit of a free-pass issue.  It’s a bigger net because wins are so unpredictable.  We’re still top 70 type guys though.

Tier 6: There are still a ton of serviceable pitchers here and even below…like I said this is a crude stat.

Relief pitchers are much different and even non-closers tend to post rates above 1 – it’s a poor bell weather for relievers due to the high variance in role.

Moving on – the ZIMM score here directly reflects Jeff Zimmerman’s equation.

The Roster Resource feature shows what rotation spot pitchers will occupy and is pretty meaningless.

Off RS/G stands for Offense Runs Scored per game and I took these values from the projected standings page at FanGraphs.  Wins are still, for the most part, unpredictable, but a good supporting offense definitely doesn’t hurt.

The next thing included that could be ambiguous is at the tail end of the three-year-average section (Columns AZ – BB).  These indicate quality starts, quality start percentage, and game scores.  Game scores aren’t really thought about too much, but if you sort the spreadsheet for pitchers by AVG game score, it’s a pretty good indicator of where they should be drafted.

Then of course it’s the comparison against league average section – again, the more green cells the better.

I really hope you find something helpful in this sheet.  I know it’s pretty packed, but if you take a couple minutes to figure it out, you’ll find that almost everything you need is in there (no auction calculator or dollar values), so it’s pretty convenient.

Plus if you find value in it, maybe I’ll let my son believe in Santa Claus.


BatCast: Bat Flip Tracker

I love bat flips. I would have no problem if bat flips became a more theatrical experience. By the power of inference, or by simply reading the first sentence, I’m certain you can accurately predict how I feel about Jose Bautista’s bat flip.  While anyone with an incorruptible soul has been nobly spewing self-righteous significations about how disrespectful Bautista’s bat flip was, I’ve been primarily concerned with one thing: the trajectory of that bat flip. It was a huge exclamation point on a huge moment and it was a pretty significant departure from more “conventional” bat flips.

Most bat flips do not exceed shoulder height. Think about the bat flips that you have mimicked the most in your life.  For me it’s been Griffey Jr,  SosaMcGwire, Ortiz, and McGriff. One could argue that what those players possessed were, by definition, closer to bat drops rather than flips, but you’ll still find these players featured in various “best of bat flips” videos on YouTube. Bautista’s bat flip diverges from the norm immediately upon release, in that it actually started at his shoulders. While this is awesome, it didn’t break new ground. Yasiel Puig flips his bat from above his head on fly outs and triples. Yoenis Cespedes had a triumphant bat flip of his own on Monday night, but for a superabundance of reasons that you already know, Bautista’s bat flip has hogged the limelight. In lieu of this, we’ll focus on breaking down Bautista’s bat flip into some tangible numbers and simply apply that same method to Cespedes’ for a comparison.

MLB debuted Statcast this year, and among its nifty features was the home run tracker. The home run tracker allowed viewers at home to process new data on home runs — specifically, exit velocity, the angle of the home run, and distance. The data I’m about to bring to you is based on this exact premise, but it studies the bat flip.  BatCast: The Bat Flip Tracker™.

Disclaimers:

  1. There is no ™ on BatCast, I just thought it was funny and hope that it’s not illegal to falsely claim a copyright.
  2. I am not an engineer, mathematician, or a numerically-inclined vampire. The last math class I took was trigonometry during my junior year of high school 13 years ago.
  3. I’m about to present some very inexact numbers based on frozen images I’ve gathered from the internet to bring you the BatCast data on Jose Bautista’s bat flip.

Without further ado:

bautJOSE BAUTISTA

7th Inning – ALDS Game 5

Rangers @ Blue Jays

Score: 3 – 3

BATCAST

Initial Launch Velocity 14.63 mph (23.54 km/h)
Total Horizontal Distance 6′-6″ (1.98m)
Launch Angle 78.6 Degrees

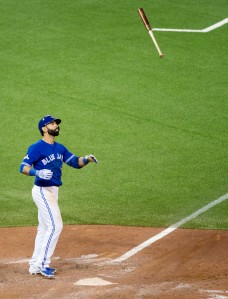
Here is the freeze frame of the moment in time that somehow is already emblazoned across purchasable T-shirts. Following the majestic shot will be the explanation of the method I used to come up with the rough, ROUGH BatCast numbers (also featured in metric to honor the Blue Jays and the soil, or turf, of Canada where it all went down).

(Darren Calabrese/The Canadian Press via AP) MANDATORY CREDIT

You didn’t think I’d forget the GIF(s), did you? (GIF sources: FS1 + mlb.com) 1475063766308945444               101415_tor_bats_batflip_lowres_gjvlzoc9


The numbers:

Launch Height: 5′-2″ (1.57m)

Jose Bautista stands exactly 6′-0″ tall (1.83m). In the image I printed out and measured hastily, he is about 3.33″ tall. If you’re disappointed in my measurements already, I did warn you that it would be rough, and you have every right to stop reading. If we measure up to his shoulder/trap area, where he released the bat, we get 2.87″. After we apply some simple algebra: 3.33/2.87  =  72/x we come up with 62″ or 5′-2″ (1.57m) for the launch height. This also works with the idea that the head and neck comprise 10.75% of our total height.

Horizontal Distance: 6′-6″ (1.98m)

Bautista hurls the bat across his body with his left hand from his right shoulder, which at point of launch, was pretty much on the inside corner of home plate for a right-handed hitter. The bat lands just outside the left-handed batter’s box which we know is 4’ wide. Given that the plate is 17” wide and there is a 6” cushion between the batter’s box and the plate, we can estimate the horizontal distance that the bat traveled to be right around 6.5’ (1.98m).

Hang Time: 1.52 seconds

I derived this number from watching the video and using my phone as a stop watch.  After 10 runs, I had an average time of 1.52 seconds. There is no metric conversion for time (winky face).

Parabolic Trajectory Calculator

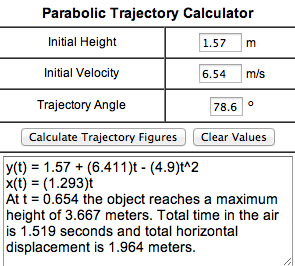
This online calculator was paramount to finding the rest of the data provided. Once I had the initial height, the hang time, and the horizontal distance, I tinkered with numbers for the initial velocity and trajectory angle until everything jived with the rough numbers I had figured.
trajectory

Launch Angle: 76.8 Degrees

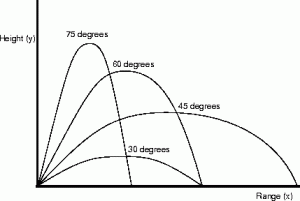
Jose launches this bat pretty tight to his body, as evidenced by where the bat lands (at the outside edge of the left-handed batter’s box).  A rough/convenient measurement of the launch angle gives us 76 degrees. But after manipulating the numbers in the calculator, we have a more accurate launch angle of 76.8 Degrees.


launch angle

Launch velocity: 14.63 mph (23.54 kmh) and Apex: 12′-0.36″ (3.67m)

I had actually tried to measure the apex using the same method I performed to figure the launch height, but it would be a disservice to us all had I used the 10.5′ number that produced. Jose Bautista flips the bat in such a manner that he would have thrown it over himself STANDING on top of himself – or twice his height. In the trade of bat flipping, this is probably considered light-tower power.


Cespedes vs Bautista

Using the same method let’s look at, what we can figure to be at least a pretty similar and recent comp.

First, Cespedes’ flip.

THIS_Cespedes_launches_NLDS_home_run_into_the_night

Yoenis Cespedes’ bat flip came in the 4th inning of game 3 of the NLDS with the score already 7 – 3 in favor of the Mets.  The tension in this game was obviously very high as the series was tied at 1 – 1, but circumstantial tension also built differently as there had been a day between this game and the game that saw the Utley v. Tejada incident.

yoenisYOENIS CESPEDES

4th Inning – ALDS Game 3

Dodgers @ Mets

Score: 7 – 3

BATCAST

Initial Launch Velocity 12.08 mph (19.44 km/h)
Total Horizontal Distance 10’-8.1″ (3.254m)
Launch Angle 60 Degrees


yoenis

By the numbers, these are two fairly similar bat flips. What Cespedes’ flip lacked in height (8.5 ft; 2.6 m), it made up for in sheer distance (reference table above). But judged by context (inning, game, score), isn’t Cespedes’ bat flip actually more wrong? Of course I’m saying that with my tongue in my cheek – a bat flip is neither wrong nor right. A bat flip is really just like adding an exclamation point to a moment instead of a period. How would you write it?

Home Run.

or

Home Run!

Part II: (preachy commentary)

In the end, people only start talking about a bat flip in context of right or wrong if it’s offensive to a player on the opposing team. Well, it was. It was offensive to Sam Dyson, who, without coincidence, was the pitcher who had just given up the home run to Bautista that spurred the bat flip. Dyson’s reaction seemed to be more of an unhinging; a singular representation of the collective mind of the Rangers. As history now goes, the Rangers were the beneficiaries of strange fortune in the top half of the 7th, nudging them ever closer to the Championship Series. The following half inning saw the Rangers’ 167-game journey and bid for a championship suddenly unravel in a strange, beautiful, sad, and unpredictable sequencing of events. Dyson’s cortisol levels were no doubt already higher than usual, having inherited three baserunners and tasked with getting two outs against the middle of baseball’s most potent offense that features the near certain American League MVP winner and MLB’s leading home-run hitter over the better part of the last decade — oh and these would also be the first two players he would be facing. These facts about the the situation and the prowess of the hitters are somewhat minimized in a pitcher’s mind that is focusing on executing his game plan, but I felt compelled to catch a glimpse into Dyson’s psyche before it all went down.

And then it went down (refer to GIFs of Bautista above).

Dyson will have to internalize the experience, if he’s not/hasn’t already, and I don’t know what that will be like for him. But immediately following the Bautista home run was not the time for that since Dyson still needed to get one more out in the inning. In the moment, amid all the pandemonium, he needed something he thought he had some semblance of control over and he found it, eventually, supposedly, in the bat flip. In fact, the bat flip was something that would, in some strange way, vilify the hero and deflect the attention away from the fact that he just gave up the home run that would eventually be the nail in the coffin (purely from a runs standpoint) for his team’s season (of course it’s more complicated than that). I’m not saying Sam Dyson consciously thought of all this; we’re animals and we’re not always aware of, or able to keep up with the torrid pace of our physiological states – and BELIEVE that Dyson was going through some stuff. However, to believe that Dyson acted above the bat flip, or any of it, is to ignore the fact that he too reacted instinctively to the situation. He made things worse by misinterpreting gestures and pointing fingers at inconsequential things like bat flips.

Dyson’s reaction, while not as grandiose as Bautista’s, was a reaction that was just as impulsive as Bautista’s bat flip, and yet, somehow, it seems like a lot of people deem his reaction to be more acceptable. Is it because he did his best to feign composure through it all? Do you really think he wouldn’t have approached Edwin Encarnacion in the midst of all the mayhem if the bat flip didn’t happen? I don’t. There is a Great Repression in this country, and I hate the way I phrased that, because it sounds so cheesy and adolescent, and really, what do I know? But it does feel like there is a sweeping under the rug of emotions, of feelings, and of truth. This is just how we’ve structured things; to be poised in all circumstance so that no one can see how truly horrible or beautiful we really are. Newscasters delivering horror stories; politicians admitting to affairs; talking about something you did that you’re extremely proud of but don’t want to seem too proud of — there are guidelines right down to accepted cadences, gestures, tones, and expressions for delivering each of these like they each came from an acceptable social norms textbook. Big, real emotions tend to make other people feel uncomfortable because conduct says we repress them and stay status quo. If I seem to be disgusted by it all, I’m not…as much as I used to be. But that’s probably because of anger management, finding love, and the birth of my son — three things I can talk in restricted excitement about because I’m starting to well-adjust…obviously, I’m not there yet if I’m ranting about all of this because I’m caught up in the debate of whether or not a bat flip is acceptable.

Sam Dyson said, in a post-game interview, “he (Bautista) is a huge role model for the younger generation coming up playing this game and he’s doing stuff kids do in wiffle ball games and backyard baseball, it shouldn’t be done”. First of all, Sam Dyson has been teammates with Jose Bautista, Giancarlo Stanton, and bat-flipper extraordinaire, Jose Fernandez. Do you think he was appalled at their flips when he was their teammate? Also, Sam Dyson literally just said, it’s a game, and that’s the point anyone who has ever played the game has been hammered with — “never stop having fun! Remember why you play! It’s just a game!”

I understand the game Dyson and Bautista play is also their job. I understand that to play the game professionally means having to work harder than you ever thought you could work, and that that probably has a tendency to mute and mature the game a bit — and like with anything, sometimes it’s a struggle to remember why you do it. But for Jose Bautista, everything culminated in that one swing. In that one moment after he connected with the pitch from Dyson, every swing he ever took, every time he tried out for a team, every early morning and every late night spent training made perfect sense to him. He was experiencing the moment most people, including himself up to that point, only conjure up in back yard wiffle ball games. So please, in a world where we’re forced to repress so much, don’t take the humanity out of the game, and don’t try to take away anything from Jose Bautista’s moment. Given everything in his life that led Bautista to that immensely emotional game 5, given the gravity of the situation, the no doubt distance of the home run, the do-or-die premise of the game, I’d say that bat flip was absolutely, spot-on, 100% perfect.


The Improvement of the Indians Starting Rotation

Remember at the end of last season and before this season when we all foresaw an Indians rotation that could possibly feature somewhere between 2 and 5 really good, and possibly great, starting pitchers?  Don’t get bogged down on the slight exaggeration of that 1st sentence – To recap what we were looking at coming into this season for the Indians’ rotation:  Corey Kluber won the 2014 AL Cy-Young; Carlos Carrasco had a string of starts to end 2014 in which he seemingly (finally) figured out how to harness all of his powers in a bid to ascend his name to an echelon where only Clayton Kershaw’s name resides; Danny Salazar has always had elite swing and miss stuff and was also excellent in the second half of 2014;  Trevor Bauer and his Costco-sized arsenal of pitches have made some of us incredulously, if not warily optimistic since he was taken 3rd overall in 2011; and even T.J. House made us pause and take notice with his strong second half of 2014.

Then, like hype men with a special blend of Cleveland Kool-Aid being intravenously administered, Eno Sarris and Daniel Schwartz posted one of my favorite FanGraphs articles ever, Pitch Arsenal Score Part Deux, and the anticipation over the Indians’ rotation pulsated like a vein in the neck of John Rambo in the midst of fleeing from man-hunters.

The supporting cast, the lineup, looked poised to support the staff with plenty of runs.  Returning would be: break out star Michael Brantley; bounce-back candidate Jason Kipnis; now-full-time-first-basemen, Carlos Santana; a supposedly healthy Michael Bourn; an offense-first but totally-respectable-defensively, Yan Gomes; and an actually-not-that-horrible-in-2014, Lonnie Chisenhall.  Slugger Brandon Moss, and contact-happy-supposedly-glove-first Jose Ramirez had secured full-time spots as well in RF and SS respectively.  So even though it wasn’t without flaws, it seemed like they would allow the pitchers to rack up plenty of fantasy-relevant wins.

Note: This post isn’t about the disappointment of the Indians, though they have been disappointing; it’s more about what factors beyond luck have contributed to the numbers of the Indians’ starting rotation at various points throughout the year, and the disparity (big or small) between the pitchers’ rates and predictors at those points.

The Indians’ starting pitchers, or at least the top 4 (Kluber, Carrasco, Salazar, and Bauer) have, for the most part, been putting up good, albeit, inconsistent numbers all year despite posting some elite peripheral rates and ERA indicators.  A number of reasons have caused these numbers to grow apart (bad), come together, and then grow apart again (good).  Luck can work like a bit of a pendulum, swinging from one extreme, through the middle, and to the other extreme before evening out and that is at the core of what the Indians’ starting pitchers have experienced this year — although they have yet to experience the final stabilization phase.

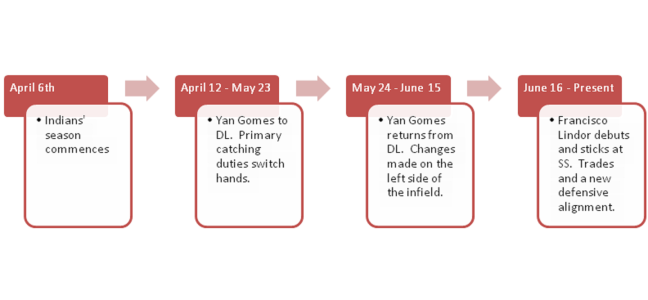
We will examine plenty of numbers (Beginning of season to August 18th) based on this time frame: (Spoiler alert – this article is long and dense, and this timeline serves as a sort of cliff notes as to how the staff’s numbers have improved throughout the year – so if you’re the type of person who feels like looking at a bunch of data is superfluous when the bullet points are in front of your eyes, just read the timeline and be done with it.)

timeline

April 6th – May 23rd/May 24th – June 15th

One week into the season, before it was evident that the team’s defense was very sub-par, Yan Gomes hurt his knee and hit the disabled list for over a month.  Roberto Perez filled in quite nicely, and looking at just a couple numbers, could be considered the more valuable catcher (1.4 WAR compared to 0.5 WAR for Gomes).  Brett Hayes (0.0 WAR) was called up and was the secondary catcher during this period.  Behold, a table from StatCorner:

statcorner


Perez has had the least amount of pitches in the zone called balls and the most amounts of pitches out of the zone called strikes.  Overall, despite receiving fewer pitches than Gomes, he has saved more runs (4 DRS to Gomes’ 1) and their caught stealing rates are basically identical with a slight edge going to Perez – 38% to Gomes’ 35%.  Gomes was much better in terms of framing in 2014, and it’s possible the knee injury has limited his skills all around this season.  Anyways, from April 6th – May 23rd, the combined stats of Kluber, Salazar, Carrasco, and Bauer look like this:

ERA FIP xFIP SIERA K-BB% GB%
Kluber 3.49 2.16 2.46 2.51 25.3 48.6
Salazar 3.50 3.27 2.46 2.30 28.7 43.8
Carrasco 4.74 2.60 2.67 2.82 22.3 48.9
Bauer 3.13 3.23 4.09 3.94 14.2 35.7
3.75 22.7 44.7

Gomes returned as the primary catcher on 05/24, and from that point through June 15th, the cumulative numbers aren’t too different, although there is a dip in both K-BB% and GB% that we’ll have to look into.

ERA FIP xFIP SIERA K-BB% GB%
Kluber 3.67 3.26 3.20 3.19 19.8 43.8
Salazar 3.60 3.72 3.36 3.43 17.3 47.7
Carrasco 3.65 2.83 3.29 3.17 20.2 44.1
Bauer 3.96 4.72 4.47 4.30 11.5 36.8
3.74 17.2 43.1

So despite lower K-BB and ground ball percentages (leading to higher ERA predictors), the group’s ERA in the segment of the season when Gomes was reinstated is essentially exactly the same as from the first block of time with Perez.  Now, I am not a big believer in CERA because there is a high level of variation and too many unknown variables pertaining to how much of the responsibility/credit goes to the catcher, the coaching staff, or the pitcher; but I do think that it’s possible Gomes’ extra service time has enabled him to be more in tune with his staff as well as understand hitter tendencies better than Perez and Hayes.  I realize we’re getting into a gray area of intangibles, so I’ll reel it in with some results based on pitch usage%.

% Difference in Pitch Usage with Yan Gomes compared to Roberto Perez

Pitcher FB% CT% SL% CB% CH% SF%
Corey Kluber -9.0 8.8 -17.3 5.0
Danny Salazar 9.8 -12.6 -4.4 17.1
Carlos Carrasco -6.5 9.4 49.2 13.3
Trevor Bauer -2.9 -15.0 -8.9 78.5 25.8

Using BrooksBaseball Pitch f/x data, let’s painstakingly find out how different each pitcher’s pitch usage was in regards to different counts, or better known as Pitch Sequencing.  We’ll look at first pitches, batter ahead counts, even counts, pitcher ahead counts, and 2 strike count situations.  As good as pitch f/x is, the data still isn’t perfect.  There may be discrepancies if you look at usage at Brooks compared to the usage at FanGraphs, so for each pitcher we’ll split the pitches up into three categories: Fastballs (four-seam, sinkers, cutters), Breaking Balls (sliders, curve balls), and Change Ups (straight change/split finger) – I’m aware that splitters are “split fingered fastballs”, but I liken them to change ups more because of the decreased spin rate and generally lower velocity.

*Having a table for each pitcher in regards to pitch sequencing made this article quite messy, so I’ve included a downloadable Excel file, and briefly touched on each pitcher below.

Pitch Sequencing Excel Doc.

Corey Kluber

Looking at the data, Gomes stays hard with Kluber more than Perez until they get ahead in the count.  Perez swaps some early count fastballs for curve balls, but they both see his curve ball as a put-away pitch.  Gomes tends to trust Kluber’s change-up more than Perez later in counts and Perez likes it more earlier in counts.

Danny Salazar

Much like with KIuber, when Gomes catches Salazar, they have a tendency to stay hard early.  Gomes pulls out Salazar’s wipe out change up after they’re ahead whereas Perez will utilize it in hitter’s counts as well.

Carlos Carrasco

Carrasco has 5 good pitches and he’s pretty adept at throwing them for strikes in various counts which is why there is some pretty even usage across the board, at least in comparison to Kluber and Salazar.  There is quite a bit more usage of Carrasco’s secondary pitches in all counts and there are pretty similar patterns when Gomes and Perez are behind the plate.  With Hayes, it doesn’t look like there is much that changes in sequencing until there are two strikes on a hitter.

Trevor Bauer

Bauer is probably a difficult pitcher to catch because of the number of pitches he has and the constant tinkering in his game.  Side note: Gomes is the only catcher to have caught a game in which Bauer threw cutters, and in their last game together, Bauer threw absolutely no change-ups or splits.  Bauer’s highest level of success has come with Hayes behind the plate and perhaps that’s from their willingness to expand his repertoire in more counts than Gomes and Perez do, but there is no way I can be certain of that.

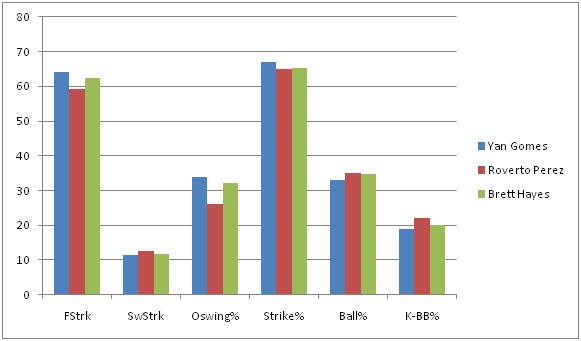
Pitch sequencing can effect the perceived quality of each pitch and therefore, can produce more favorable counts as well as induce higher O-Swing and SwStrk percentages (or less favorable and lower).  So despite the framing metrics favoring Perez, the group throws more strikes with Gomes and also induces more swings at pitches outside the zone – although, as previously noted, there is some regression with Gomes behind the dish in terms of SwStrk% and K-BB%.

swing tendencies


aaa0ide


**These graphs represent numbers through the entire season to garner a bigger sample size.

With lower line drive rates and more medium + soft contact, and (in the case of the Indian’s defense), more fly balls, a conclusion could be jumped to that the staff’s BABIP has trended downward since Gomes regained his role.  A look at BABIP throughout the course of the season:

babip


Woah!  It was well above league average in April and then plateaued at just above league average through mid June, but has been plummeting ever since.  Obviously a catcher is not responsible for this dramatic of a swing in BABIP, so the Indians’ defense must have improved.

June 16th – August 18th

The rotations’ traditional stats look even better if you use June 16th as the starting point:

Pitcher IP H K BB W ERA WHIP
Corey Kluber 84 61 82 16 5 3.11 0.92
Danny Salazar 71 46 69 23 5 2.79 0.97
Carlos Carrasco 77.1 56 77 13 3 2.91 0.89
Trevor Bauer 68.1 69 63 24 4 5.80 1.37
300.2 232 291 76 17 3.59 1.03


So let’s take a look at the Indians’ defensive alignment by month (Player listed is the player who received the most innings played at the position).


POS April May June 1 – 8 June 9 – 15 June 16 – 30 July August
C Perez Perez Gomes Gomes Gomes Gomes Gomes
1B Santana Santana Santana Santana Santana Santana Santana
2B Kipnis Kipnis Kipnis Kipnis Kipnis Kipnis Ramirez
3B Chisenhall Chisenhall Chisenhall Urshela Urshela Urshela Urshela
SS Ramirez Ramirez Aviles Aviles Lindor Lindor Lindor
LF Brantley Brantley Brantley Brantley Brantley Brantley Brantley
CF Bourn Bourn Bourn Bourn Bourn Bourn Almonte
RF Moss Moss Moss Moss Moss Moss Chisenhall

If you’ve paid attention to the Indians at all, you know they’ve made some trades and called up a couple prospects.  But just how different is the new defense?  Well, we only have a small sample with the current configuration, but it appears to be A LOT better. If BABIP wasn’t enough of an indicator, and it’s not, because there has to be some regression to the mean – it can’t stay that low – here are some numbers from the players who were playing the most in May compared to the players who are playing the most in August (again, numbers represent full-season stats):


MAY PLAYER FLD% rSB CS% DRS RngR Arm UZR UZR/150
C Perez .994 2.0 38.5 4
1B Santana .997 -6 0.0 0.7 1.2
2B Kipnis .988 4 4.5 3.6 7.0
3B Chisenhall .963 7 3.1 3.3 10.5
SS Ramirez .948 -2 -2.4 -5.2 -21.9
LF Brantley .992 1 0.3 -2.1 -1.4 -3.3
CF Bourn 1.000 4 -7.2 1.1 -5.8 -11.4
RF Moss .975 -4 1.7 -2.5 -1.1 -1.8
AUG PLAYER FLD% rSB CS% DRS RngR Arm UZR UZR/150
C Gomes .996 0.0 35.0 1
1B Santana .997 -6 0.0 0.7 1.2
2B Ramirez 1.000 1 1.1 2.8 23.2
3B Ursehla .973 2 4.5 6.0 15.7
SS Lindor .967 6 6.0 4.9 14.9
LF Brantley .992 1 0.3 -2.1 -1.4 -3.3
CF Almonte 1.000 2 0.4 -0.2 0.9 10.0
RF Chisenhall 1.000 4 1.6 0.5 2.3 27.3

What’s interesting is that the biggest difference in the infield is Francisco Lindor (Giovanny Urshela has been very solid, but Chisenhall was pretty similar this season at 3B).  I’m sure someone at FanGraphs could churn out a really cool article (if someone hasn’t already) that shows us a quantifiable difference an above average to well above average shortstop makes for a team even if you just keep the rest of the infield the same, as the control.  The 2015 Tigers come to mind – a healthy Jose Iglesias has made a difference for a team that still features Nick Castellanos at 3B and Miguel Cabrera at 1B.  Teams are willing to sacrifice offensive contributions if a SS has elite defensive skills (Pete Kozma, Andrelton Simmons, Zack Cozart to name a couple off the top of my head).  Lindor, to this point, has been an above average offensive player, too, so this could be special.

At this point the Indians are in last place and are out of contention.  Abraham Almonte is their starting center fielder and with Kipnis back from the DL, Jose Ramirez is not playing 2B, but is instead getting reps in left field while Michael Brantley DHs due to his ailing shoulder.  Perhaps all this means is that they don’t have better replacements; OR PERHAPS they’re planning to establish a more defense-oriented squad next year…

Now there’s no doubt that this research has led to some frustrating conclusions.  With Gomes behind the plate, the K rate and GB rate of the staff has trended in the wrong direction in regards to ERA indicators; so is the difference in the batted ball profile plus an improved defense enough to make up for these facts?  This small sample size thinks so, but it could 100% just be noise.  However, there are clubs that are succeeding by using similar tactics right now:

Team ERA FIP ERA-FIP GB% (rank) SOFT% (rank) OSWING% K-BB% (rank)
Royals 3.57 3.93 -0.36 42.1 (29th) 18.1 (16th) 30.9 (19th) 10.5 (26th)
Rays 3.63 3.79 -0.16 42.4 (28th) 18.7 (13th) 31.2 (17th) 14.8 (7th)
Indians (as a reference) 3.85 3.65 0.20 44.7 (17th) 18.2 (15th) 33.3 (2nd) 16.9 (1st)

Granted, the Royals and Rays have the 1st and 2nd best defenses in baseball, and their home parks play differently than the Indians, but they also don’t boast the arms the Indians do.

The Indians have their noses deep in advanced metrics and having rid themselves of Swisher, Bourn, and Moss during 2015’s trading period has allowed them to deploy a better defensive unit which has amplified their biggest strength – their starting pitching.  Furthermore, their unwillingness to move any of their top 4 starting pitchers also leads me to believe they see next year as a time for them to compete.  I’m not going to speculate what moves the Indians will make in the offseason, but I hope they stick with this defense-oriented situation they have gone with recently because it’s been working (and because I own a lot of shares of Kluber, Carrasco, and Salazar in fantasy).


The Evan Gattis Triples Game

There are 13 qualified hitters in baseball with at least six triples.  12 of the 13 players have at least five SB and the average among those 12 players is 18 steals.  Among the league leading ranks in triples stands one man who defies the common narrative that triples hitters are speedy.  He’s known as ‘El Oso Blanco’, which translates to “The White Bear” for non Spanish-speaking readers, and listed at a whopping 6’4”, 260 lbs, it’s easy to see why they call him that.  His story is one of modern day folklore, and it’s fitting that his wandering days eventually would lead him to an Astros squad that have taken the American League West by surprise.  Evan Gattis, has as many stolen bases as he has batting gloves, or as many as he appears to have, which is zero, because if you’ve witnessed him hit at all, one of the first things you notice about him is that he does not wear batting gloves.  Yet there his name is, one triple ahead of the likes of Adam Eaton and David Peralta; Evan Gattis, with nine triples, the man in sole position of second place for the most triples in major league baseball.

Consider this: he had 1 triple in his first 783 PA (or even 1 in his first 928, if we want to include all of his career PA up to May 28th, 2015 – the date of his first triple this year), and that one triple was hit into Triples Alley at AT&T Park in San Francisco on May 13th, 2014 (No, this was not a Friday the 13th).  Triples Alley is aptly named for the high volume of balls that are hit there that result in triples (relatively speaking).  So that was Gattis’ one and only, and yet he’s hit 9 in his following 446 plate appearances (or even scarier, 9 in 301 PA).  Before delving too much into this, I thought, “Conditions for an Evan Gattis triple would have to be perfect.  I bet at least 6 of these triples are due to Tal’s Hill“, which is the 90 foot wide, 30 degree incline, that extends the area of balls in play about 34 feet beyond where the fence would normally end at Minute Maid Park.  It is a whopping 436 feet to the wall at the top of Tall’s Hill.  However, a quick peek at Gattis’ home/away splits would reveal that he has just 5 triples at home and 4 on the road.

Well then he must have hit his triples in “triple-friendly” parks; below is a table showing where he has hit his 9 triples this year:

STADIUM 3B FACTOR
AT & T Park 1.211
Minute Maid Park (5) 1.549
Kauffman Stadium 1.240
Comerica Park (2) 1.465

Okay, that was predictable and makes a lot of sense to me.  Now here is a spray chart that shows his hit types (if you don’t read keys, the red dots are the triples):

chart (3)

*There is a sneaky red dot signifying a triple hiding behind a home run dot in left center just to the right of the most far left red dot*

Looking at the plotting of the red dots and considering what stadiums he hit his triples at is where I got the idea for this article – and I will now switch to writing in present tense to portray the feeling of spontaneity I felt when I first started this writing. Considering the factors, I get the feeling that I can guess which stadium each of his triples have been hit at – an exhibition of frivolity to be sure, but this is just the kind of thing that we’re looking for while we’re at work, trying to look busy, isn’t it?  If you wanna play, keep reading and guess along.  I am going to take a liberty and use the pronoun “we” instead of “I” so this feels more like a group effort.  And I also have a disclaimer: If you continue reading, you are assuming the risk that this could be a jarringly disjointed, moderately sarcastic, and gif cluttered article – it is.

The Evan Gattis Triples Game

Let’s consider my first hypothesis – that Tal’s Hill is responsible for a majority of these triples.  Looking at the red dots it looks like 3 of them may have very well landed there.  In order to kind of stick with my original idea, we’ll take the five most centrally located red dots and say that those are the triples he hit at home.

chart home

For reference into this reasoning, here’s the stadium layout of Minute Maid Park (all ballpark layouts are courtesy of Clem’s Baseball).  Note the massive depth of center field.

MinuteMaidPark

Using FanGraphs’ Game Logs I’ll pinpoint the dates of his 5 home triples and then plug those dates into Gattis’ spray chart over at BrooksBaseball.

1st Triple at home; 3rd Triple of Season: 06/28 vs NYY

triple1

That ball is not hit to Tal’s Hill, but it is one of his 5 most centrally hit triples of 2015, so that’s 1/1 if you’re scoring at home.

Now here’s the GIF – and here’s where I have to pause and give credit to another article.  When I started to write this post I hadn’t planned on including so much media, but as the post evolved it really did call for GIFs of these triples.  When I searched ‘Evan Gattis triples’ on google, the first link that popped up is this SB Nation post by Murphy Powell, and it’s the source for 6 of the 8 GIFs here and is, by all accounts, VERY similar and a much better article than mine, so check it out.  Any other GIFs were created using Baseball Savant media and makeagif.com.

gattis_3.0

“ARGH!”  That’s the sound of Michael Pineda groaning as he grimaces and falls on to bended-knee while telepathically willing the ball to stay in the park, which it does, barely.  Pineda is groaning because that was not a quality slider.  This information could probably be an entirely new post altogether, but I did warn you about this post being disjointed, so let’s to a quick detour.

This triple took place at the end of June – a table tracking velo and movement of Michael Pineda’s sliders shows that Pineda was throwing sliders of a lesser quality during this period.

Date(s) Velo x-movement v-movement BAA
Pitch to Gattis (06/28) 87.9 2.15 1.25 1.000 (obviously)
April 2015 84.08 4.54 -0.30 .208
May 2015 85.76 4.00 -0.41 .191
June 2015 87.12 2.47 0.02 .250
July 2015 87.10 1.34 0.46 .231

Whether it has been a conscious decision to throw his slider harder or it is a product of his ailing elbow, the results have not been so good.

Anyways, at this point, three triples into the season – and 3 in his last 36 games – Gattis’ reputation as a triples machine is really starting to build momentum (I warned you about the sarcasm, too) and as soon as the ball bounces away from Brett Gardner and is left to be retrieved by a scurrying Garrett Jones, Gattis is off to the races.

2nd Triple at home; 4th Triple of the season: 06/30 vs KCR

triple2

Bingo! This is a Tal’s Hill special and would be a home run at 29 other ball parks.

gattis_4.0

Lorenzo Cain, who has to at least be in the conversation for the smoothest looking active baseball player, is rendered looking like a reckless drunkard, smashing head-first into the wall and then toppling over on to his side after heaving the ball in towards a cut-off man from his knee.  Nonetheless, Gattis has his 4th triple of the year and we are 2 for 2.

3rd Triple at Home; 5th Triple of the season: 07/17 vs TEX

triple3

That one is not quite as impressive as the last one in terms of distance, but he laid into this one pretty good, too.

gattis_real_5.0

This hit scoots up on to Tal’s Hill after it nicks off Leonys Martin’s glove and then bounces off the wall – are you already missing the antics that Tal’s Hill won’t be causing in 2016?  The main thing here is that we are now 3 for 3 in this game.  I knew this would be easy.

4th Triple at Home; 7th Triple of the year: 07-28 vs LAA

triple4

So we’re wrong on this one and that brings our tally to 3 for 4 – and I’ll take most of the responsibility for the ones we get wrong – my bad.  “My bad” suffices when a player makes an errant pass out of bounds in a professional basketball game, so it should be enough here, too.

gattis_5.0 (1)

This one hit just under the yellow line against the Papa John’s sign, and it had to careen off the wall in such a way that it caused the ball to bounce into another empty center field where Shane Victorino finally picks it up and hurls it in just in time for Gattis to pull in to third base with a stand up triple.

5th Triple at Home; 7th Triple of the year: 08-14 vs DET

plot_hc_spray

This is technically another one of the 5 most centrally located triples so we are 4 out of 5.

Gattis Triple 5 Gif


The ball comes off the bat hard enough (99.3 mph) and then takes a generously frictional hop and loses speed as it trickles up against the wall in the deepest part of right center field at Minute Maid.  I don’t care if even the great Roberto Clemente was in right field, that is a long relay throw and there is plenty of time for Evan Gattis to lock down his 9th triple of the season.  Gattis is immediately pulled from the game as he is probably completely out of juice at this point in the season, but fans rejoice over his exploits and even Evan Gattis can’t believe his recent output of triples:

7fx3An


So we are hitting .800 after the home stand, but now let’s take on the triples hit away from home.  Here are the triples that we have left to identify:

chart (3)

The media, for whatever reason, has started to get smaller, so I will point out the locations of the triples: there is one to deep, left center; one to deep center, one to right-center, and one down the right field line.

For reference, here are the stadium layouts for Comerica (where he’s hit 2 triples), AT&T Park, and Kauffman Stadium.

Comerica

ballpark

AT&T

triple7

Kauffman Stadium: has the largest outfield in major league baseball as measured by total square feet.

KauffmanStadium

Let’s start with the one triple hit to deep center that did not take place at Minute Maid and say that one took place at Comerica Park, since, like Minute Maid, Comerica has a cavernous center field.

1st Triple of the Year: 05/21 vs DET @ Comerica

triple6

Huzzah! That was kind of obvious and maybe shouldn’t have elicited a Tobias Funke jubilation, but the fact that we’re five for six does.

gattis_half_1.0

Let’s jump ahead to what should be considered the other obvious pick, his triple hit at AT&T park.  There’s a triple that was hit to right center and we’ll say this triple it was a throwback piece; inspired by his first triple in the bigs, in that it was hit to Triples Alley.

8th Triple of the Year: 08/11 vs SFG @ AT&T Park

triple8

This one is wrong and that stings because I felt like this one would’ve been obvious.

qzp-eX

I’m not sure how much of the ball Gregor Blanco gets when he leaps – he may have ultimately sandwiched the ball between his back and the wall – but it looks like he prevented an Evan Gattis HR; but still can’t prevent yet another Evan Gattis Triple.  We’re 5 out of 7.

So of the two triples left, there is one that goes to deep right-center, and one that scurries down a right-field line.  The ballparks left are Kauffman and Comerica.

We’ll play the odds and guess that the one down the right-field line is hit at Kauffman Stadium because it would make sense for the one to right-center to have ended up in that little enclave at Comerica.

6th Triple of the Season: 07/26 vs KCR @ Kauffman Stadium

Oddly enough there is no data for this on Brooks Baseball and there is also no GIF for this triple; Who’s padding the stats?? At least that builds some suspense…

2nd Triple of the Season: 05/24 vs DET @ Comerica

triple9

Wrong – which also makes us wrong on the triple hit at Kauffman so we miss the final 2 – “my bad”.

gattis_2.0

It looks like Rajai Davis was positioned towards the gap and therefore had to hunt this ball down while El Oso Blanco set the base paths aflame.

So our (my) final score is 5/9, which is good but not great considering my 100% accuracy prediction.  While I’m completely aware of the vast, expansive magnitude of my ignorance, I really did believe I could pick out where each of these 9 triples happened…it’s probably this same hubris that causes me to lose $3 daily over at Draft Kings.

Trying to elicit some meaning out of this article would be contrived, so I’ll just say (tongue-in-cheek-ly), Gattis is likely to experience some regression to the mean (whatever that mean is in regards to triples).  I can’t imagine a reality where Evan Gattis highlights aren’t home runs and continue to be centered around him tearing around the basepaths – his massive, rippling thighs simultaneously inspiring awe, terror, and a few chuckles among his teammates – but what do I know?  The last time I tried to predict something about Evan Gattis, I was only 55.6% right.


Rendering Paul Goldschmidt a Mere Mortal

The importance of getting ahead of hitters is stressed to pitchers from the first time they play in a non-coach-pitch league.  It’s not what happens on the pitch immediately following a first pitch strike, it’s because the numbers for the rest of the at bat sway dramatically in the pitcher’s favor.

2015 AVG SLG ISO
FIRST PITCH .335 .539 .204
AB after 1st Pitch Strike .223 .338 .115

These are league averages, but for the most part they apply to individual hitters as well.  Paul Goldschmidt is not a “league average” hitter, in fact, he is at least in the conversation when discussing the best hitter in baseball right now (2015) – and I only say at least because I’m too afraid of the backlash I might receive if I declared him the best.  But regardless if a pitcher is facing an average hitter or an elite hitter, the law of getting ahead applies –  even if the numbers for Goldschmidt do look a bit different from the table of above.

2015 AVG SLG ISO
FIRST PITCH .545 1.152 .607
After 1st Pitch Strike .288 .465 .177

Paul Goldschimdt is just so strong, and so adept at making hard contact to all parts of the field that, even at his worst, he’s still so much better than other professional hitters.  The results clearly show that he’s a lesser version of himself throughout the duration of an at-bat that starts with a first-pitch strike, but here’s the thing: getting a first-pitch strike on Goldschmidt isn’t easy.  Not only is he discerning, but he is so devastatingly destructive when he sees something he likes.  Pitchers have gotten a first pitch strike against Goldschmidt 56.7% this season (league average is 61.1%).  In 471 PA, Paul Goldschmidt has only swung 126 times at first pitches, or 26.8%.  It could be said that Paul Goldschmidt “goes to bat with a plan”.  But it’s not like pitchers’ game plans will stand idle while Goldschmidt continues to pummel them; they will make adjustments, and one adjustment they have made, because the pay-off is so dramatic, lies in figuring out how to get ahead of him.

First, let’s consider two samples from Goldschmidt’s 2015 – through July 3rd of this year Paul Goldschmidt put up MVP numbers:

April 6 – July 3:

PA H AB R 2B 3B HR RBI SB BB K AVG OBP SLG OPS ISO
354 102 288 57 18 1 20 66 15 64 65 .354 .470 .632 1.102 .278

Since then, however, he has hit like someone who just might be mortal:

July 4 – August 4:

PA H AB R 2B 3B HR RBI SB BB K AVG OBP SLG OPS ISO
111 24 88 10 6 0 2 11 2 19 28 .273 .387 .409 .796 .136

So what course of action have pitchers taken to get ahead of him in the count?  The answer lies in the conveniently bolded numbers featured in the CB% column of the table below.

Numbers represent the usage of pitches in all first-pitch situations to Paul Goldschmidt.

Date FB% SINKER% CHANGE% SLIDER% CB% CUT% SPLIT%
04/06-07/03 40.18 23.46 3.52 14.66 8.21 9.38 0.05
07/04-08/04 36.04 24.32 0.00 14.41 18.02 9.38 0.90

Obviously there’s been an uptick of a larger percentage in split fingers for first pitches, but a hell of a lot more pitchers throw curveballs than splitters, so that value is not really important.  What is important is that 119.5% increase in first-pitch curveballs, because Paul Goldschmidt SPITS at first pitch curveballs.  He saw twenty-eight, 1st pitch curveballs in the sample size concluding July 3rd and swung at a grand total of 1 of them.  Since then, in a month, he’s seen 20, first-pitch curveballs and has swung at exactly 0 of them.

Goldschmidt is looking for something hard-ish (fastball/slider/change-up; league average change up velo is 83.3 compared to 77.7 for curveballs and 84.2 for sliders) that he can drive on the first pitch, and knows he can lay off curveballs to sacrifice a first-pitch strike and still be an above-average hitter.  For the record, it’s not like Goldschmidt is bad against curveballs; he owns a 3.31 wCB/C in 2015 (3.79 through July 3rd, and 2.16 after), it’s just that he’s committed to his plan.  Pitchers – or analysts – have noticed his disregard for curveballs as first pitches, and the pitchers – not the analysts – have twirled curveballs in to Goldschmidt on the first pitch at a much higher rate over the last month – again, that number is 119.5% more often.  While the strike percentage of these curveballs has only been 45%, that’s still up from the 28% of curveballs for first-pitch strikes through July 3rd.

Conjecture alert:  Perhaps expecting more first-pitch curveballs, Paul Goldschmidt has readied himself to not swing at the first pitch, as he has swung at just 25.3% of non-curveball first pitches since July 4th, compared to 32.9% through July 3rd.  Pitchers have been able to sneak their first pitch strike percentage up against Goldy from 55.9% to 59.5% in this past month – that’s a 6.4% increase.  So it seems as though the best way to beat Paul Goldschmidt is to try to find some way to make him swing the bat less, because when he does, bad things happen to baseballs.  For clarification, I’m talking about throwing him more first pitch curveballs, not walking him every time up.

Paul Goldschmidt is so good that he will probably adjust to this new approach fairly quickly.  I said earlier, “he knows he can lay off curveballs to sacrifice a first-pitch strike and still be an above-average hitter” – Paul Goldschmidt’s aim is not to be a player who is an above-average hitter – he’s a force at the plate and he will adjust.  Health permitting, Goldschmidt will likely finish the season with at least a .300 AVG, 100 R scored, 30 HR, 100 RBI, and 20 SB – a line we haven’t seen from a first baseman since Jeff Bagwell did it in 1999.

So as Goldschmidt adjusts to this new attack from pitchers, maybe the real number to take away from this research is that Goldschmidt is partying like it’s 1999.