Paul Goldschmidt Has a Pop-Up Problem
When we were growing up, my dad would sometimes refer to my sister and me as ingrates. I always had a sneaking suspicion that statement was ruthless. I was young and under the assumption that he provided us everything we needed and wanted because that was what he was designed to do. In a sense, that perception of him probably does reflect the “ungratefulness” that young children tend to posses, innocent as it may be, what with a child’s inherently feeble comprehension of interpersonal relationships. I am now the parent of a two-year-old boy and just the other night he saw a commercial for a Power Wheels Jeep Wrangler that elicited the following outburst:
“I want to go in there!”
“I want one!”
Finally he turned to peer into my eyes and, in order to accentuate the severity of his next mandate, he raised his index finger and spoke;
“Daddy, better buy me one.”
His tone became dramatically more somber than it had been for the first two exclamations, and it made me laugh the hardest. I am certain I was the narrator of many statements similar to this as a kid, but the reality is, when kids are given everything they want, it’s up to the parent to understand that if there is a perceived lack of gratitude, it is a direct byproduct of the parent’s efforts to make them happy or even to keep them alive.
Lately I’ve been thinking of how I can be really ungrateful for even truly fine baseball seasons. Even some All-Star seasons disappoint me, and I know I’m not alone. If Mike Trout was in the middle of putting up a 5-win season, we’d all be talking about what could be wrong with Mike Trout. When players set the bar so ridiculously high we tend to hold them to that standard for better or worse. As an actual example, it’s completely understandable to be disappointed by Bryce Harper’s 2016 season after last year’s masterpiece. The reality is, however, that he’s 23 and has currently produced 3.4 WAR. His baserunning and defense have been positives and he’s compiled over 20 home runs and 20 stolen bases while hitting 14 percent better than league average; that’s damn fine and yet it’s still a damn shame.
Paul Goldschmidt, meanwhile, is hitting .301/.414/.494 and has accrued 4.7 WAR and might surpass 30 SB this year. His 136 wRC+ is still great even if it’s not quite the 158 he’s put up over the last three seasons. So why do I feel the loathsome inklings of disappointment bubbling inside of me? Firstly, and admittedly shallow of me, I like my Goldschmidt with more extra-base hits. For the first time in his professional career, at any level, Goldschmidt’s ISO starts with a number under 2. It’s possible he has a nice final week and brings that number up into the .200 range, but there are still some potentially concerning blips in his batted-ball profile that could portend of further decline in production. What I’m referring to most specifically, as the title suggests, is that Paul Goldschmidt has developed a pop-up problem.
From 2011 through 2015, Goldschmidt’s cumulative IFFB% was 4.8%. This year it sits at 14%. He has 17 IFFB this year, which is the same amount he had in the three previous seasons combined. Pop-ups aren’t good as they’re essentially as productive as a strikeout. Here are the 10 players with the biggest increases in IFFB% in 2016 compared to 2015 among qualified hitters in both years.
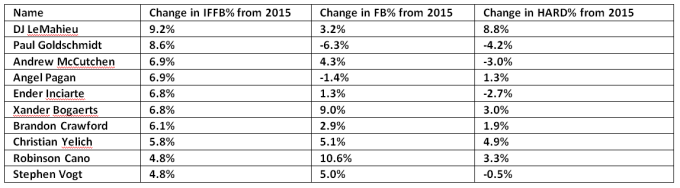
I’m not suggesting there’s a positive correlation between popping up and performance, but it’s easy to make sense of some of the names that appear on this list. If you watched Josh Donaldson break down his swing on the MLB Network, you know that a lot of players are thinking about not hitting the ball on the ground because damage is done in the air. Did you know that DJ LeMahieu, at the time of this writing, has a higher slugging percentage than Goldschmidt? That’s bonkers. The league’s slugging percentage last year was .405, and this year it’s .418, but this group of players, minus Goldschmidt, have added, on average, 21 points to their slugging percentage, and part of that, for this group, has to be chalked up to putting more balls in the air.
![]()
What I’m hoping to highlight is that what is even more troublesome for Goldschmidt is that he is the only player in this top 10 who had an increase in their IFFB% while also seeing his fly-ball rate and hard-hit rate drop.
![]()
So I have what could be an insultingly obvious hypothesis: since Goldschmidt has long been a quality opposite-field hitter, I am theorizing that pitchers are exploiting him with more fastballs up and in where he can’t quite get his hands extended. A cursory glance at his heat map vs. fastballs in 2015 and 2016 reveals a minor shift in approach by the league.


Besides the obvious, which is that pitchers are avoiding the zone even more than they had before, we can see just a bit more red in the specific zone I was referring to. It’s not so glaring or even enough information to make any conclusions, so let’s see if that area is where pitchers are getting Goldy to pop up. On the year, per Brooks Baseball, he has 22 pop-ups, 19 from fastballs and three from offspeed pitches. The 17 that are classified as IFFB by FanGraphs are plotted in the graph below.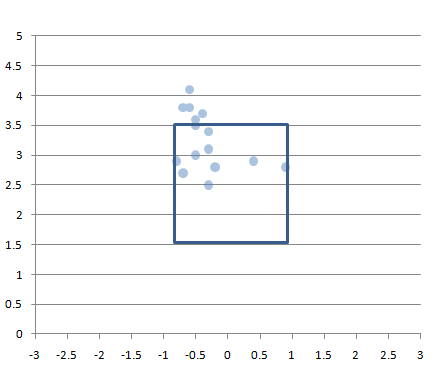
*the two pitches towards the outside corner (for Goldschmidt) are sliders.
However, it’s not as if pitchers have previously avoided throwing Goldschmidt up and in; it just appears, despite his overall swing rate being at a career-low 39%, he’s upped his swing rate against fastballs by over five percentage points in that specific area just above 3.5 ft. And that area has the largest concentration of his pop-ups. Looking at the entire area middle/up/and in to Goldschmidt, he has increased his swing rate from 57.2% in 2015 to 60.7% in 2016 while staying away from lower pitches in general. It’s a philosophy that is being echoed throughout baseball right now, and it is not at all a bad plan, but it has caused him, either deliberately or due the effect of swinging at these pitches more often, to go to the opposite field this season less than he ever has. This also is not necessarily a negative shift in regards to a batted-ball profile, but from 2013 – 2015 Goldschmidt was the fifth-most productive hitter in baseball going the other way, and in 2016 he’s 33rd. That represents a drop in wRC+ from 204 to 158, and from a .729 SLG (.329 ISO) to a .647 SLG (.255 ISO). I’ve long since regarded Goldschmidt to be in the same tier of hitters as Trout, Votto, Cabrera, and pre-2016 McCutchen, and it would be a shame for him to move away from a facet of his game that enables him to produce at that elite level.
At the end of this season I don’t think I’ll actually be all that worried about Goldschmidt; I can reconcile a 136 wRC+, even if it would feel a little disappointing. I wrote about Paul Goldschmidt last year and I wasn’t worried then, either. But I do think if I’m going to take a 136 wRC+ for granted I should place that appreciation toward the catalyst for this change in Goldschmidt’s performance, and a lot of that credit has to go to the pitchers who have induced 17 IFFB from a player who only averaged 5.7 over the last three seasons.
Now I know that setting up a pitch has so much more to do with an entire at-bat, game, or even season than the pitch that was thrown immediately before it, but for this exercise I want to look at the pitch that caused Goldschmidt to pop up and how it relates to the pitch thrown immediately before it. It’s crude and does not tell the whole story, but it still shows a definite approach — and, for all intents and purposes, it’s probably a decent representation of a general tactic used across the league for inducing pop-ups. I found all the data I needed using PITCHf/x at Brooks Baseball and I recorded the velocity, horizontal movement, vertical movement, horizontal location, and vertical location of each pitch Goldschmidt popped out on as well as the same data set for each set-up pitch if there was one (which would be in any situation where Goldschmidt did not pop up on the first pitch of an-bat). Below you’ll find a plot that shows the average location and characteristics of each pitch.
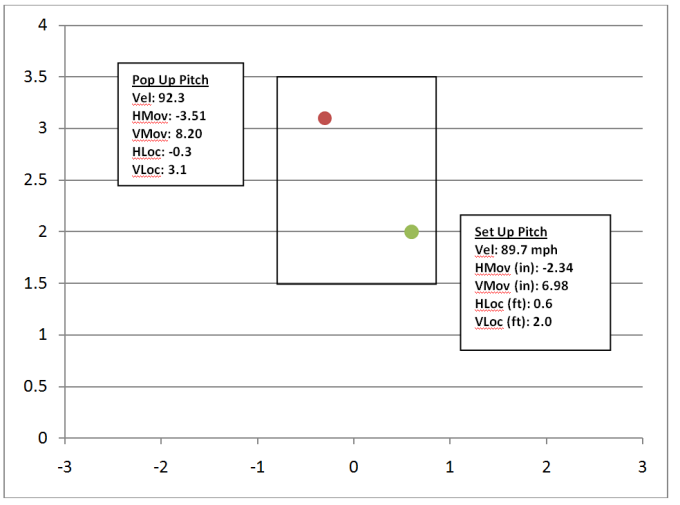
And here is that data in a table represented as the average difference between the two plot points.

Doesn’t it make you feel warm when something fits into the shape you had pegged it to be? That’s just really simple and makes a hell of a lot of sense. Or maybe I feel warm for taking something that was disappointing and turning it into something I can really appreciate. Now if you’ll excuse me, I have a Power Wheels Jeep Wrangler to buy.
Mark also writes for Beyond the Box Score Send him bat flip gifs and follow him @NtflixnRichHill Instagram Markd1414
Reading this back I would’ve added two things:
1. This started in July of 2015. He has 25 IFFB in 1048 PA since last July and only had 21 IFFB in 2293 career PA before July 2015.
2. He had 9 HBP in his those first 2293 career PA and he has 9 in the 1048 PA since.
Impressive work
Thanks Ryan DC, much appreciated.