Author Archive

Frankenstein and the Rays’ Sister City Concept

In 2018, the Tampa Bay Rays introduced the Opener, a novel concept in which a relief pitcher started a game with the purpose of shutting down an offense in the first few innings. The Opener would then hand the ball to a bulk pitcher, who went three-to-four innings before giving way to the usual bullpen corps.

When the Rays introduced the Opener strategy, many in baseball thought it was blasphemy. Starting pitchers have roles and this is the way the pitcher order has been for generations. How dare the Rays upset the natural order of roles, titles, and statistics?

When analysts looked at the Rays roster, however, they quickly understood what the team was doing. By not recognizing a “pitching rotation,” the Rays were looking a level deeper. They were stacking pitchers on a per-game basis, with the intent to win each game and hence build enough wins to make the playoffs. Once it was understood, the Opener was applauded and eventually copied throughout the league.

Besides being a sly way to neutralize lineups, the Opener represented the “Rays Way” amidst financial necessity. The team could not afford a typical major league rotation of four or five quality starters. Relief pitchers are cheaper and easier to find. They couldn’t find five aces, so they built ace performances using multiple relievers, with the additional bonus of paying them less. If you can’t find a hundred-million-dollar starter, build one. Read the rest of this entry »


Why a World Series Appearance Might Not Save the Rays in Tampa Bay

As Major League Baseball prepares for 2021, teams are bracing for another season of COVID-19 related financial problems. There will undoubtedly be a smaller-than-usual capacity of fans at ballparks nationwide, and depending on the municipality, there might not be fans at all. Teams are hoping 2021 is not as bad as 2020. According to an analysis by the Tampa Bay Business Journal, the New York Yankees missed over $437 million in expected income. Near the bottom of the list, the Tampa Bay Rays lost only $67 million in expected income.

But the pandemic affected the Rays in additional ways, some of which could impair the ability of the team to stay in Tampa Bay. As the Rays recently appeared in the World Series, it is important to explore how the pandemic could impact the long-term sustainability of baseball in Tampa Bay.

In 2019, the Tampa Bay Rays won 96 games and made the playoffs for the first time in six years. Their series versus the Astros was the Rays’ first postseason under Kevin Cash and their first since Joe Maddon and Andrew Friedman left the organization following the 2014 campaign. After three mediocre seasons, the Rays had increasingly improved under the radar of all but the most dedicated baseball fans. Read the rest of this entry »


Why Extending the Blue Jays Spring Training Location Isn’t In Tampa Bay’s Best Interest

Last week, the Tampa Bay Times reported that the City of Dunedin and the Toronto Blue Jays put together a proposal that would keep the Blue Jays in Dunedin for another 25 years at a cost of $81 million dollars. The money invested in the project would be spent to upgrade the Blue Jays training facility, making it a year-round operating facility for the organization, and refurbish Florida Auto Exchange Stadium, expanding the stadium from 5,000 to 8,000 seats.

For nearly three years, my writing has taken a holistic view on baseball in Tampa Bay. I have taken to heart the premise of Major League Baseball and the mayors of our largest cities that Tampa Bay is a Major League region. In May of this year, I wrote an article for regional political website that asked whether local politicians believe this premise. I argued that unfortunately local politicians are acting in their own local self-interest and dividing Tampa Bay into four spring training/Minor League regions.

Last season, I wrote a post on another Rays blog that stated Tampa Bay is the fifth-most overextended sports market in America. The data for this post, from the American City Business Journals, stated Tampa Bay is currently $86 billion below where they need to be in personal income to support all the pro sports in the market. The study unfortunately did not include arena league football (Tampa Bay Storm), lower-level professional soccer (Tampa Bay Rowdies), and spring training, all of which locals in Tampa Bay spend money on.

This is why extending the Blue Jays in Tampa Bay is a bad idea. Allowing the Blue Jays to leave would allow other sports to receive fan dollars and aid their existence, removing one obstacle from an already overcrowded market. If the region values its major sports, it must allow the minor sports to walk away.

There are plenty of arguments used by the Blue Jays, the City of Dunedin, Bonn Marketing, and the team of hired economists that show why extending the Blue Jays is a good idea. This post will look at many of these points and provide alternate or opposing views.

Market Assumptions

In 2016, Blue Jays Spring Training attendance increased 5%. They were the only team in the Tampa Bay area that had a spring training attendance increase in 2016. Here is the Blue Jays spring training attendance since 2005.

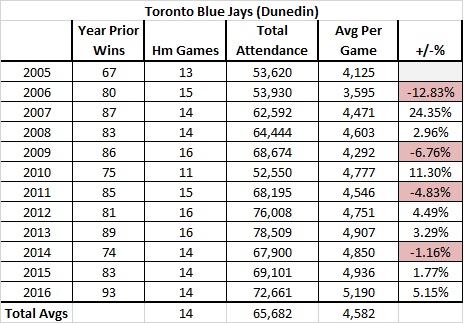
First, the Blue Jays had their highest attendance the same year they had their most wins in 11 years. While this is not coincidence, there is little correlation between wins and attendance in previous seasons. This year, they again have a chance to win 90 games and make the playoffs. That should bode well for spring training attendance in 2017 and we can probably predict a similar turnout to 2016.

But what happens when the Jays stop winning? Will attendance fall below 5,000 again?

Second, the released economic studies detail how valuable spring training is to Pinellas County. The study states that of the over 70,000 fans that attended Blue Jays spring training, 79% resided outside of Pinellas County. These tourists brought in $70.6 million in income to Pinellas County.

If we subtract 5% from the $70.6 2016 income, we can estimate a $67 million impact in 2015. In 2015, the tourism total for Pinellas County was $4.65 billion.

Therefore in 2015, the Blue Jays accounted for 1.4% of Pinellas County’s tourism income.

The Dunedin-Blue Jays study fails to account for the other spring training venues. If 23,539 (32.4%) of the Jays spring training attendance stayed in Pinellas County, did they see the Phillies and Yankees who also train in the local region? If the Jays left, the region might only lose one night of visitors’ stay, not the entire 7.4 nights reported. Because of the other local teams, the Jays cannot assume they are the only cause of visitors.

Next, let’s breakdown the Blue Jays 2016 spring training attendance:

  • 72,652 total
  • Non-county attendance: 57,395 (78.9%)
  • In county attendance: 19,257 (26.5%)
  • Out of state: 23,539 (32.4%)
  • In state/Out of county: 33,856 (58.9%)

While we can safely assume the out of state fans stay in local hotels, what about the “in state/out of county”?

Local Spring Training Market Conflicts

Of the Jays 16 games in Dunedin in 2016, 7 were against teams with local ties (Phillies, Yankees, and Rays). Fans for those games could have either been from Hillsborough County or stayed at a hotel to also see another team’s games.

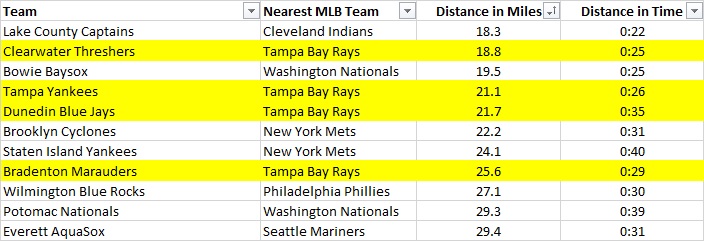
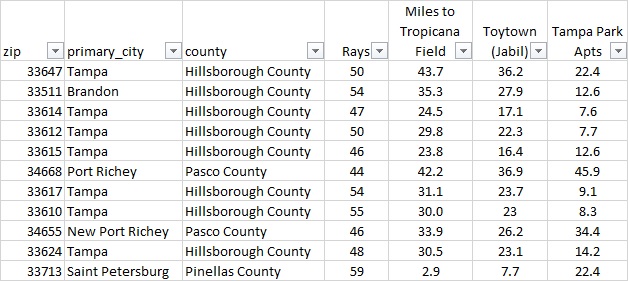
As for the 19,257 Pinellas County residents that went to see the Blue Jays spring training in 2016, their money could be spent on any other leisure activity, to include supporting the Tampa Bay Rays regular season games a month later and 21.7 miles away.

Many spring training supporters do not understand regional money spent on spring training could be spent on the Rays. They argue that the Rays don’t train in Tampa Bay, so they are not potential gainers of local spring training spending. Proponents of this view need to understand that money in hand on March 30 does not disappear on April 1. Fans of 28 other teams (Arizona excluded) wait until April to spend leisure money on baseball. If they are fans of an out-of-town team, they wait until that team visits their local team. This spending behavior is done all over the nation.

Waiting until the Blue Jays visit Tropicana Field would help the Rays’ bottom line and support Major League Baseball in the region. When locals buy tickets to spring training, they are spending their annual leisure money on a replacement good available before the premium product is released.

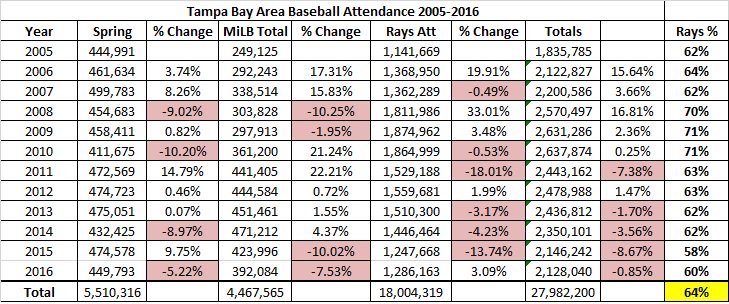
In 2016, the Rays accounted for 60% of all baseball tickets sold in the Tampa Bay area. This was an increase from the 58% in 2015, but far from the 71% of tickets sold to Rays games in 2009 and 2010. As a small-market team, the Rays can’t afford to have that much revenue diverted from their pockets. The Dunedin-Blue Jays agreement might even decrease the Rays percentage and give them less market share.

According to the Tampa Bay Times, 40% of the $81 million cost will go to stadium renovations. The goal is to expand capacity at Florida Auto Exchange Stadium by over 30%. If the Jays sell-out every spring training game (highly unlikely, but possible), their total spring training attendance will be 112,000. This would place the Blue Jays on level with the Pirates in Bradenton, who play in 8,500-seat McKechnie Field. Florida Auto Exchange Stadium would still be smaller than Bright House Field in Clearwater and Steinbrenner Field in Tampa.

A key missing piece in the presentations provided by the Blue Jays and the City of Dunedin is expected attendance. Where is an indicator of increased demand? Just because they’ll build it, doesn’t mean fans will come.

If fans do fill the new 8,000 facility, does the city and the team expect an increased amount of out-of-state fans to visit the new stadium or do they expect the same ratio of demand?

Using the same ratio of people from Pinellas County (26.4%) and assuming 100% sell-outs, 29,568 local residents will be spending money on a substitute baseball product in March 2019 onward. That is 10,000 more tickets purchased by money that could be going to the local Major League team.

Florida State League Market Impact

Following spring training, the facility will still be in use for the Florida State League season. Attendance for Florida State League baseball in Dunedin has been less than stellar. From 2010 to 2015, the Dunedin Blue Jays ranked last in the Florida State League in total and per game attendance. They did not rank last in 2016 due to the relocation of the Lakeland Flying Tigers to a smaller facility while their home stadium was being refurbished.

The current population of Dunedin is less than 40,000. Dunedin is one of the smallest towns in America to host a Minor League team. To fill an expanded Florida Auto Exchange Stadium would mean 20% of the entire population would have to attend. That is a huge demand for a small town.

Only 5.4 miles from the home of the Dunedin Blue Jays is Bright House Field, home of the Clearwater Threshers. Although they rarely play on the same day (only seven times in 2016), these two teams are in direct competition for hyperlocal dollars. They are the same product at the same level for the same cost. The Clearwater Threshers, however, play in a stadium off a major thoroughfare and have excelled in promotions, enabling them to close in on Florida State League attendance records.

The Dunedin Blue Jays would have to increase attendance by at least 300% to match the Clearwater Threshers. Unless new fans are created, expanding Florida Auto Exchange Stadium would likely cannibalize the attendance of the Clearwater Threshers, especially when the Dunedin park is in its “honeymoon phase”.

Emotional Factors

The City of Dunedin promotes that Dunedin is the only location the Blue Jays have called their spring home in their 40-year existence. While this has emotional value, the Dodgers were in Vero Beach from 1949 to 2008 before moving to Arizona and Dodgertown was among the most revered spring training locations in Florida. Teams move; it is the nature of finding the best place for business.

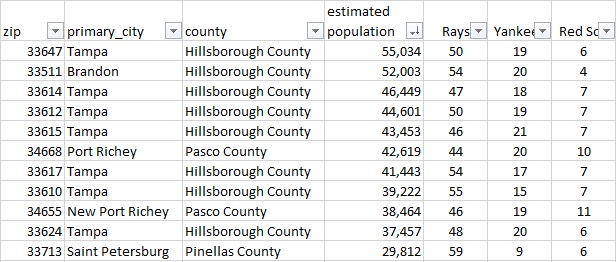
While there may be a bond between the Blue Jays and the City of Dunedin, according to polling, that bond has not translated into support for the Blue Jays. According the New York Times/Facebook survey in 2014, the top three most “liked” teams in Zip Code 34698 are the Rays (49%), the Yankees (16%), and the Red Sox (6%).

Understandably, Dunedin Mayor Julie Bujalski does not want the Blue Jays to leave. She is an elected official and maintaining the status quo is preferred to a loss that could cost her in the next election. She also doesn’t want to be the mayor who lost local revenue provided by spring training, although there is dispute whether or not revenue actually is what team-sponsored studies say it is.

On the other hand, there are many reports of areas such as Winter Haven, Florida, that have lost spring training and not suffered at all economically. University of South Florida Economics Professor Phillip Porter has been often quoted saying that “nothing changes” when a team skips town. Doubtful the City of Dunedin contacted Porter. They did however, contact Bonn Marketing, a Tallahassee, FL marketing firm that has written positive reports about spring training in Florida since 2009.

Other Blue Jays Options

Instead of reinvesting in Dunedin, the Toronto Blue Jays had several other options. They could have done any of the following:

  • Move to Clearwater and split the Phillies facility
  • Move to Viera, Florida where the Nationals recently vacated
  • Move to Kissimmee, Florida where the Astros recently vacated
  • Move to Port Charlotte and split the Rays facility

Of these options, only moving to Clearwater would keep the Blue Jays in a Major League market.

Due to the closed nature of the Dunedin and Toronto Blue Jays negotiations, we will never know what other options the Blue Jays considered. All we know is what they want in Dunedin and that Dunedin seemingly bid against itself.

Conclusion

Contrary to what the City of Dunedin, the Toronto Blue Jays, Bonn Marketing, and their hired economists have promoted, extending the Blue Jays in Dunedin is a bad idea. Until the Tampa Bay Rays are a successful franchise and have the same potential revenue as other small-market teams, local officials should decline renewal of spring training facilities in Tampa Bay. They should stop hedging their bets against the Rays and providing local residents inferior baseball goods in which to spend their money.

Even with tourism, Tampa Bay is not a big enough market to support Major League Baseball, four spring training facilities, and four Minor League teams. Declining to renew the Blue Jays and allowing them to find a new home in Florida is in the best interest of the region.


The Complex Problem of Tampa Bay Baseball Distances and Demographics

A few days ago on Baseball Prospectus, Rian Watt wrote a piece entitled “What Comes After Sabermetrics?“. In his article, Watt discusses the next era of baseball writing and speculates that exploring the social side of baseball will rise in prominence. The next generation of great baseball writers will be those who link baseball to social sciences — from politics to people. It will be the human side of America’s Pastime.

Social understanding is not only important for storytelling; it can also lead to interesting analysis. Social understanding helps us realize who people root for and why, as well as explains many of the not-so-obvious factors affecting fandom. Whereas statistical analysis can assist in complicated problems within the structured game, social analysis can help in off-the-field complex problems such as marketing and fan base development.

Which leads us to perhaps the most complex problem in sports marketing today: the fan base of the Tampa Bay Rays.

Last year, I wrote a piece on FanGraphs that discussed a major reason why the Rays struggle with attendance. My conclusion was that the amount of fans living near the ballpark had a huge impact on a team’s weekday attendance. The Rays were dead last in MLB in local population and had the widest difference between weekday and weekend attendance. In 2014, the Rays averaged 14,297 fans Monday through Thursday. On Friday through Sunday, with fans given more time to get to ballpark, their attendance increased 51.7% to 21,692.

In 2015, the Rays again struggled to draw fans during the week. Last season, however, their difficulties at the gate extended to the weekend, specifically Fridays (only 14,887 fans per game). Still, their difference remained well over the 2014 MLB average weekend/weekday difference of 20% and far above the Giants’ weekend/weekday difference of 0%.

  • Mon-Thurs average attendance: 12,688
  • Fri-Sun average attendance: 18,328
  • Increase: 30.7%

Since my last article, I have continued to research the complexities of the Tampa Bay baseball market. With the team finally able to explore the region for a possible new stadium location, I want to know if a new stadium is going to matter. Is the amount of money taxpayers are inevitably going to spend worth the trouble? Will the Rays see an increase in attendance if they build a stadium in Tampa or on east side of Pinellas County? If we are sure the Tropicana Field site is wrong, which of the front-running locations is better?

And what about some of the other social variables? It is a well-established fact that Florida has a high amount of non-natives. In 2012, only 36% of people living in Florida were born in Florida. We can probably assume that number is higher in the metro areas and lower in the rural regions. The Tampa Bay area, for example, has a high population of people from New York and other Northeast states.

According to the New York Times, 50,000 New Yorkers a year move to Florida. According to the Tampa Tribune, roughly 10% of those move to Hillsborough, Pinellas, and Pasco Counties — the Tampa Bay area.

That’s 5,000 New Yorkers a year moving to Tampa Bay. If 50% are baseball fans, that’s 2,500 fans per year not rooting for the local team. In the case of the Yankees, these fans are rooting directly against the local team. With a metro population of 2.8 million, that’s a nearly 1% increase per year in opposing fans moving to the area. So any research we do has to keep that population in mind.

In order to attempt to untangle the complex mess that is the Tampa Bay baseball market, I’ve started to deep-dive into census data, distances, and fan preferences. For population I use census.gov; for distance I use Google Maps; and for fan preference, I use the New York Times/Facebook 2014 interactive map of baseball fandom.

Currently, the Tampa Bay area has 239 zip codes assigned. Here are the 11 most populated:

The reason the list goes to 11 is not just a Spinal Tap reference — it is because the 11th-most populated zip code is the current location of Tropicana Field and the only Pinellas County mention on the list. If I were to extend the list to 12 we would see one additional Pinellas County entry. However,  number 12, zip code 34698, is Dunedin, Florida, spring-training home of the Toronto Blue Jays. So we will keep the list to 11.

Unfortunately, as you can probably guess, none of the top 10 are near Tropicana Field. As a matter of fact, the average distance from the center of the 11 most populated zip codes to Tropicana Field is 29 miles.

On my site, I’ve written how the four minor-league teams in the Tampa Bay are a closer Mon-Thurs alternative for baseball fans in the Tampa Bay area. They are not only cheaper, but also more convenient. Here are the average distances of the 11 most populated zip codes to Steinbrenner Field (Tampa Yankees), Bright House Field (Clearwater Threshers), Florida Auto Exchange Stadium (Dunedin Blue Jays), and McKechnie Field (Bradenton Marauders).

  • Avg distance to Steinbrenner Field: 16.5 miles
  • Avg distance to Bright House Field: 24.2 miles
  • Avg distance to Florida Auto Exchange Stadium: 27.3 miles
  • Avg distance to McKechnie Field: 49.6 miles

Turning to the social aspect, we next add the Facebook “like” data to our chart. Here we see the Rays don’t have an overwhelming amount of fans anywhere in Tampa Bay area. Even in the Tropicana Field zip code less than 60% of baseball fans root for the home team, although 33713 does have the lowest percentage of Yankees fans on the list.

By comparison, in the similarly-sized Pittsburgh area, 70-75% of fans are Pirates fans and Yankees fans are roughly 5-7%. There are nearly 3x more people rooting for the Yankees in Tampa Bay than in Pittsburgh. Granted there is a longer tradition of rooting for one team in Pittsburgh, but that culture is easier to develop when there is only one team in the area.

So will building a new stadium help the Rays? Here is the population chart with the Rays fandom and distances to two front-running new stadium locations: Toytown and the Tampa Park Apartments.

By average, the Tampa Park Apartments location is 12 miles closer to the top 11 populated zip codes. The Toytown location splits the difference.

  • Avg distance to Tropicana Field: 30 miles
  • Avg distance to Toytown: 24 miles
  • Avg distance to Tampa Park Apartments: 18 miles

Both the Tampa Park Apartments and the Toytown location have another advantage the Tropicana Field location doesn’t have: both are within 15 miles of Steinbrenner Field and Bright House Field, meaning territorial rights can be exercised. While the MLB team has priority and can force the MiLB team to move, doing so might require compensation. For the Rays, removing the competition might be worth the extra cost, even if means paying the high ransom of a division rival.

(Note: territorial rights does not apply to Spring Training currently. If I was the Rays, I would fight that based on the precedence set by the Yankees and Orioles, who moved out of the Miami area before the Marlins began play in South Florida. I would also claim lost local revenue to Spring Training competition. Local fans who go to Steinbrenner Field could just as easily wait a month to see the Yankees at Tropicana Field.)

After a new stadium is built, after the competition is cleared out, and after the Rays have a monopoly of their small market, then they can finally attempt to win the hearts and minds of the region as other small-market teams do.

Rian Watt is absolutely correct. Social understanding is the next great baseball unknown. Knowing the story of fans, where they live, and what motivates them to support teams will be essential as we move from solving baseball’s complicated problems to finding solutions to its most complex problems.


The Importance of the 30-Minute Population Radius on MLB Attendance

In 1992, the San Francisco Giants almost moved to St. Petersburg, Florida. Before the i’s could be dotted and the t’s crossed, new ownership bought the team and the Giants stayed in their Bay Area. Less than 10 years later, the Tampa Bay area received the Devil Rays.

While their results on the field have been somewhat similar since 2008 (Rays winning %: .552, Giants winning % .526), the two teams couldn’t be more different in regards to stadium experience. Since Oct 1, 2010, the Giants have sold out every game at AT&T Park, while the Rays have had 14 regular season sell-outs total since 2010. The Giants play in a beautiful new ballpark on the water, while the Rays play in a dilapidated 30-year old dome.

There is one other major difference when we look at the Giants and the Rays (besides the fact the Giants did draft Buster Posey):

Last year, of the US-based teams, the Giants had the smallest difference in weekend/weekend attendance; the Rays had the largest. By selling out every game, the Giants maintained an average Monday through Thursday attendance of 41,588 and a Friday through Sunday average of 41,589. An average of one person squeezed in to AT&T Park on the weekends.

Meanwhile, at Tropicana Field, the Rays averaged only 14,297 fans per game Monday through Thursday. This was the lowest average weekday attendance in Major League Baseball. On the weekends, however, the Rays averaged 21,692 fans per game. While still the lowest weekend average in Major League Baseball, the Rays saw a 51.7% average increase in attendance on the weekends.

There are many reasons why the Rays struggle with attendance. Many fans and residents point to the condition of the stadium, the demographics, and lack of mass transit as reason for not going. But one of the biggest and least-discussed reasons is that few people actually live near Tropicana Field. According to Maury Brown’s 2011 research on population, the Rays are dead last in population with a 30-mile radius of their ballpark.

A definite correlation exists between the population living within 30 minutes of a ballpark and the difference between weekend and weekday attendance. With only a few exceptions, teams with a 30-minute radius larger than 2 million have smaller weekend/weekday attendance differences. Teams that play in a population radius of less than 2 million, on the other hand, tend to have higher weekend/weekday differences.

Here is a breakdown of the 2014 MLB attendance:

Only the Chicago White Sox and Washington Nationals have more than 2 million people within 30 minutes of their ballpark and had an average weekend difference greater than 20%. Teams with less than 2 million people within 30 minutes of their ballpark who saw a smaller than 20% difference in average weekday to weekend attendance included the Cardinals, Twins, Rangers, and Marlins. The circumstances behind these fanbases should be studied further.

Looking at the data graphically, it is best to omit the New York teams, as the each can draw from a 30-minute population of over 8 million people, more than double any other team on the list. Removing the Mets and Yankees, we see the following:

On the left side of the chart, we see teams with smaller average weekend-to-weekday attendance difference. Notice they are all above 1.5 million and a majority are over 2 million. As we move right on the chart, the percentage gets higher and the dots trend lower, with the exception of the White Sox, who are the top-right dot. The Rays are also evident, as they are the dot in the lower-right.

Local population is important as they are the pool of fans who can most easily get to the ballpark after a day at the office. These are the fans who can also get home from a 3-hour game at a reasonable time. Having a larger local pool to draw from makes it easier for teams to pack their ballpark during fans’ valuable weekday time. It is easier to fill the average major league ballpark on weekdays when 8 million potential fans live within 30 minutes than when a majority of the area’s 3 million people have to travel over an hour each way.

Weekends, on the other hand, usually allow for more time to travel to the ballpark. Fans also don’t have to rush home to get to sleep before the next work day. Fridays and the rare Sunday night game are the odd exceptions as they have a time crunch on one side of the trip, but not the other.

While they don’t have the largest local population, the San Francisco Giants are doing a great job getting local residents to the ballpark. Fans show up, and they show up every day. (Yes, there are articles disputing exactly how many tickets are actually sold.)

The Tampa Bay Rays, on the other hand, will continue to struggle with attendance as long as they have less than 1 million fans living within 30 minutes of Tropicana Field. This is one of clearest reasons for a move to downtown Tampa, where the Tampa Bay Lightning see weekday/weekend attendance differences of approximately 5%. A move to the center of their market could vastly increase the pool of fans within 30 minutes of a Rays game. Or barring a new stadium in a new location, the Rays could build homes, apartments, and condos in an attempt to surround Tropicana Field with at least one million new neighbors.


Looking at Attendance after Aces are Dealt

As baseball season and the summer months heat up, so too do the trade rumors. Almost every year, baseball media and fans postulate and prognosticate who might be traded before the annual trading deadline.

This year, the big fish on the market is Rays left-hander David Price. With only one year left on his contract, it is unlikely the Rays can afford to keep the former Cy Young Award Winner. But with the team winning eight in a row and 19 of their last 24, trading their ace doesn’t seem like a sure deal anymore. Most recent reports say the Rays management will wait until the absolute last minute to make a decision on if, where, and for whom the popular lefty will be traded.

With the Rays’ status with regards to popularity and market, some of the talk in regards to trading David Price has wound into the realm of attendance. The Rays are currently last in the Major Leagues in attendance, and some are concerned attendance could drop even lower if they traded their best pitcher. There are those who think Rays fans would consider the trade a message from ownership to wait until next year. And if that’s the message, why not wait until next year to buy a ticket?

To estimate how Rays attendance might react to a possible trade of David Price, I looked at 12 prior trades of ace pitchers over the last 37 years. Via Baseball-Reference.com, I looked at attendance before and after each trade. I also looked at winning percentage before and after.

My goal is to see if two maxims hold true:

  1. Attendance goes up when teams win and goes down when teams lose.
  2. A team that trades its best pitcher will have a worse record after the trade.

Hence, if attendance is attached to winning and ace pitchers are attached to winning, attendance should drop after ace pitchers are traded.

Is this really the case? Or is attendance in some cities more sensitive to major trades than others?

Let’s begin by looking at the granddaddy of superstar pitcher trades: the Tom Seaver trade. On June 15, 1977, after a slight tiff with ownership, the Mets shipped the franchise’s first ace to the Reds for Steve Henderson, Pete Flynn, Pat Zachary, and Dan Norman. The Mets were bad before but worse after and attendance followed suit.

Twelve years later, in 1989, two aces were traded during the season. On May 25th, the Mariners moved ace Mark Langston to the Expos for a bevy of prospects headlined by future ace Randy Johnson. Mariners fans reduced their attendance by nearly the same amount Mets fans did in 1977. Although playing .500 baseball prior to the trade, the Mariners winning percentage dropped significantly after the trade.

Two months after the Langston trade, the Minnesota Twins traded 1988 Cy Young Award winner Frank Viola to the Mets for Rick Aguilera, Kevin Tapani, and three other pitchers. The Twins were two games under .500 at the time of the trade, and then played .500 after the trade. Despite their slight improvement, attendance dropped 12.95% after the Viola trade.

We fast-forward to 1998 and another Mariners trade. During the 1998 season, the Mariners dealt the aforementioned Johnson to the Astros for Freddy Garcia, Carlos Guillen, and John Halama. While Johnson immediately did well in Houston, the Mariners played better after his departure, going 28-25 after the trade. Like the 1988 Twins, however, the positive play did not lead to an increase in attendance, as the average per game attendance went down after the trade.

Our next trade is the Bartolo Colon trade in 2002. On June 27, 2002, the Indians shipped Colon and Tim Drew to the Expos for Cliff Lee, Grady Sizemore, Brandon Phillips, and Lee Stevens. The Indians played .467 baseball before the trade and a lesser .447 clip following the deal. Attendance, however, jumped after the trade, up 10.04% over the team’s final 45 games.

We look at Cleveland again in 2008, when the Indians moved CC Sabathia to the Milwaukee Brewers for Michael Brantley, Matt LaPorta, and three other players. After trading Sabathia, the Brewers vastly improved their record, finishing the season 44-30. Attendance also went up after the Sabathia trade, from 25,964 to 27,766 per game, an increase of 6.94%.

The 2009 season saw the trade of three high profile pitchers. Two were legitimate aces, and the other a former ace that might give us insight to a Rays attendance prediction.

The first major pitcher trade in 2009 again involved the Indians. On July 29th, the Tribe shipped Cliff Lee and Ben Francisco to Philadelphia for Jason Knapp, Carlos Carrasco, Jason Donald and Lou Marson. Unlike the Colon or Sabathia trades, following the Lee trade, the Indians winning percentage and attendance per game both decreased.

Two days after the Indians traded Lee, the San Diego Padres moved right-hander Jake Peavy to the Chicago White Sox for Clayton Richard and three other players. Like the Twins in 1989 and the Mariners in 1998, the Padres played better after moving their ace, finishing the remaining 59 games with a 34-25 record. Unfortunately, also like the ’89 Twins and ’98 Mariners, less fans came out to see their now-winning team.

Our final pitcher trade of 2009 occurred on August 29th, when the Rays moved former ace Scott Kazmir to the Angels for Sean Rodriguez, Alex Torres, and Matthew Sweeney. Kazmir was no longer the Rays ace in 2009, handling over the title to James Shields and the up-and-coming David Price. But Kazmir still had name value in the Tampa Bay area, despite his decreased effectiveness.

After trading Kazmir, the Rays stumbled to a 15-20 finish. They went from being 4.5 games out of the wildcard to finishing 11 games out of the playoffs. Per game attendance following the Kazmir trade also dropped considerably, from 24,169 per game to 19,574 per game. This attendance decrease of 19.01% is the biggest drop of any of our surveyed trades.

The next year, two of our most frequent subjects collided when the Mariners traded Cliff Lee. After signing with Seattle in the offseason, Lee was sent to the Rangers for the stretch run. After the trade, the Mariners, who had played .400 baseball prior to trading Lee, finished the season with a .350 winning percentage and saw attendance drop 4.99% over the last 39 home games.

In 2012, the Brewers were on the dealing side when they sent Zack Grienke to the Angels for Jean Segura and two other players. While the Brewers were 10 games under .500 before the trade, they reversed fortune after the deal, going 39-25, a .609 clip. Attendance also increased after moving Grienke, albeit by 124 fans per game, or only 0.3%.

In our final trade, we look at the Chicago Cubs. Prior to trading Matt Garza on July 22, 2013, the Cubs were 10 games under .500 and averaging exactly 33,000 fans per game. After trading Garza, the Cubs dropped to 30 games under .500 and lost 919 fans per game in the seats, a 2.78% decrease.

There are many other trades and fanbases I could have looked at (the Ubaldo Jimmenez trade in 2011 comes to mind), but this small sample set gives a wide spectrum of possible outcomes resulting from trading an ace pitcher. From what we looked at, we found:

  • 50% of the data set decreased in both record and attendance
  • 25% increased in record and decreased in attendance
  • 16% increased in both record and attendance after trading their ace
  • 8% decreased in record but increased in attendance

The Indians are particularly interesting, seeing a different outcomes each time they traded an ace. The Mariners saw an attendance drop after both the Langston and Johnson trades but played better after trading Johnson and worse after moving Langston. Perhaps Langston had a bigger effect on the team in 1989 than Johnson did in 1998.

So what would happen if the Rays traded David Price? Given their current winning streak and the attendance sensitivity seen after the Kazmir trade, my initial estimate would have them in the same category as the 1989 Twins, 2009 Padres, and 1998 Mariners – an improved winning percentages but lower attendance. An better record post-trade might not be difficult considering the beginning of the Rays season was a disaster marred by injured players who are slowly returning (Alex Cobb, Jeremy Hellickson, David DeJesus, and possibly Wil Myers).

But with the Rays struggling to fill seats, moving fan favorite David Price might be a bad public relations move. From the studies I have done, games David Price has pitched in have drawn 6% more than average. That could be because Joe Maddon sometimes aligns the rotation so Price faces prime opponents such as the Yankees and Red Sox, teams that traditionally draw well at Tropicana Field. But some of Price’s “bump” could be the allure of seeing one of the best pitchers in the American League.

My estimate is the Rays would suffer an initial attendance drop if they traded David Price. Games against the Red Sox and Yankees (especially Jeter’s last series in Tampa Bay) will continue to do well. Bobbleheads and other promotions will also do well (expect a good turnout for the Don Zimmer sno-globe). And if the team plays well enough to contend, attendance may recover, but even then, the Rays won’t average over 20,000 per game.

Then again, doubtful they would draw 20K on average even with David Price in the rotation.