Author Archive

Chad Kuhl Is Throwing Heat

Note: stats are as of morning June 27th.

Generally speaking, a slash line (ERA/FIP/xFIP/SIERA) of 5.58/4.28/4.77/4.80 isn’t very encouraging. These are the numbers that Pirates starter Chad Kuhl has put up to date this season through 69.1 innings. Last year, he threw 70.2 MLB innings, so we have comparable sample sizes. Yet, he seemingly hasn’t improved upon last year’s numbers. Yes, the strikeouts are up, from a 17.6% K-rate to a 19% this year. However, the walk rate is also up (6.6% to 9%), the ground balls are down (44.3% to 41.8%), and the home-run rate has risen accordingly (0.89 HR/9 to 1.04). What, you may be wondering, do I see in this guy?

Check out his plate discipline stats.

Season O-Swing% Z-Swing% Swing% O-Contact%
2016 26.40% 68.80% 45.00% 65.70%
2017 30.50% 65.90% 46.40% 57.40%
Season Z-Contact% Contact% Zone% F-Strike% SwStr%
2016 87.50% 80.30% 43.90% 57.10% 8.90%
2017 85.30% 75.20% 45.00% 59.40% 11.40%

Improvements across the board. His chase rate has gone up while his in-zone swing rate has gone down. Hitters are making far less contact on pitches out of the zone, and even a bit less on pitches within the zone. This explains the increase in strikeouts. The walks shouldn’t be increasing, unless hitters are really going much deeper into counts, since they are making less contact. Nonetheless, this should change if Kuhl keeps things the same, because he’s throwing in the zone more often and getting more swings outside of the zone. Of the 118 pitchers who have thrown at least 60 innings this year, Kuhl’s chase rate ranks 43rd, his in-zone swing rate is tied for 48th lowest, his Z-Swing minus O-Swing ranks 37th, and most impressive, his swinging-strike rate is tied for 26th. In fact, his swinging-strike rate is the same as Yu Darvish — he even has a higher chase rate than him (30.5% and 29.3%), and Darvish has a superb 26.9% strikeout rate. The underlying statistics are optimistic, so if Kuhl keeps pitching this way, the strikeouts will increase and the walks will decrease. The bigger question is, what is the driving force behind these improvements?

According to PITCHf/x data on FanGraphs, Kuhl’s average four-seam fastball velocity has jumped from 93 last year to 95.5 this year, touching 99. Contrary to what his name might suggest, Chad Kuhl is throwing heat. In fact, all of his pitches have seen an increase in velocity (and he’s added a curveball, but he’s only thrown 38 of them and they have been largely ineffective):

Season Pitch minVel maxVel Vel
2016 SI 83.3 96.5 92.7
2016 SL 81.6 89.5 86.6
2016 FA 87.4 96.1 93
2016 CH 81.6 88.3 85.1
2017 SI 88.6 99.5 94.1
2017 FA 90.2 99.4 95.5
2017 SL 77.2 91.8 88.5
2017 CH 81.7 90.7 88
2017 CU 79.7 86.4 82.7

The velocity increase has given Kuhl more confidence in his four-seamer, and his usage of the pitch has risen to 29% this year, up from a mere 10% last year. This explains part of why the ground-ball rate is dropping — the uptick in four-seamer usage has caused a drop in sinker usage (down from 57% last year to 37% this year).

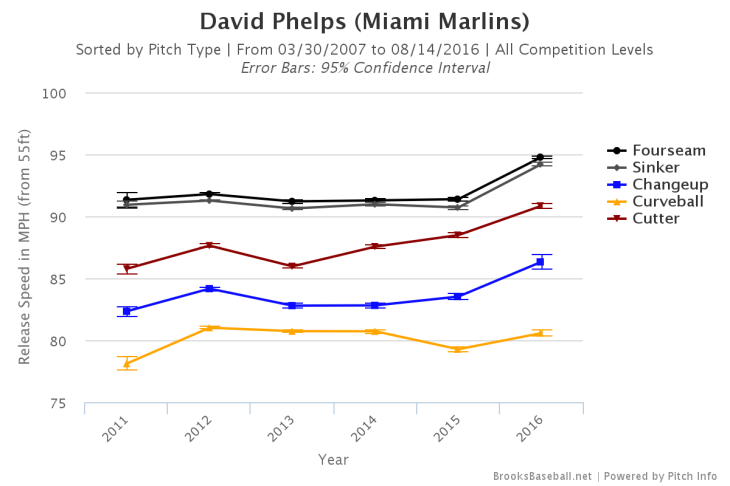
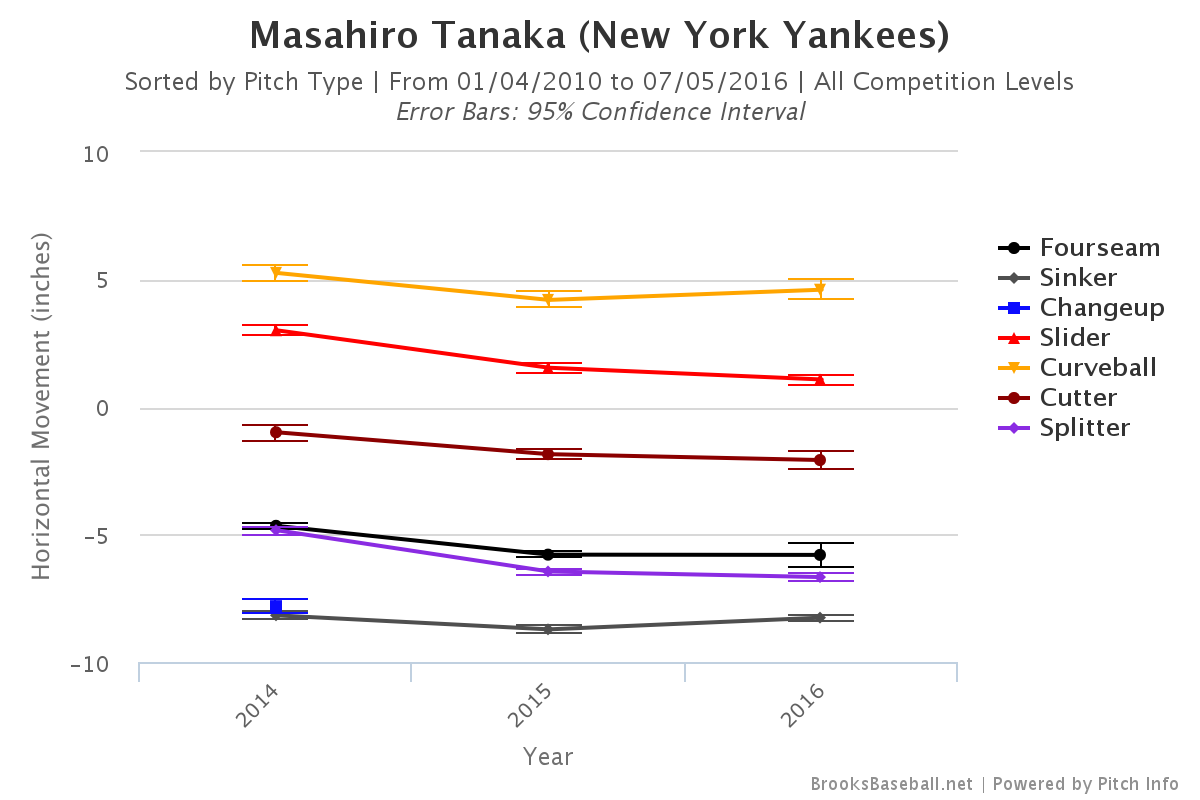
In addition, while his sinker has seen an increase in arm-side run (1.6 inches more), the ground-ball rate is also dropping because the sinker has seen a decrease in drop (1.1 inches less). While the drop on his sinker has decreased, the rise on his four-seamer has increased. It is now above average, ranking 52nd out of the 118 pitchers who have thrown at least 60 innings as of morning June 27th. This is in part due to a slight change in vertical release point:

Brooksbaseball-Chart-16.png

This year, Kuhl is throwing more over the top with all of his pitches. This graph shows that, for his sinker, he is on average releasing the ball about two inches higher. Now, Pitch Info (which powers this graph) says that Kuhl doesn’t throw a four-seamer at all, only sinkers, as opposed to PITCHf/x. Either way, at this point, Kuhl’s “sinkers” don’t sink very much. Using Pitch Info’s data, Kuhl’s sinker has the eighth-worst drop among the 87 starters who have thrown at least 200 sinkers this year. In that same group, the ground-ball rate on Kuhl’s sinker is also eighth-worst. Coincidence? I think not. His overall ground-ball rate of 41.8% this year is below average, ranking 78th-lowest of the 118 pitchers who have thrown at least 60 innings this year.

All of his pitches are generating more whiffs, looking at both Pitch Info and PITCHf/x. This is probably due to the improved velocity. Using Pitch Info’s data, his slider ranks 15th in whiffs per swing out of the 87 starters who have thrown 100 sliders this year (not to mention, it ranks 10th in average velocity), and his sinker ranks 17th out of the 87 starters who have thrown 200 sinkers this year. However, his changeup still gets whiffs at a below-average rate: it ranks 71st out of the 92 starters who have thrown 100 changeups this year. Although the changeup has gotten more run this year, it too has lost vertical drop and the velocity gap between it and the fastball has closed a bit. Generally, changeups are used to sit down batters of the opposite handedness, because they have arm-side run. Kuhl, a righty, has struggled against lefties this year, as they have a .445 wOBA against him, while righties have a mere .286 wOBA. At the same time though, he has gotten more strikeouts against lefties (30) than righties (29), despite having faced fewer lefties (147) than righties (163). Also, I’m not too worried that Kuhl will have struggles against lefties in the long run because his sinker has great arm-side run.

The fact that Kuhl has a diminished ability to get ground balls doesn’t bode well for his old skill set, where he relied on his control and inducing weak contact, but with an increased penchant for strikeouts, backed by improving velocity, it shouldn’t matter that much. I would still take a flyer on him; the strikeouts, walks, and platoon splits should improve, along with his ERA.

Data from FanGraphs, Brooks Baseball, and Baseball Prospectus. Picture from MLB.com. Thanks for reading!


Has Tyler Flowers Finally Blossomed?

As expected, it was mostly a miserable season for the rebuilding Atlanta Braves. The team struggled mightily, especially on offense. The Braves scored the second-fewest runs in baseball. They owned an 86 wRC+, third-lowest in the MLB. In fact, they only had two hitters with a wRC+ of 100 or higher. The first is unsurprisingly Freddie Freeman, who sat at a sterling 153 wRC+. In second, there is a modest surprise: it’s Tyler Flowers, who sat at a 111 wRC+.

Rebuilding teams generally strut out their top prospects regularly, but they also play high-upside guys they signed off of the scrap heap. Flowers fits the latter description. Although he was drafted in the 33rd round, he raked in his first three professional seasons:

Season Team G PA HR SB BB% K% ISO BABIP AVG OBP SLG wOBA wRC+
2006 Braves(R) 34 150 5 0 10.70% 20.00% 0.186 0.326 0.279 0.373 0.465 0.389 135
2007 Braves(A) 106 445 12 3 11.00% 16.60% 0.190 0.339 0.298 0.378 0.488 0.387 133
2008 Braves(A+) 122 520 17 8 18.80% 19.60% 0.206 0.342 0.288 0.427 0.494 0.415 154

His first full season in 2007 produced an awesome 133 wRC+ and led to Flowers’ first prospect ranking. Baseball America named him the Braves 12th-best prospect after that year. He didn’t get another chance to be ranked in the Braves system after 2008 though, because he was traded right after the season ended. He headlined a package of prospects that went to the White Sox for Javier Vazquez and reliever Boone Logan. Vazquez went on to pitch 219.1 innings with a 2.87 ERA that season for the Braves, and Boone Logan would go on to become a pretty solid lefty specialist (although he wasn’t effective for the Braves).

The other prospects in the deal (Jonathan Gilmore, Brent Lillibridge, and Santos Rodriguez) were not as highly regarded as Flowers. Soon after the deal was completed, the post-2008 season prospect rankings were released by Baseball America. Flowers was ranked the fourth-best prospect in the White Sox system and the 99th-best prospect in the majors. Lillibridge came in at eighth in the organization, Rodriguez came in at 18th, and Gilmore came in at 21st.

The other prospects would go on to become non-factors. Gilmore and Santos have never reached the majors. Lillibridge has a 60 wRC+ in 784 MLB PAs and a negative defensive value, netting him a career WAR of -1.7.

Meanwhile, Flowers steadily climbed up the organizational ladder. His first season with the White Sox was great in Double and Triple-A:

Season Team G PA HR SB BB% K% ISO BABIP AVG OBP SLG wOBA wRC+
2009 White Sox (AA) 77 317 13 3 18.00% 24.00% 0.246 0.383 0.302 0.445 0.548 0.444 177
2009 White Sox (AAA) 31 119 2 0 8.40% 26.90% 0.152 0.394 0.286 0.364 0.438 0.363 126

That year, he even earned a September call-up. After the season, BA ranked him as the White Sox No. 2 prospect and 60th overall, and FanGraphs ranked him as the White Sox’s best. Unfortunately, in his next season, Flowers only managed a 108 wRC+ in Triple-A in 412 PAs. His strikeout rate escalated to 29.4%. Still only 25, he improved in his next season, garnering a 148 wRC+ in 270 Triple-A PAs (although his strikeout rate was a staggering 31.1%). This warranted Flowers’ first extended look in the majors. He was given over 100 PAs in each of the next five seasons, but he could never quite reach his potential. He showed power at times, with a .199 ISO in 282 PAs in his first two years, boosted by 12 homers. However, with a walk rate below 6% in the next three seasons, coupled with a K-rate of over 30% in two of those three seasons, Flowers could never get on base at a solid clip. To make matters worse, his power bottomed out. His ISO shrank to .118 last year in 361 PAs. Here are his offensive numbers on the White Sox overall:

PA H 2B 3B HR R RBI SB CS BB% K% ISO BABIP AVG OBP SLG wOBA wRC+
1360 279 50 2 46 119 142 2 5 6.30% 33.20% 0.155 0.311 0.225 0.288 0.380 0.295 84

So, despite tallying 27.3 defensive runs above average (according to FanGraphs) in his first five seasons, the White Sox non-tendered Flowers after 2015 because of his poor offensive output. The Braves (again!) scooped him up for a mere $5.3 million guaranteed over two years. That gamble seems to have paid off, because Flowers had his best offensive season in the majors this year. In 325 PAs, his walk rate is back up to 9%, above league average and his second-best in a season. His strikeout rate is down to its lowest ever, at 28%. His ISO, though still below league average, is up 33 points. His BABIP has skyrocketed, at .364, the highest of his career. All of this has led to a .270/.357/.420 triple slash, with a .338 wOBA and a 110 wRC+. What’s going on? Had Flowers made any changes? Is he finally going to reach his potential? Let’s find out.

First, let’s take a look at Flowers’ plate discipline. His O-Swing%, at 27.2%, is his lowest since 2011. That puts him in a tie for 79th-lowest out of the 266 hitters with at least 300 PAs this year. His below-average O-Swing% paired nicely with an above-average Z-Swing% (67.9%). He has the 63rd (out of the 266 hitters) best differential in those two categories (O-Swing minus Z-Swing). Basically, Flowers has been laying off of balls and swinging at strikes.

Possibly because he was swinging at better pitches, Flowers made much more contact. His swinging-strike rate (percentage of swings and misses against all pitches he has seen) dropped to 11.6%, easily the lowest of his career. His contact rate (percentage of contact against all swings) rose to 74.6%, a career best as well. While these two marks are still below average, they represent a significant improvement for Flowers.

Better selection seems to have led to better contact quality for Flowers. This year, he posted easily the lowest Soft% (13%) and highest Hard% (44.3%) contact percentages of his career. Using the sample of 266 hitters from earlier, Flowers tied for the 17th-lowest Soft%, and he had the fourth-highest (!) Hard% (just above teammate Freddie Freeman!). Statcast agrees wholeheartedly that Flowers improved his contact quality. He had the fifth-highest (!) average exit velocity among the 272 hitters with at least 170 batted-ball events this season. He added 3.2 MPH to his average exit velocity since last year. Statcast also says that Flowers tied for the fifth-highest (!) estimated swing speed out of the 294 hitters with at least 150 batted-ball events this year. In addition, he also dropped his popup rate (IFFB%) by more than 50% from last year. Lastly, his Pull% dropped a ton this year. He tied for the 38th-lowest Pull% among the sample of 266 hitters from earlier. Since he doesn’t pull many grounders, it’s harder to shift on him. Therefore, he’ll get more base hits on grounders. These improvements make it look like Flowers can maintain a high BABIP.

While these are all good developments, part of his improving plate discipline may just be because Flowers saw his lowest percentage of pitches in the zone since 2011 (45.8%), so it was easier for him to take more walks. In addition, many of these improvements are so much better than anything Flowers has ever done in the majors, so I’m guessing some regression is in order, especially in these areas:

O-Swing% Contact% SwStr% Soft% Hard% IFFB% Pull%
2016 27.2% 74.6% 11.6% 13.0% 44.3% 5.3% 34.9%
Career 31.0% 69.2% 15.1% 18.6% 33.1% 10.5% 41.8%

Another knock on Flowers: generally, exit velocity leads to more power, but most of the good numbers for Flowers there have come from his exit velocity on grounders, which won’t lead to more power. He had the third-highest average exit velo on grounders, but only the 26th-highest on fly balls plus line drives. However, 26th out of 272 is still good.

Despite the high average exit velocity, Flowers had the 19th-highest rate out of 272 in terms of barrel hits/batted-ball events (which is still good, but not quite as good as the other exit-velo leaders). This is another reason why Flowers may have a lower-than-expected power output.

Overall, there were definitely some encouraging signs from Flowers this year. He was more disciplined and he made more and better contact. His power should improve if he keeps hitting the ball hard and swinging at good pitches. In addition, although he had a negative Defensive Runs Added this year for the first time, his framing has improved tremendously in the last couple of years. He saved over 13 runs this year (fourth-best in the majors) after saving over 22 last year (second-best).

Flowers’ success in the minors supports his success this year somewhat, but then again, this is his first above-average offensive season in the majors (in six tries), and he’s not getting any younger (he’s 30). Furthermore, since BABIP is volatile, even for hitters with great contact quality like Flowers, it will be hard for him to be consistently good, unless his power improves (which it probably should) and he maintains his strides in plate discipline. He’ll probably be given enough at-bats for us to find out, given the Braves’ level of terribleness and his defensive prowess.

Data is from FanGraphs, Baseball America, StatCorner, and Baseball Savant.

Thanks for reading!


Can Dan Straily Keep Beating BABIP?

As a former prospect struggling to find his footing in the majors, Dan Straily wasn’t given an extended look in a big-league rotation after 2013. He bounced around from the A’s to the Cubs to the Astros. Now he’s on the rebuilding Reds. With the Reds, he has finally gotten another shot. The Reds were looking for someone with any kind of upside to fill the hole in their rotation. Straily fit the bill. 154 innings later, Straily is running an insanely low .239 BABIP, the third-lowest among qualified starting pitchers. That has helped him to a solid 3.92 ERA, which was at 3.50 before a recent blowup against the Angels. Before then, however, he had managed 10 starts in a row without allowing more than three runs. Can Straily keep running a BABIP this low? Let’s find out.

The first thing that sticks out to me about Straily is that he’s an extreme fly-ball pitcher. He has the third-lowest groundball percentage and the eighth-highest fly-ball percentage among qualified starters. He also has allowed the 11th-highest average launch angle on batted balls out of the 92 pitchers who have thrown at least 2000 pitches this year. Ground balls go for hits far more often than do fly balls (although fly balls go for extra-base hits far more often), so that explains part of why Straily has such a low BABIP.

If you’re like me, you would have thought that since Straily gets a lot of fly balls, maybe he gets a lot of popups. That would certainly help him keep a low BABIP, as popups almost never go for hits. Although Straily’s fastball has good rise (he’s tied for 27th out of the 78 qualified starters who throw four-seamers), he doesn’t actually generate many popups. In fact, his IFFB% of 7.9% this year puts him firmly below the league average of 9.7%. While his career IFFB% is at 11.8%, that doesn’t help explain why he’s run such a low BABIP this year specifically. Let’s look elsewhere.

Does he do a good job of limiting quality contact? He has allowed the 39th-highest exit velocity out of the 92 pitchers who have thrown at least 2000 pitches this year. That’s below average. He’s also below average in terms of hard-hit rate: he has the 30th-highest out of the 81 qualified pitchers. Worse, he’s tied for the seventh-lowest soft-hit rate. His line-drive rate is worse than average, the 32nd-worst out of 81. These are some troubling signs.

On the other hand, there is some good news. Straily has a nasty changeup. Observe:

DanStraily_original.gif

Of the 73 qualified pitchers who throw a changeup, Straily’s is tied for the sixth-most drop. That’s not surprising, especially when you consider this: there are 133 pitchers who have thrown at least 150 changeups this year, and Straily’s has the fifth-lowest average spin rate. A low spin rate allows gravity to do its job and make that sucker drop right off the table.

Straily has a nice slider, too. It’s a frisbee, with solid horizontal movement and decent drop, without sacrificing too much velocity. Observe:

giphy.gif

I don’t think that Straily will maintain a .239 BABIP. Although his extreme fly-ball tendencies seemingly make it easier for him to maintain a lower BABIP, he doesn’t do enough things right otherwise. He allows too much quality contact. On the other hand, he has three solid pitches, which are also his three most-used pitches (his sinker and curve aren’t great, and he uses them accordingly). His four-seamer has good rise, and, despite mediocre velocity, that can work. Just look at what Marco Estrada is doing with a four-seamer that has good rise and averages a mere 88 MPH.

Straily’s change and slider have above-average swinging-strike rates, at 15.8% and 14.5%, respectively. The change and slider even have average groundball rates (44.9% and 46.7%). They both have lofty O-Swing percentages as well, which leads me to believe their swinging-strike rates are for real (45.5% and 38.8%). My advice for Straily would be to stop pitching to contact. He seems to be pitching to contact because his Zone% this year is at 46.9%, the highest of his career. That mark ties him for 20th-highest among the 81 qualified starters. It is far above the league average of 44.8%. So, he should stop pitching to contact because 1) he has strikeout potential and it would be worth trying to tap into it and 2) his luck with BABIP will probably run out soon.

Data from FanGraphs and Baseball Savant. Gifs courtesy of Bleacher Report and MLB.com.

Thanks for reading!


DJ Lema-Who?

The Rockies tend to have hitters with eye-popping stats as a byproduct of playing in Coors Field. This year alone, they have four players with an ISO of .219 or higher (five if you include recent call-up David Dahl). But, on the other side of the offensive equation, there’s only one Rockies player this year who has an OBP over .400. That man is their starting second baseman, DJ LeMahieu.

I noticed that LeMahieu had an above-average .358 OBP last year, but I was ready to dismiss him because he ran an insane .362 BABIP and his walk rate was merely average at 8.1%. Was he really hitting the ball well enough to sustain such a figure? To find out, I looked over a data set of the 253 hitters with at least 200 batted ball events in 2015. LeMahieu had an average exit velocity of 90.6 MPH that year. The average of the group was about 88.9. To put that number in context, LeMahieu had the 60th-hardest exit velocity of the 253. Yes, that number is well above average, but the second-hardest hitter on the list (David Ortiz) only ran a BABIP of .280. To control for the Coors effect, consider this: LeMahieu’s teammate, Nolan Arenado, had an average exit velocity of 91.7, but only ran a .287 BABIP last year. So, LeMahieu’s numbers didn’t appear to be so special, and if his BABIP fell off, there wouldn’t be much left: as I mentioned, his plate discipline was ordinary. In addition, he certainly did not hit for power. He only had a .087 ISO last year, well below the league average of .150. Things didn’t look good for his power behind the scenes either, as his average launch angle was a mere 4.1 degrees; the average for my sample was 10.8. That figure was bad enough for the 244th-highest launch angle out of the 253 hitters in the sample.

So, I wrote off LeMahieu. Boy, was I wrong to do so. This year, his ISO is hovering around league average at .154. His BABIP is an even more insane .383. He’s improved his walk rate to 10.8%, well above league average. He’s also lowered his strikeout rate from 17.3% to 12.9%. This is a huge step for a non-prospect in his age-28 season. What the heck happened?!

For starters, his exit velocity and his launch angle have both improved tremendously. I took a new data set for this year, expanded to include all hitters with at least 150 batted ball events (since the year isn’t quite over yet). There were 255 hitters in the sample. This year, LeMahieu has an improved average exit velocity, at 93.1, which is good enough for 16th out of the 255 hitters in the sample. The average is around 89.4. The average for this group is up 0.5 MPH from my other group, but LeMahieu went up 2.5!

In regards to launch angles, LeMahieu is now at a much improved 5.7 degrees. The new average for this group is around 11.7. So, the group average is 0.9 higher than the other group, but LeMahieu is 1.6 higher! It’s also worth mentioning that in his excellent article published earlier, Andrew Perpetua listed LeMahieu as having the second-lowest percentage (for hitters with at least 300 PAs) of poorly-hit balls. He also had LeMahieu’s xOBA at .388, which is right near his actual wOBA of .391. Lastly, his soft/medium/hard-contact percentages last year (if you prefer this data to exit velocity) were 12.1/61.3/26.6. This year, the soft rate has remained relatively the same, but the medium rate has lost some to the hard. Here’s his contact-quality triple slash: 12.5/51.9/35.6. So, this year LeMahieu’s performance is really not looking fluky. However, one question remains unanswered: what changes did he undergo in order to make this transformation happen?

I think the answer lies in his improving plate discipline. Take a look at the changes across the board from last year to this year:

Season O-Swing% Z-Swing% Swing% O-Contact% Z-Contact% Contact% Zone% F-Strike% SwStr%
2015 24.8% 63.5% 43.4% 72.5% 90.6% 85.2% 48.0% 58.7% 6.4%
2016 23.9% 61.3% 42.0% 78.2% 95.6% 90.5% 48.4% 59.8% 4.0%
Career 28.9% 65.7% 46.6% 73.7% 92.3% 86.3% 48.2% 62.0% 6.3%

His O-Swing percentage has improved tremendously the last two years, and is down another 0.9% this year. His Z-Swing% has dropped as well, and though that isn’t a good thing per se, it does illustrate that LeMahieu is implementing a more selective approach at the plate, maybe not swinging at borderline strikes as much. He’s also making a lot more contact – probably because he’s swinging at better pitches, swinging at fewer borderline strikes and fewer balls. The improved contact rate and improved eye has led to a career-best 12.9% strikeout rate and 10.8% walk rate.

In conclusion, I would like to congratulate our friend DJ on proving me wrong. He has earned a lofty BABIP (though his true talent is probably not quite .383, because almost no one’s is). He has made tremendous strides with his batting eye, and that has helped lead to much-improved contact quality and in turn, more power and base hits.

Data is from Baseball Savant and FanGraphs.

Thanks for reading!


The Domination of the Other Phelps

Coming off a season in which he pitched to a 4.50 ERA mostly out of the starting rotation with only 6.19 strikeouts per nine innings, the Marlins decided it was time for a change for David Phelps. They moved Phelps to the bullpen full-time to begin this year, and he was on his way to becoming a relief ace before the Marlins sent him back to the rotation. In 50 relief appearances before joining the rotation, Phelps averaged a whopping 11.43 whiffs per nine (69 strikeouts in 54.1 innings!). Since joining the rotation, Phelps has nine whiffs in 9.1 innings. It will be interesting to see if he can keep this up in the rotation (a la Danny Duffy), because the main culprit for this increase in strikeouts is a surge in fastball velocity:

Brooksbaseball-Chart-3

It’s a classic case of a pitcher’s stuff playing up in a move to the bullpen. Before this year, Phelps never even averaged 92 on the heater. Now, he’s close to 95. I’m hopeful that he’ll maintain this velocity surge because of what Danny Duffy has done this year. Last year, Duffy averaged around 94.5 on his heater and a mere 6.72 K/9. This year, he’s up to around 96 and 10 in those two categories, respectively, despite being shuttled to and from the bullpen his entire career (just like Phelps). There were plenty of concerns that Duffy’s stuff wouldn’t last in a move from the bullpen this year, but I think his 16-strikeout performance on August 1st quelled the last of those concerns.

Alas, a hard fastball isn’t enough to make a great pitcher, as the Yankees realized when they included David Phelps as a throw-in for Nathan Eovaldi. Now, they’re actually of a similar level of skill. Phelps’ four-seamer has decent arm-side movement, but Eovaldi’s has more. Both of their four-seamers generate close to a 20% pop-up rate, which is really good (average for a pitcher’s full arsenal is around 9.6%). Phelps’ four-seamer’s whiff rate has gone up: it was never higher than 9% (a mere 5.6% last year), but this year it’s nearly 13% (Eovaldi’s is at around 7.8% this year).

Here’s what Phelps has that Eovaldi doesn’t have: decent secondary stuff. Phelps’ second-most-frequent offering is his sinker, which has the eighth-best horizontal movement for sinkers of pitchers with at least 60 innings this year (according to FanGraphs). The whiff rate is up to its highest point ever (although only near 6%). He throws it hard, as it’s averaging over 94 this season. The GB% has never actually been good, but it’s up over 50% this year for the first time. The kicker is this: his sinker has allowed an incredibly low ISO this year (0.036). Who knows if the newfound power-suppressing/added groundball-getting ability will continue for the pitch, but even if it doesn’t, sinkers and four-seamers usually work really well together. This is part of how Phelps distances himself from Eovaldi — Eovaldi has no sinker!

Phelps also has a solid curve, which is generating its best whiff rate since his rookie year, at 11.3% this year. This year, it also has the most vertical drop and cutting action away from righties of his career. Of the 191 pitchers who have thrown at least 100 curveballs this year (sample from Baseball Savant), Phelps’ deuce has the 28th-highest spin rate (2616 revolutions per minute), well above that group’s average of about 2243. And boy, does that thing get grounders. Its average launch angle this year is -7.0! That’s good enough for the third-lowest among my curveballer sample. Brooks Baseball has its GB% at nearly 77% this year, and it has only dipped below 60% one season in his career.

His other pitch of note is a cutter/slider thing (he also has a change, but he’s only thrown it 14 times this year). It has good rise. It doesn’t get too many whiffs, but it’s at its highest whiff rate since his rookie year (close to 9%). The ISO against it has only gone above .100 one year, and is solid this year at .090. It gives him a bit of a new velocity band, as it has usually come in around 91 this year. It also gives him a different kind of movement from his other fastballs (FF=four-seamer, FT=sinker, FC/SL=cutter/slider thing, KC=curve, CH=changeup):

4754792016030120160813AAAAAmovement.png

The bottom line is this: Phelps has always had decent secondary stuff, but before this year, his fastball kind of sucked. Everything plays off of the fastball well, so as his fastball has improved, his secondary stuff has improved too. If Phelps can maintain this added velocity, I see a bright future for him.

Data from FanGraphs, Brooks Baseball, Baseball Savant, and Texas Leaguers. If you have a moment, read the awesome article that I linked from The Hardball Times: http://www.hardballtimes.com/pitch-sequencing/

Thanks for reading!


Tomlin Has a 3.81 ERA? You Must Be Joshing!

The Indians have an awesome starting rotation. They’re fifth in the MLB (first in the superior-hitting American League) with a 3.95 SIERA, seventh in ERA with a 3.96. They obviously have a solid top three in Carlos Carrasco, Corey Kluber, and Danny Salazar. Beyond them, the emergence of Trevor Bauer has grabbed headlines. But what about that last spot in the rotation? It is being held down, and held down steadily, by one Josh Tomlin. And he isn’t dragging down the staff’s ERA like most number 4s and 5s. In fact, he’s actually improved the ERA of the staff with a solid 3.81 ERA. However, he’s only averaged 6.39 K’s per nine innings, far below the league average for starting pitchers this year (7.72). He certainly doesn’t have overwhelming stuff. How has he been able to succeed?

Tomlin has impeccable command. He’s walking 1.15 guys per nine innings, in line with his career (1.45). He’s third in the MLB in K/BB ratio (first in AL). He’s 13th in first-pitch-strike percentage. He dots the corner with his main secondary offerings, a curve and a cutter, throwing them down and away to righties and down and in to lefties. He’s done this throughout his career:


And he’s continued to do so this year:


He owns that low and outside corner! Spotting his pitches on the corners has likely helped Tomlin to induce a solid Z-Swing percentage of 62.7% (according to FanGraphs plate-discipline data), which is 10th-lowest in the MLB this year. This means that Tomlin has been good at getting called strikes. He pairs this skill nicely with a 33.6% O-Swing percentage, which is the 11th-highest in the MLB this year. This means that Tomlin has been good at getting hitters to swing at pitches outside of the zone (pitches they usually can’t drive). This has been a skill for Tomlin throughout his career (33.2% O-Swing during his career).

In addition, he has a career BABIP of .274 (league average is around .295 every year). He has improved on that mark this year, allowing a .268 BABIP. This isn’t entirely surprising, given the high O-Swing percentage: If you swing at pitches outside of the strike zone, it’s much harder to make solid contact. Also of note is the fact that Tomlin’s Z-Swing percentage has really improved for him this year (66.3% career versus 62.7% this year).

What’s the driving force behind the improvement in these two plate-discipline stats? Tomlin’s cutter and curve offer a good explanation. According to PITCHf/x data on FanGraphs, Tomlin’s cutter has the 15th-best “rise” among qualified pitchers this year. It also has the eighth-most horizontal movement, darting away from righties and in to lefties. What’s more, the cutter has induced a 42.7% O-Swing percentage across his entire career. That number has held strong this year at a 44.5% clip. He’s decided to uptick the usage on the pitch this year to a career high, while throwing his four-seamer at a career-low rate.

Year

Four-seam%

Sinker%

Cutter%

Curve%

Change%

2010

36.45

13.51

29.28

10.34

10.43

2011

37.87

6.07

30.83

14.62

10.60

2012

33.55

4.57

35.54

13.59

12.63

2013

44.44

0.00

33.33

11.11

11.11

2014

45.06

2.01

30.81

14.96

7.16

2015

53.38

0.00

27.43

12.97

6.22

2016

31.07

5.68

40.97

14.94

7.34

The curve is the driving force behind the low Z-Swing percentage: This year, the pitch has a crazy low percentage of 44.7%. While that is lower than his career percentage on the pitch,  the curve is generating excellent vertical drop this year (15th-best in the MLB), and I wouldn’t be surprised to see him maintain a low percentage.

Tomlin isn’t flashy. He doesn’t pile up strikeouts. He doesn’t throw very hard. But, he spots the ball tremendously well and appears to have good contact management skills. Two pieces to the puzzle are his low Z-Swing percentage (fueled by the curve) and high O-Swing percentage (fueled by the cutter and its uptick in usage).

Data courtesy of FanGraphs and Brooks Baseball. Thanks for reading!


Masahiro Tanaka and Homers and Strikeouts

The Yankees have been a beacon of mediocrity this year, currently sitting under .500 and in fourth place in the resurgent AL East. Pitching is often a soft spot for the Yankees, as Yankee Stadium routinely ranks in the top half of the league in terms of worst parks for pitchers, according to park factors on FanGraphs. The short porch in right field is especially troublesome for hurlers. For this reason, park factors on FanGraphs have listed Yankee Stadium (tied with others) as the easiest park for a lefty to hit a homer from 2013-2015. Thus, there are bound to be some interesting trends among their starters. One such starter is the always entertaining Masahiro Tanaka. Let’s explore!

Tanaka struggled mightily with the longball during his first two seasons with the Yankees, posting a 1.24 HR/9 ratio from 2014-2015, which would have been good (or bad) enough for the eighth-highest among starters, had he qualified. That includes a ridiculous 1.46 HR/9 from last year, which would have ranked sixth (a few spots behind teammate CC Sabathia, who ranked third with 1.51 HR/9). At the same time, that high HR/9 may have been because Tanaka was victimized by a 15.7% HR/FB ratio during those two seasons. Since Tanaka is a righty (opposing teams are more likely to play lefties against him) who pitches half of his games at Yankee Stadium (lefty heaven), his HR/FB ratio is bound to be high, but not that high. Thus, it’s understandable that his HR/FB ratio decreased to a more normal 9.5% this year. It will probably be higher than that in the future, but this is just the ebb and flow of things: sometimes stats are higher than they should be, and sometimes they are lower.

Tanaka actually allowed a palatable 0.99 HR/9 in his first season with the Yanks, despite a 14.0% HR/FB ratio. His groundball rate remained virtually the same from that first season to the second, but one thing that made his home-run total lower in his first season as opposed to the second (other than a slight uptick in HR/FB) was a 9.3 K/9. When you allow fewer balls in play, you will allow fewer homers. However, in Tanaka’s second season, that number sunk to 8.1 K/9, a substantial drop. It has dropped even further this season, considerably below league average now at 7.1 K/9. What has brought about this dip in Ks? Changes in velocity often coincide with changes in K-rate:

Year Fourseam Sinker Change Slider Curve Cutter Split
2014 92.74 91.44 87.49 83.97 74.41 89.26 87.27
2015 92.76 91.69 0.00 84.42 77.08 89.73 88.04
2016 92.63 90.63 0.00 84.86 75.91 88.53 86.93

Interesting. His velocity has remained quite stable throughout his time with the Yankees (if you look year to year). Let’s look elsewhere. Another determining factor for K-rate is movement. Here is Tanaka’s horizontal movement over the years.

Brooksbaseball-Chart (2).png

Year Fourseam Sinker Change Slider Curve Cutter Split
2014 -4.66 -8.17 -7.81 3.01 5.26 -0.99 -4.83
2015 -5.79 -8.72 0.00 1.54 4.20 -1.85 -6.45
2016 -5.80 -8.26 0.00 1.08 4.60 -2.08 -6.67

His slider, cutter, and curve have lost a bit of that typical movement away from righties, but at the same time, the four-seam and split have improved their arm-side run, inside to righties. The sinker has pretty much held steady. How about vertical movement?

Brooksbaseball-Chart (4).png

Year Fourseam Sinker Change Slider Curve Cutter Split
2014 9.37 5.52 4.33 1.38 -6.34 5.50 1.63
2015 9.56 5.98 0.00 2.03 -4.18 6.45 2.21
2016 9.94 5.74 0.00 3.47 -4.58 6.53 2.74

All of his pitches are dropping less/rising more, which is good for the four-seamer and cutter, but not so good for everything else. There are some good and some bad movement trends, but nothing that I would think would completely evaporate Tanaka’s strikeouts. There has to be something else. Has Tanaka’s whiff rate changed at all?

Brooksbaseball-Chart (6).png

Year Fourseam Sinker Change Slider Curve Cutter Split
2014 5.16 5.91 0.00 16.39 5.26 13.82 29.13
2015 5.66 4.02 0.00 16.70 4.05 8.63 20.62
2016 6.00 4.51 0.00 18.85 5.13 12.39 17.11

Indeed it has. The splitter has seen a sharp drop in swinging strike rate. Why is this happening? Did Tanaka change something? Let’s see if his pitch mix has any answers.

Brooksbaseball-Chart (5).png

Year Fourseam Sinker Cutter Curve Slider Change Split
2014 21.34 19.49 6.16 5.71 21.39 0.10 25.80
2015 18.64 13.62 10.75 7.30 22.23 0.00 27.41
2016 3.07 34.01 6.94 4.79 25.72 0.00 25.48

Woah! Tanaka has completely scrapped his four-seamer in favor of his sinker. Everything else has remained relatively stable. Here’s where we come full circle — back to the homers. I have a feeling that his reasoning for this change was that he wanted to improve his groundball rate in order to allow fewer home runs. Sure, the groundball rate has improved a little (up 3.4% in since last year), but this pitch swap seems to be the biggest reason I can think of for the sharp decrease in swinging-strike rate for Tanaka’s splitter. My theory is that his four-seamer, a relatively straight, hard pitch with a bit of rise, can help set up the splitter better than the sinker. The sinker and splitter are almost the same pitch; the split has a bit more drop, a bit more run, and is a bit slower. The velocity difference and movement difference between the splitter and four-seamer is much more drastic than those differences between the sinker and the split.

So, Tanaka seems to have traded some strikeouts for a few more groundballs/fewer homers. I’m not sure I like this change; his HR/FB rate was bound to normalize anyway. However, one thing I certainly like from Tanaka this year is that he has stayed off the DL. An asterisk has been over his name on draft day since the UCL injury a couple of summers ago. Despite staying off of the DL this year, people have been pointing to his better record on extra rest as a sign of fatigue. In 10 starts on extra rest this year, Tanaka has a 1.72 ERA, versus a 5.28 ERA in seven starts on regular rest. However, this has never been a noticeable split before this year, and it’s also worth noting that seven of those 10 starts have come away from Yankee Stadium, which I have deemed a bad park for Tanaka to pitch in.

Graphs and tables are from Brooks Baseball.


A (Robbie) Ray of Hope for the D-Backs?

At this moment, the Arizona Diamondbacks, those same Diamondbacks who went into “win now mode” this offseason, currently sit in fourth place in the NL West division. A few weeks ago, Dave Cameron wrote an excellent article about what direction the D-Backs can go from here. The D-Backs’ pitching has specifically underwhelmed this year. However, one starter on their roster stands out to me, one who was not much more than an afterthought on their staff at the beginning of this year. That man is Robbie Ray.  He has a 10.4 K/9! That’s good enough for ninth in the majors among qualified starting pitchers — ahead of Madison Bumgarner, David Price, and Jake Arrieta (to name a few). He struck out eight guys in five innings his last time out. But, his ERA sits at an unimpressive 4.59. What’s up with Robbie Ray? Let’s take a look.

Let’s start with his four-seam fastball. Its velocity has risen each season since he first came up in 2014. He’s topped out at 97.6 this year — great for a lefty. He averages 93.6 on the heater, which is harder than all other qualified lefties this season. Its swinging-strike rate has gone from 7.1% last year to 8.3% this year — a very high SwStr% for a fastball. The pitch even has a bit of arm-side run and added backspin, giving it a “rising” appearance. He throws his fastball 59.6% of the time (third-highest in the majors), and for good reason.

His slider is solid. Hitters are managing a meager .570 OPS against it. It has an 18.4% SwStr%, up 0.3% from last year. Here is a wonderful gif of Ray striking Andrew McCutchen with the slider. And him striking out McCutchen again. Not to mention, the pitch is generating a whopping 68% groundball rate this season.

So both the fastball and slider are solid pitches. But here is where Ray runs into some trouble: his two-seamer is mediocre and his changeup is awful.

He throws the two-seamer hard, and consequentially, it has less movement than average. It has slightly more movement than his four-seamer, but otherwise, it’s just a slower version of the four-seamer with much less “rise”. Last year, it did generate a solid 54% GB%, but this year, that number has dropped to 45%. Hitters are mashing it to the tune of a .962 OPS this season, though last year they only managed a .729 OPS in a similar sample size. That being said, the SwStr% of the pitch has jumped from 6.1% last year to 7.1% this year, probably because his improved fastball and slider help to set it up better.

The changeup is awful: hitters currently have a 1.437 OPS against it this year. But, last year, hitters only had a .662 OPS in a similar sample size. He has trouble commanding this pitch, especially: he throws it for a strike only 53% of the time. However, there is some good news: the SwStr% has almost doubled, going from 4.6% to 8.5%.

Having examined Ray’s repertoire, I have a couple of predictive theories. Firstly, his HR/FB ratio is an exceedingly high 16.7%. This is well above the league average and his career rate of 10.9%. According to park factors on ESPN and FanGraphs, Chase Field is at least in the top five in terms of worst parks for pitchers, so that could explain some of this. He also over-performed with a 7.3% HR/FB rate last year, and maybe this is just regression coming in. Either way, I think that this rate should certainly improve through the rest of the season, settling in closer to his career average rather than 16.7%. Unsurprisingly, the changeup is the main culprit here; it has a 100% (!) HR/FB rate. This should almost certainly regress, which would bring his “OPS against” on the changeup back down.

Something else of note is that the changeup and two-seam fastball are weapons primarily deployed against batters of the opposite handedness, as they would move away from the batter. Since these are Ray’s two poorest pitches, it makes sense that he struggles to get right-handed batters out. They have a .875 OPS against him, compared to the meager .590 OPS that lefties manage. The changeup and/or two-seamer need to improve for Ray to start getting right-handers out. These two pitches have been hit hard, and have thus helped to make Ray’s BABIP climb up to .350. The BABIP against his changeup is .476, and against his two-seamer it’s .421.

One last thing that should not be discarded is that Ray’s walk rate has risen this year. Poor command of his pitches has resulted in him leaving a few meatballs over the plate. The fact that he only throws his changeup for a strike 53% of the time is specifically a major detriment to his control; the rest of his pitches are at least at 60% or higher.

So, Ray’s HR/FB rate should at least regress a bit, and I think that he can get his ERA under 4 for this reason alone. Roll with the Steamer projections for the rest of his season over ZiPS, but keep in mind neither projection system knows everything of Ray’s velocity increase and improved SwStr%, so it’s entirely possible that he can do even better, maybe even sustaining a 10 K/9, especially if he can improve his command and work on his changeup and two-seam. To sum it all up, the SwStr% has improved on all of Ray’s pitches, and there’s room for improvement yet; he’s only 24 years old.