Beware the Shark!

After spending the first four years of his career primarily in the bullpen, Jeff Samardzija became a full-time starting pitcher in 2012. In his first two years as a starting pitcher, Samardzija was worth 2.8 and 2.6 WAR, but he bumped that up to 4.1 WAR last year in the best season of his career.

Jeff Samardzija, first two years as a starter (combined)

Season Team IP ERA FIP xFIP WHIP K% BB% HR/FB BABIP GB% LOB%
12 – ’13 Cubs 388.3 4.10 3.67 3.42 1.29 24.1% 8.2% 13.1% 0.306 46.6% 72.2%


Jeff Samardzija, 2014 season

Season Team IP ERA FIP xFIP WHIP K% BB% HR/FB BABIP GB% LOB%
14 2 Teams 219.7 2.99 3.20 3.07 1.07 23.0% 4.9% 10.6% 0.283 50.2% 73.2%


Considering just the years he’s spent as a starting pitcher, in 2014 Samardzija set career bests in innings pitched, ERA, FIP, xFIP, WHIP, BB%, HR/FB%, BABIP, and GB%. When a player takes a step forward like this, there’s always the question of how sustainable this step forward is.

With Samardzija, it’s important to break down his 2014 season between the time he spent with the Chicago Cubs and the time he spent with the Oakland A’s.

Season Team IP ERA FIP xFIP WHIP K% BB% HR/FB BABIP GB% LOB%
2014 Cubs 108.0 2.83 3.10 3.19 1.20 22.9% 6.9% 8.5% 0.305 52.5% 72.9%
2014 Athletics 111.7 3.14 3.30 2.96 0.93 23.0% 2.8% 12.3% 0.262 47.9% 73.5%


The two statistics that stand out most are Samardzija’s BB% and BABIP in his time with the A’s. Samardzija made his last start with the Cubs on June 28th, 2014. At that point, he had a 6.9% BB% and .305 BABIP. His BB% was a career best and his BABIP was almost a perfect match for the BABIP allowed by the Cub’s team during the entire 2014 season (.304).

After the trade to Oakland, Samardzija’s BB% plummeted from 6.9% with the Cubs to 2.8% with the A’s and his BABIP also dropped significantly, from .305 to .262. Samardzija’s BABIP with Oakland was even better than Oakland’s team BABIP during the 2014 season (.272).

So, is this much-improved walk rate over a half-season of starts sustainable? Considering that before coming to Oakland, Samardzija had pitched 496 1/3 innings as a starter over the previous two-and-a-half years with a walk rate of 7.9%, I would say it’s not. He had a good stretch of 16 starts with a much lower walk rate than his career average, but it’s unlikely that he can sustain that low walk rate going into 2015.

Then there’s the issue of his superlative BABIP with the Oakland A’s. Again, through 496 1/3 innings pitched as a starter in the two-and-a-half-years before coming to Oakland, Samardzija had allowed a BABIP of .306. With Oakland, it dropped to .262. As mentioned above, Oakland’s team BABIP was .272 last year, so that drop for Samardzija is not surprising given that he was pitching in front of a better defense. Now that Samardzija is with the White Sox, he won’t have such a good defense behind him. The White Sox allowed a .306 BABIP last year and were in the bottom tier of all teams in baseball defensively. Since then, they’ve added Adam LaRoche, Melky Cabrera, and Emilio Bonifacio. LaRoche and Cabrera have not been good defenders over the last two years, while Bonifacio was good last year but not notably good in previous years. The bottom line is that it doesn’t look like the White Sox defense will do Samardzija any favors in 2015.

So, what should we expect from Samardzija in 2015?

Mike Podhorzer has written about the difference in ballparks as Samardzija moves from the O.co Coliseum in Oakland to US Cellular in Chicago. The takeaway is that the Cell could help Samardzija pick up a few more strikeouts at the expense of more walks and more homers allowed. Here are the strikeout, walk, and home run park factors for Wrigley, O.co, and US Cellular:


  K PF BB PF HR BF
Wrigley 101 102 101
O.co 99 101 92
US Cellular 102 107 111


In his three years as a starting pitcher in more pitcher-friendly ballparks, Samardzija has a strikeout rate of 23.7%, a walk rate of 7%, and a HR/FB% of 12.2%. To project Samardzija for 2015, we could slightly increase his strikeout rate, up his walk rate by a bit more, and his home run rate by even more, and factor in regression as Samardzija turns 30 years old. The following chart shows Samardzija’s numbers over the last three seasons, along with the average for those three seasons and what I would project for Samardzija in 2015.


Season Team IP K% BB% HR/FB BABIP
2012 Cubs 174.7 24.9% 7.8% 12.8% .296
2013 Cubs 213.7 23.4% 8.5% 13.3% .314
2014 2 Teams 219.7 23.0% 4.9% 10.6% .283
12-14 Average 202.7 23.7% 7.0% 12.2% .298
2015 My Projection 210.0 23.2% 7.3% 13.1% .305


To projection Samardzija’s stats for 2015, I used the formula for FIP and plugged in expected strikeouts walks and home runs, based on my projections above. This produced a FIP for Samardzija of 3.71. In his career as a starter, Samardzija’s FIP has been about 0.20 lower than his actual ERA. Last year, the White Sox team FIP was 0.20 lower than their team ERA. With this in mind, I bumped up my projection for Samardzija’s ERA to 3.80.

For WHIP, I used the walk rate I projected above and a .305 BABIP to come up with hits allowed and project a 1.26 WHIP for Samardzija in 2015. Here is a chart with my projection, along with projections from Steamer, ZiPS, and the FanGraphs Fans:

Source IP SO ERA WHIP K/9 BB/9 HR/9
My Projection 210 202 3.80 1.26 8.6 2.7 1.1
Steamer 192 178 3.93 1.24 8.3 2.6 1.0
ZiPS 194 197 3.90 1.23 9.1 2.4 1.1
FanGraphs Fans (15) 213 200 3.35 1.18 8.5 2.2 1.1


The Fans are more optimistic in their projection for Samardzija’s innings, ERA, and WHIP. I’m more optimistic than Steamer and the FanGraphs Fans that Samardzija will strike out a few more batters, but I also expect him to walk more and have a higher WHIP. Samardzija was the 22nd starting pitcher drafted in the recent FanGraphs Early Mock Draft, taken ahead of Masahiro Tanaka, Jake Arrieta, Hisashi Iwakuma, and Hyun-Jin Ryu, among others. I will definitely be moving Samardzija down my draft sheets a bit.


Replacing Replacement Value in Fantasy Auctions

With the baseball season rapidly approaching and recent posts by FanGraphs authors converting projected statistics into auction values, I thought I would share my approach towards valuation I have used in a long-standing A.L. league with 12 teams, 23 player rosters selected through auction (C, C, 1B, 3B, CI, 2B, SS, MI, 5 OF, 1 DH), a $260 budget, a 17-player reserve snake draft and the ability to keep up to 15 players from one year to the next, an attribute that inflates the value of the remaining pool and can further distort disparate talent across positions and categories.

We have traditionally used a 4×4 format, and while I have persuaded my co-owners to switch to a 5×5 for the coming year, what follows is my process for a 4×4 league.

There was a distant time when I was a whiz at math but my utter lack of a work ethic for advanced math collided with university-level calculus and I crumbled as surely as a weak-kneed lefty facing Randy Johnson. So my understanding of some key statistical processes is compromised. And by some I mean most.

But what I lack in math I hope I make up in approach:

(1) For categories over multiple years in this league, teams finish in a standard bell-shaped curve, with two or three teams well ahead, two or three well behind and six to eight clumped more closely together.

(2) In a 12-team league, a third-place finish in a category bets you 10 points. Across eight categories, averaging a third-place finish gets you 80 points, which is enough points to win out league between 80% and 90% of the time.

(3) Given both (1) and (2), my goal is to finish in third in every category, because doing do will far more often than not win my league, and because that target is a comfortable space above the pack in the middle, creating a margin for error within which I can still secure a win.

(4) I calculate what totals I need for each category to finish third based upon the specific history of our league, giving greater weight to more recent and relevant trends.

(5) I calculate the totals needed to finish dead middle in the pack for each category, again based upon the specific history of our league, giving greater weight to more recent and relevant trends.

(6) The difference between the third-place totals and the median totals become my spread, in a sense, the yardstick against which I then measure all projected player performance.

(7) I don’t weight pitchers and hitters evenly because my league does not – the marketplace of my league places significantly less value on pitchers, spending between $70 and $100 on them, and I adjust values to account for that. Perhaps that is also justified by either greater volatility or more injuries for pitchers. In any case, I divide the total value for hitters by 14 and for pitchers by 9 to come up with the average value for hitters or pitchers.

(8) I calculate what each of 14 hitters and 9 pitchers would need to contribute per player for each category for both the top and the bottom of the spread.

(9) For each category, I divide the median production per player by the difference in the gap to find the incremental value of each unit of production.

(10) For each player and for each category, I start with the median value of median production for all four categories, than add or subtract the incremental value depending upon if their projected production is above or below the median.

(11) I do the same for keepers to calculate inflation value, then list both the value and inflated value next to each player, broken down by position, so I can track both availability and the ebb and flow of inflation in real time.

(12) Finally, my league is mostly inelastic except for dumping trades. That means it is not easy to trade surplus categories for deficit categories. So I create a running tally of my projected production, starting with my keepers and adding players I gain in the auction with the goal or at least reaching each of the target levels needed for projected third-places finished in each category.

(13) I don’t adjust assigned value based on the position played but of course I consider position as I bid in order to reach my targets in an inelastic league. I may deliberately pay somewhat more than inflation cost for a good player if the likely alternatives is paying over inflation value for a poor player and being left with more money to spend then there is talent to spend it on. I do so knowing my keepers will produce to much surplus value that I can win simply getting players close to inflation value.

At least in my league, my projected values, adjusted for inflation, are pretty close to the mark notwithstanding the outliers that will come in any marketplace, both for individual players and for more systemic biases (my league overpays for closers, for example). I don’t win every year, but when I fall short, it is not because my valuations were off but because of too many failures in projecting specific players.

Is there a statistical basis for tossing replacement value as a baseline for creating auction values or statistical benefit to instead using league-specific gaps between middling and winning teams? Frankly, I don’t know, however intuitive my system seems to me. But I’d welcome feedback on my approach, statistical arguments for and against it, and whether it warrants further exploration.


Complete Outfield Dimensions

I’ve been consistently dismayed at how metrics such as park factors could be calculated when it seems as if the fundamental data for calculating such metrics, the actual size and dimensions of MLB parks, is unknown.

Any diagram or database of park dimensions I’ve found usually has LF, CF, and RF distances measured along with distances from home plate to the power alleys. A typical diagram is the following one of Fenway Park where five “important” distances have been marked.

The locations of these markings, particularly the power alleys, is extremely inconsistent across the different ballparks. In some parks the power alleys are measured at LCF and RCF (22.5° from each foul line), in other parks it’s where there is a corner in the outfield fence, and in other parks it’s just somewhere. In the Fenway image it’s impossible to tell where exactly any of those markings are and what any of the distances are between them. In any case, these five data points, plus any other distance markings, are not enough to define the shape and size of a ballpark.

We should be able to point in any direction in a ballpark and know the exact distance to the fence. Guessing by examining the proximity to the closest marked spot is insufficient for any real analysis. In order to understand the properties of a ballpark, to, for example, determine the ideal defensive positioning of the outfielders, we need to be able to mathematically define the boundaries, i.e. the location of the outfield fence.

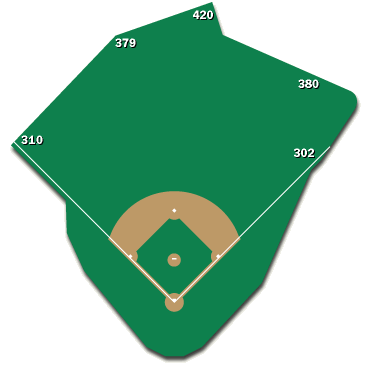
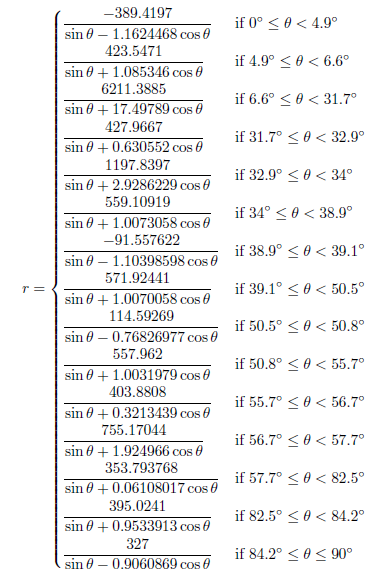
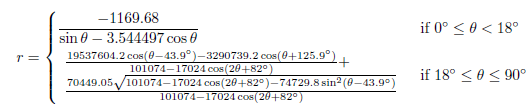
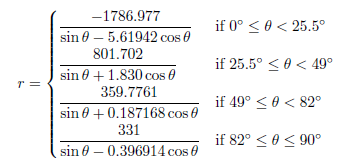
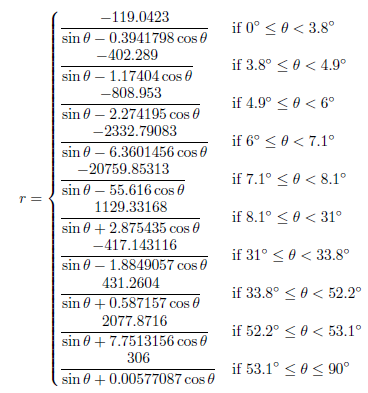
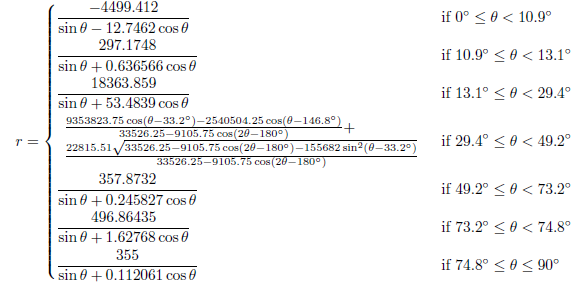
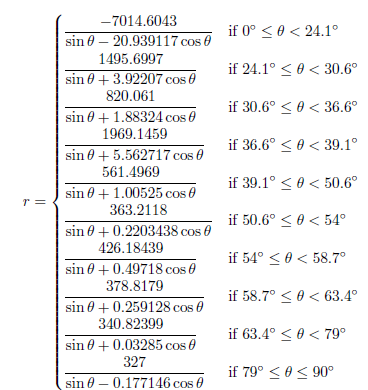
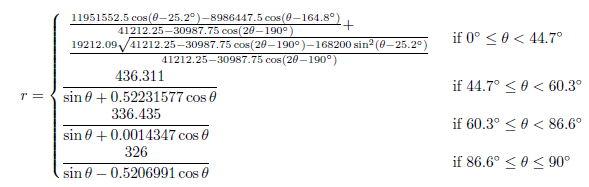
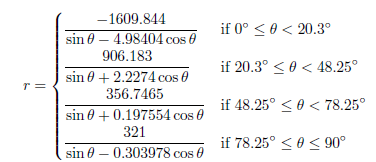
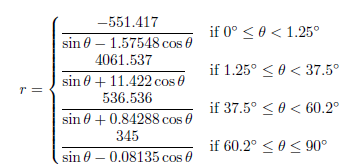
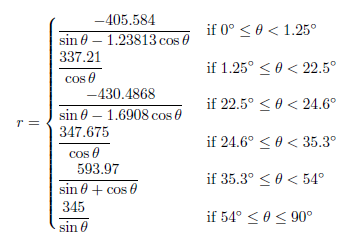
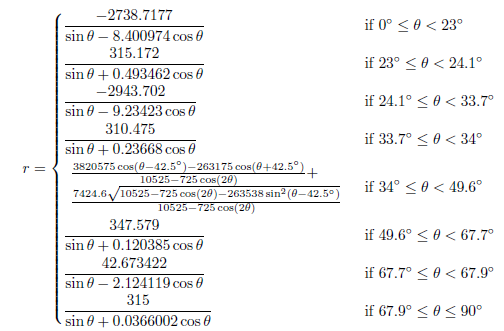
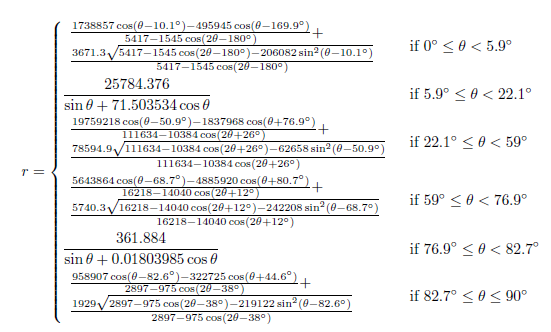
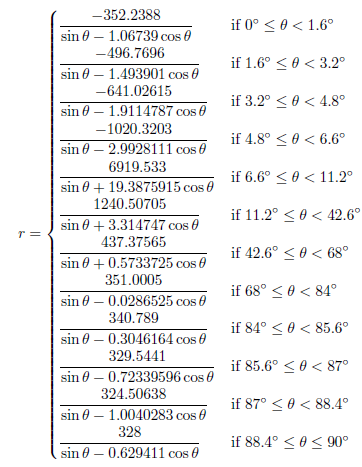
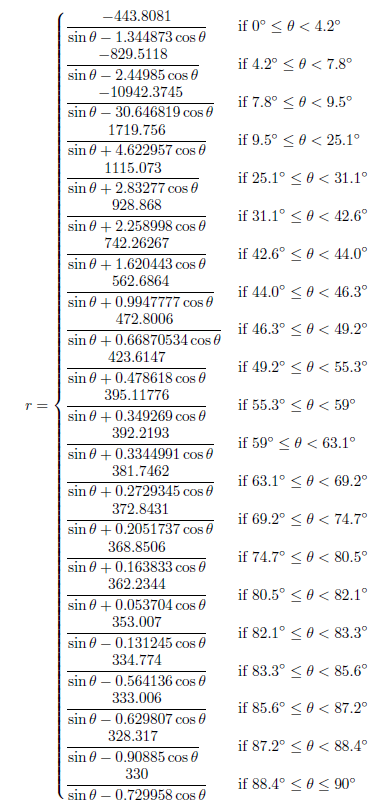
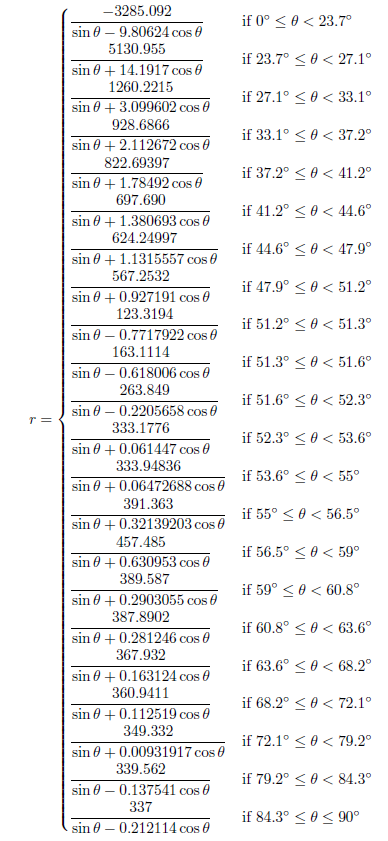
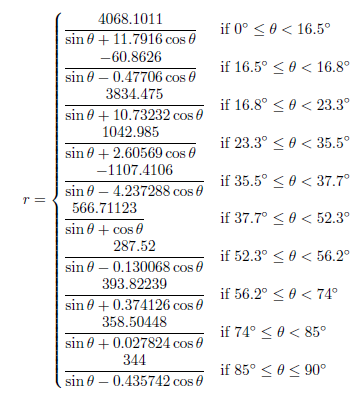
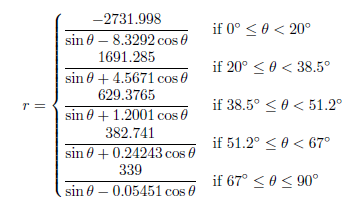
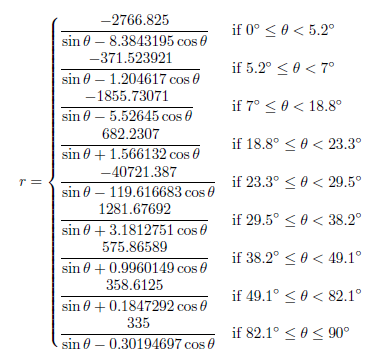
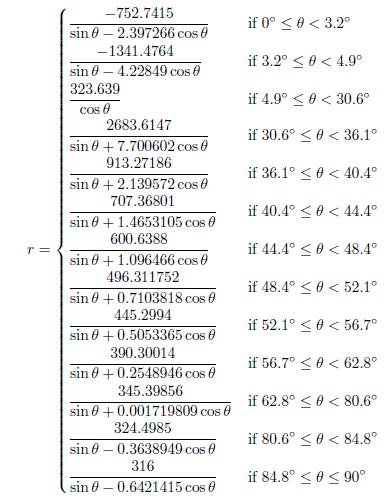
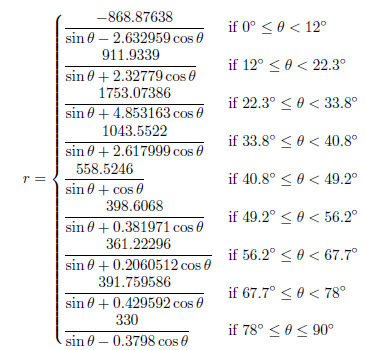
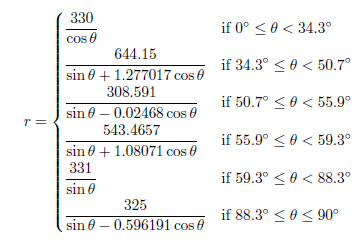
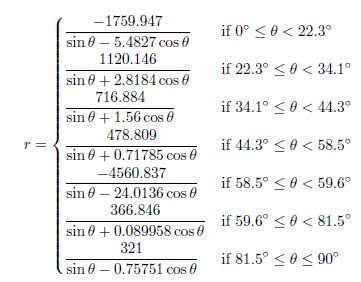
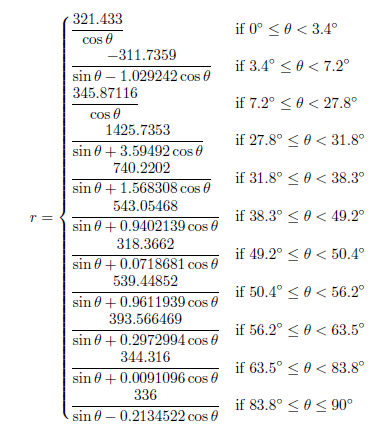
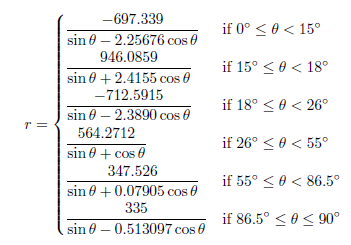
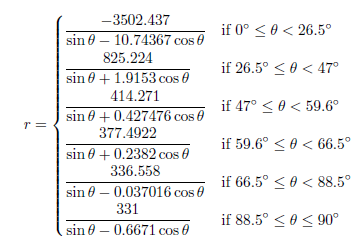
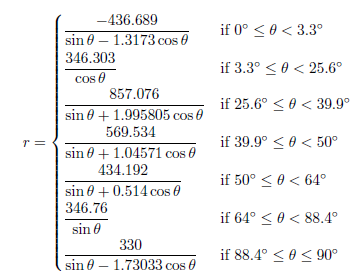
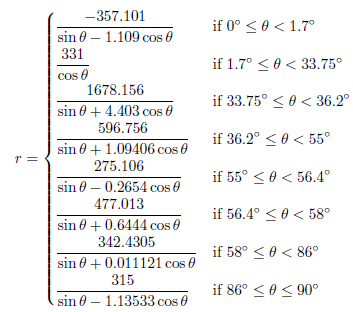
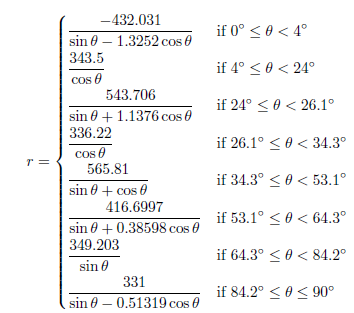
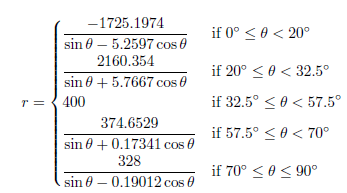
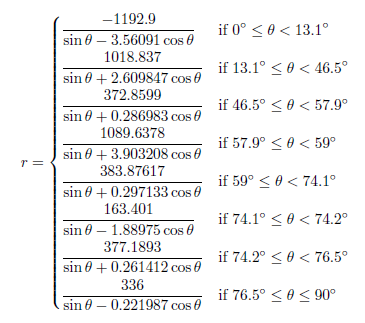
These mathematical formulas defining the outfield fences are exactly what this article presents. If you look to the bottom of this article you’ll see the 30 equations that define the major league outfield fence distances from home plate. The equations are given in polar coordinates in terms of the angle θ from the right field foul line (RF=0°, LF=90°). The resulting distance, r, is given in feet.

The equations are all piecewise functions, with breaks between the sub-functions whenever the outfield wall changes direction. The sub-functions are given by linear functions or ellipses (all mapped to polar coordinates) where appropriate. Some ballparks are more complicated than others and that’s generally reflected in the number of required sub-functions. Some of the functions may seem intimidating, however, I would intend that any analysis with these functions would be done by computer, which makes the number of sub-functions in each piecewise definition generally irrelevant once the equations have been coded.

These equations were determined by examining the diagrams at ESPN Home Run Tracker, as well as park dimension data from Wikipedia, Clem’s Baseball, MLB team pages, and any other park diagrams I could find. These sources were not always in agreement and I used my best judgment when these situations arose, however I would guess that the standard error of the fence distance for any angle for any park is only a couple feet. There are also often many more precision digits that appear in the equations than necessary. This is for two reasons. The first reason is that it helps avoid discontinuities when transitioning between the functions and the second reason is that sometimes I just wrote down a lot of digits.

As a simple exercise of what can be done with this type of data, I’ve calculated the areas of the outfields of all the different MLB parks, as well as the respective sizes of left, center, and right field. The results are shown in Table 1 (sortable by clicking any of the header items). As an arbitrary start point, I assumed the outfield started 150 feet away from home plate and that each field spans 30°. Many of these results match our intuition (Yankee Stadium RF is tiny, Comerica Park CF is huge), but we now have numbers assigned to that intuition that can be analyzed.

Table 1: Outfield Areas (x1000 ft2)
City Team Stadium OF LF CF RF
Arizona Diamondbacks Chase Field 94.1 28.7 36.2 29.2
Atlanta Braves Turner Field 94.1 29.2 35.3 29.6
Baltimore Orioles Oriole Park at Camden Yards 87.8 27.1 34.4 26.3
Boston Red Sox Fenway Park 83.5 21.1 32.8 29.6
Chicago Cubs Wrigley Field 89.7 26.8 34.1 28.8
Chicago White Sox U.S. Cellular Field 87.8 26.5 34.2 27.2
Cincinnati Reds Great American Ball Park 87.1 26.7 34.5 26.0
Cleveland Indians Progressive Field 85.6 25.8 33.2 26.6
Colorado Rockies Coors Field 97.3 30.2 38.3 28.8
Detroit Tigers Comerica Park 95.8 28.5 39.9 27.4
Houston Astros Minute Maid Park 88.6 23.2 38.8 26.6
Kansas City Royals Kauffman Stadium 97.9 30.4 36.9 30.5
Los Angeles Angels Angel Stadium 89.2 29.0 32.7 27.5
Los Angeles Dodgers Dodger Stadium 91.1 28.8 33.8 28.5
Miami Marlins Marlins Park 93.4 28.3 36.9 28.3
Milwaukee Brewers Miller Park 91.1 28.9 34.6 27.6
Minnesota Twins Target Field 90.4 28.0 35.8 26.6
New York Mets Citi Field 91.5 27.1 36.0 28.4
New York Yankees Yankee Stadium 87.6 27.7 35.6 24.2
Oakland Athletics O.co Coliseum 88.4 27.5 33.4 27.5
Philadelphia Phillies Citizens Bank Park 86.2 25.7 34.9 25.5
Pittsburgh Pirates PNC Park 90.2 29.8 33.9 26.5
San Diego Padres PETCO Park 90.8 27.9 35.0 27.8
San Francisco Giants AT&T Park 92.2 27.3 36.2 28.7
Seattle Mariners Safeco Field 87.8 27.2 34.2 26.4
St. Louis Cardinals Busch Stadium 91.1 28.6 34.1 28.4
Tampa Bay Rays Tropicana Field 89.6 27.4 36.5 25.7
Texas Rangers Globe Life Park in Arlington 92.7 28.9 36.1 27.7
Toronto Blue Jays Rogers Centre 91.8 27.9 35.9 27.9
Washington Nationals Nationals Park 88.8 28.2 32.8 27.8

The previous definition of the different fields could be modified or determined based on the intended purpose. For example, for determining the outfield positioning, the relative speed of each fielder would determine the area for which each fielder is responsible. With these equations, those values can be exactly calculated. Also, just because two fields have the same area, does not mean they are of equal difficulty to defend. The shape of the fence determines how accessible the different parts of the area are. Again though, with these equations these shapes and values can be determined.

These equations are limited though in that they only define the outfield in fair play. For further research and to more completely account for different stadiums, the distances from the plate to the fence for all 360° of rotation should be known. Foul territory is a much greater consideration in some parks than others.

And now, the equations.

Arizona Diamondbacks – Chase Field

Atlanta Braves – Turner Field

Baltimore Orioles – Oriole Park at Camden Yards

Boston Red Sox – Fenway Park

Chicago Cubs – Wrigley Field

Chicago White Sox – U.S. Cellular Field

Cincinnati Reds – Great American Ball Park

Cleveland Indians – Progressive Field

Colorado Rockies – Coors Field

Detroit Tigers – Comerica Park

Houston Astros – Minute Maid Park

Kansas City Royals – Kauffman Stadium

Los Angeles Angels – Angel Stadium

Los Angeles Dodgers – Dodger Stadium

Miami Marlins – Marlins Park

Milwaukee Brewers – Miller Park

Minnesota Twins – Target Field

New York Mets – Citi Field

New York Yankees – Yankee Stadium

Oakland Athletics – O.co Coliseum

Philadelphia Phillies – Citizens Bank Park

Pittsburgh Pirates – PNC Park

San Diego Padres – PETCO Park

San Francisco Giants – AT&T Park

Seattle Mariners – Safeco Field

St. Louis Cardinals – Busch Stadium

Tampa Bay Rays – Tropicana Field

Texas Rangers – Globe Life Park in Arlington

Toronto Blue Jays – Rogers Centre

Washington Nationals – Nationals Park


Fantasy: Three Undervalued Catchers

These three catchers are being woefully under-drafted in 2015 fantasy leagues:

Brian McCann

McCann was a trendy fantasy pick in 2014 as fantasy owners were feasting on his HR potential with the short right field porch of Yankee Stadium in play. He didn’t have a horrible season, finishing 7th among catchers in 5×5 fantasy leagues but he did underperform his draft position as many were expecting more from him.

As many players often do when switching leagues, McCann got off to a slow start, hitting just .239 with 10 HRs in 330 PAs. However, despite dealing with a foot injury that restricted him to 55 games in the second half of the season, McCann began to show off the power in his new venue. He reeled off 13 HRs in only 208 PAs the rest of the way.

Despite hitting for a lower average in the 2nd half, the underlying peripherals all look strong.

Split PAs SwStr% ISO HRs
1st Half 330 6.3% 0.138 10
2nd Half 208 5.1% 0.232 13

He’s being drafted as the 5th catcher off the board with an overall ADP of 108 in the highly competitive, high-stakes NFBC leagues. These are leagues that require two catchers so position scarcity is an important factor.

On the per-600-PA Steamer Projections, McCann is rated 2nd best catcher, and 69th best 5×5 hitter overall with a .251, 24 HR, 62 R, 70 RBI, 1 SB projection well ahead of the four catchers getting drafted in front of him Jonathan Lucroy (91st Steamer-600 5×5 hitter), Devin Mesoraco (112th), and Yan Gomes (117th).

The opportunity to use McCann as designated hitter – he got 13 starts at DH last year – helps ensure extra plate appearances over his NL counterparts. If he’s hitting, Girardi will keep his bat in the lineup anyway he can. He even managed to grab 11 starts at first base last year.

As the hype on McCann has cooled this year, it might be the right time to move in and take him.

Russell Martin

Martin has hit double digit home runs in 7 out of his 9 seasons in the big leagues and has also been a decent bet for a surprise half-dozen stolen bases. His move back to the American League also opens up some designated hitter opportunities.

His 2015 Steamer line of .242, 16 HR, 61 R, 59 RBI, 6 SB doesn’t quite stand to McCann’s projections, but based on where he’s getting drafted, Martin could end up providing more net value. The noise around him has been quiet as he’s the 11th catcher being taken, an absurd 171 ADP. Martin projects better 5×5 production than several guys being taken higher; Lucroy, Mesoraco, and Gomes just to name a few.

A key factor in his value this year will be a change in venue. Pittsburgh’s PNC Park is graded as the worst in the league for right-handed power. He will flip to the other end of the curve as Toronto’s Rogers Centre rates as the 4th best for right-handers to hit home runs in.

Fly ball distance has remained an impressive 292 feet for Martin over the last two seasons and at 31 he’s in the prime years for major league catchers. There is a lot to like here and Martin has a good chance at being a top-5 catcher this year.

Carlos Ruiz

Seeing a theme here? The old, boring catchers continue to slide down draft boards in favor of young upstarts who haven’t proven much yet.

Ruiz is being drafted as the 25th catcher, 341 ADP overall but he probably deserves consideration in the 15-20 range. In a two catcher league you could do a lot worse than adding this reliable veteran. Steamer expects him to out-produce Miguel Montero (15th C/207 Overall ADP), Derek Norris (17th/231), Dioner Navarro (19th/282), Tyler Flowers (20th/299), Jarrod Saltalamacchia (21st/302), John Jaso (22nd/309), and Kurt Suzuki (24th/328)

The key to Ruiz value is that he will churn out valuable batting average that few bottom-tier catchers can. Reliable plate appearances to accumulate the counting stats are also very important. At that point in the draft it’s often difficult to find catchers who can give you PA’s and a healthy batting average but Ruiz should do that this year. Over his 8 year career as a full-time catcher, Ruiz has average 411 PAs per season and showed no signs of slowing down last year with 445.

The key to Ruiz getting PAs is that the Phillies really have no youngsters to push him for playing time. As long as they are paying him, they are going to be playing him. The only interesting prospect you might want to handcuff him to is Tommy Joseph, who the Phillies acquired in the Hunter Pence trade a few years ago. However, Joseph is probably a late-season proposition at best.

A trade to another team is always a possibility, but Ruiz is still a good enough player that nobody is going to trade assets and pay his $8.5 million for him to sit on the bench.


Is Arrieta the Cubs’ True Ace?

So we all know the Cubs signed Jon Lester to a six-year, $155 million dollar contract this offseason. The Cubs presumably believe they will be competitive if not this season then the next, and therefore decided to get themselves an ace. This however bodes the question, is Jon Lester even the Cubs’ best pitcher going into 2015?

Last year proved to be a breakout year for right-hander Jake Arrieta. Arrieta was drafted in 2007 by the Baltimore Orioles and made his Major League debut in 2010. He spent a little over six years with the Orioles before he was traded to the Cubs in 2013. Arrieta posted good numbers in the minors, in fact in 2010, at Triple A he had a 1.85 ERA before getting the call to the Majors that same season. In the Majors, however it was a different story. From 2010-2013 Arrieta was downright awful, never pitching more than 119.1 innings in a season and never posting an ERA below 4.66, which he did in his rookie year.

2014, though, was different. Arrieta posted the best numbers of his career, finishing with a 2.53 ERA, a 2.26 FIP, and a 2.73 xFIP. He also recorded a career high in innings, netting 156.2 innings pitched. How was Arrieta able to this? A guy who had never had an ERA below 4.66 recorded a Cy Young-caliber season? He even might have had a shot at the Cy Young Award if he’d pitched more innings.

Well Arrieta essentially stopped walking hitters and started striking out a bunch of hitters. He posted the best K-BB% of his career at 20.5% and he also stopped giving up home runs at .29 HR/9. There are several ways a pitcher can become better; some of them create a new pitch, some of them make a mechanical adjustment, and some just sequence their pitches better. I think in Arrieta’s case it comes down to sequencing and maybe mechanical although I have no way of truly knowing whether the latter is true or not.

Here is an example of the type of pitches Arrieta threw from 2010-2013 according to Brooks Baseball.

2010-2013 Fourseam Sinker Slider Curve Change
LHH 27% 33% 9% 19% 13%
RHH 32% 31% 24% 11% 1%


Here is Arrieta’s sequencing in 2014.

2014 Fourseam Sinker Slider Curve Change
LHH 19% 24% 26% 21% 10%
RHH 21% 31% 32% 14% 1%


Two elements really stand out to me through these tables. The first is that Arrieta has not added a killer new pitch. The second is that Arrieta is throwing a lot less four-seam fastballs and a lot more sliders, especially to left-handed hitters. He’s also increased his curveball usage. Arrieta essentially is mixing his pitches a lot more than in previous seasons, which could be an answer to his sudden spike in production. If you’re thinking, well, maybe he’s throwing harder, he’s not. His fastball velocity last year was 93.4, which is pretty much where it’s been its entire career (career fastball velocity: 93).

Does this guarantee that Arrieta will be better than Lester next season? Probably not. Lester still has Arrieta by a wide margin in innings. Lester’s consistently pitched more 200 innings throughout his career, while Arrieta’s never pitched more than 156.2. Also even though Arrieta is mixing his pitches better, this isn’t necessarily predictive that he will keep doing it or keep doing it with the same success rate. If I personally had to put money on it I would still give a slight edge to Lester. That being said I wouldn’t be surprised if Arrieta was better than Lester next season and going forward.

Arrieta at 28 is still three years younger than Lester (31). While Arrieta’s fastball velocity had kept steady, Lester’s fastball velocity has been on a steady downward decline since 2010. Last year his fastball velocity was the lowest of his career at 91.5 and if it keeps dropping we could see a significant decline in Lester’s production. Throughout his career, Lester’s ERA and peripheral indicators have consistently been in the mid- to low-threes. It wouldn’t surprise me if Lester fell back to that norm, or even took a step back.

Essentially, it is difficult to predict which pitcher will regress and which one will keep the same level of production. For all we know, they could both regress. The point here is to demonstrate that Lester will not necessarily be that much better (if better at all) than Arrieta in 2015. For all we know, Arrieta might be the next Cubs ace.


Fantasy Baseball: Are Some Categories More Important Than Others?

While doing some work on my pre-season projections sheet, I came across a link to complete data from Razzball – complete full-season data for 48 12-team 5×5 fantasy baseball leagues[1]. I’ve been using this as a handy cross-reference in doing some SPG (Standings Points Gained) calculations, but I decided to try and use the data to do an exercise on something I’d been thinking about: are some categories more important than others?

First, I looked at the by-category scores for all 48 first place teams, then all the second place teams, etc:

R

HR RBI SB Avg W Sv K ERA WHIP Avg score
1st pl teams

10.8

10.4 10.2 9.8 8.3 10.7 10.3 11.1 9.8 9.9

10.11

2nd pl teams

9.8

9.0 9.9 8.3 8.2 9.5 9.8 9.9 9.6 9.1

9.31

3rd pl teams

9.0

8.4 9.1 8.5 7.6 8.9 8.9 9.1 8.1 7.8

8.56

4th pl teams

8.5

8.0 8.2 7.8 7.7 7.7 7.7 7.8 7.6 7.6

7.86

5th pl teams

7.9 7.5 6.9 7.4 6.8 7.3 7.2 7.5 7.1 6.8

7.24

The 48 first place teams, on average, scored 10.11 in the 5×5 categories. So basically a top-3 finish in all categories. Not that surprising.

Digging a bit deeper, I looked at the average score in each category for 1st place teams, then for 2nd place teams, and so on. I included the standard deviation (a measure of variability) and how often a team was in the top 3 for that category:

1st Place teams R HR RBI SB Avg W Sv K ERA WHIP
Average score 10.8 10.4 10.2 9.8 8.3 10.7 10.3 11.1 9.8 9.9
Std Dev 1.6 2.1 2.3 2.3 2.9 1.7 1.8 1.2 2.2 2.0
% in top 3 77.1% 72.9% 70.8% 62.5% 41.7% 79.2% 75.0% 87.5% 64.6% 66.7%
2nd place teams R HR RBI SB Avg W Sv K ERA WHIP
Average score 9.8 9.0 9.9 8.3 8.2 9.5 9.8 9.9 9.6 9.1
Std Dev 2.0 2.6 2.0 3.0 3.2 1.9 2.3 1.9 2.4 2.6
% in top 3 58.3% 52.1% 68.8% 41.7% 43.8% 60.4% 68.8% 66.7% 62.5% 56.3%
3rd place teams R HR RBI SB Avg W Sv K ERA WHIP
Average score 9.0 8.4 9.1 8.5 7.6 8.9 8.9 9.1 8.1 7.8
Std Dev 2.5 3.1 2.3 2.8 3.2 2.5 2.6 2.1 2.8 2.7
% in top 3 54.2% 47.9% 54.2% 47.9% 33.3% 52.1% 50.0% 50.0% 39.6% 37.5%

A quick glance seems to suggest that the most important categories were Runs on the batting side, and Ks on the pitching side: the average score for the team that won their league was highest – by quite a margin, and also varied less – for those two categories. Winning teams were also more likely to be at least in the top 3 in Runs and Ks compared to any of the other batting and pitching categories, respectively.

Conversely, Batting Average did not appear to be that important – less than half of the teams that won their league were in the top 3 in Batting Average, and it had the lowest average score for champion teams of all the 5×5 categories. It was also the most volatile – with a standard deviation of 2.9, around 67% of teams that won their league would have had a Batting Average score ranging from 11.2 down to as low as 5.3!

What about second-place teams? Ks and Runs were important here as well, but without the gaps seen for winning teams. The highest-scoring category on the pitching side was again Ks, but at 9.9, this was only 0.1 higher than the second category (Saves). On the hitting side, RBIs had the highest average score at 9.9, with Runs at 9.8

There’s another way to look at the data – if you were the leader in, say, Home Runs, how likely is it that you won your league? Here’s another breakdown:

1st in category
R HR RBI SB Avg W Sv K ERA WHIP
Avg Finish 2.1 3.0 3.0 3.4 5.2 2.5 3.1 2.2 3.2 3.6
% in top 3 75.0% 58.3% 56.3% 50.0% 31.3% 60.4% 58.3% 75.0% 60.4% 54.2%
2nd in category
R HR RBI SB Avg  W Sv K ERA WHIP
Avg Finish 3.4 4.3 3.3 4.3 4.9 3.5 3.0 3.3 4.5 4.2
% in top 3 39.6% 35.4% 56.3% 31.3% 31.3% 43.8% 41.7% 43.8% 27.1% 35.4%
3rd in category
R HR RBI SB Avg  W Sv K ERA WHIP
Avg Finish 4.3 4.3 4.1 4.7 5.5 4.1 3.8 3.5 4.6 4.9
% in top 3 20.8% 31.3% 25.0% 22.9% 22.9% 31.3% 43.8% 35.4% 39.6% 29.2%

This table tells us, for example, that once again, teams that finished tops in Runs or K’s, had an average overall finish of 2.1 and 2.2, respectively: basically, they finished 1st or 2nd overall in their league, and fully 75% of teams that were first in Runs or K’s had a top-3 overall finish. (15 teams were first in both Runs and Ks – of those, 14 won the league; the lone exception came in third).

Conversely, teams that had the best Batting Average only finished 5th on average, and only 30% of teams with the best batting average were in the top 3.

I’m not showing the data here, but the reverse was also true: of the teams that were in the bottom half in the league in Runs, or in K’s, exactly none of them won the league. None. Only four teams (for both Runs and K’s) even managed a 2nd place overall finish!

On the flip side, there were 26 teams that were in the bottom half in Batting Average but 1st or 2nd overall, including 14 overall winners.

So the data appear to be telling us that we need to focus on Runs and Ks, and not worry quite as much about Batting Average. There may be some logic behind this: players scoring lots of runs are, perhaps, coming to bat more often, which means more opportunities for HRs, SBs and RBIs. Pitchers generating lots of Ks are perhaps more likely to be in position to pick up Wins and Saves and have better ratios.

While I don’t think anyone would recommend ignoring a category altogether – even Batting Average – I think the key takeaway is that in looking at roster construction, you might benefit by paying closer attention to Runs and K’s – for example, by letting those two categories be the tie-breaker if two players appear to be close in value.

Obviously, none of this is particularly new or revolutionary. And of course the usual caveats apply: 48 leagues from one particular year may or may not be a sufficient sample size to draw conclusions from. Results will almost certainly differ in some way or another for leagues with different settings (1 catcher leagues vs 2 catcher leagues, 5 outfielders & 1 util vs 3 OF and 2 util, etc). My knowledge (or lack thereof) of statistics and such could make the entire exercise completely worthless, etc.

But I, at least, found it interesting – that’s all that matters, really – and I am looking to incorporate this as I do my projections this year.

[1] 12-team, standard 5×5, 5 outfielders and one utility spot; max 180 games started for pitchers, and – at least according to Razzball – the Razzball leagues are supposed to be generally more competitive that more casual leagues.


A zDefense Primer

This is installment 2 of the Player Evaluator and Calculated Expectancy (PEACE) system, which will culminate in a completely independent calculation of wins relative to replacement-level players.  Part 1 can be found here: http://www.fangraphs.com/community/an-introduction-to-calculated-runs-expectancy/

I reference Calculated Runs Expectancy a lot, so I highly recommend reading that article to gain some understanding of what I’m talking about.  Today I’m going to introduce my own defensive metric, zDefense, which operates under the same aggregate sum logic as UZR, but utilizes completely different arrangements of its components.

zDefense has 3 different methods of calculation: one for pitchers and catchers, one for infield positions, and one for outfielders.  I’ll explain how all three forms work to calculate each player’s defensive contribution in terms of runs relative to average (which for fielding is also considered “replacement-level”).  For this report, the seasons 2012-2014 have been calculated and will be compared throughout.

For pitchers and catchers, where Ball in Zone (BIZ) data isn’t available, the only calculation is zFielding, which measures how many relative runs player’s allowed according to Calculated Runs Expectancy (CRE).  For the pitchers, their defense is measured in terms of stolen bases, caught stealing, pickoffs, errors, and balks.  The catchers are judged based on stolen bases, caught stealing, wild pitches and passed balls, pickoffs, and errors.  In order to isolate each player’s individual contribution, each team’s “Base CRE” is calculated by taking their opponents’ offensive numbers and zeroing all baserunning/fielding statistics.  Then each player’s defensive numbers are included as the offensive counterpart and the difference between the new CRE calculation and the Base CRE indicates runs credited to that player defensively.  For example, in 2014 the St. Louis Cardinals had a Base CRE of 491 runs.  When analyzing Yadier Molina, his statistics (21 Stolen Bases, 23 Caught Stealing, 6 Pickoffs, 27 Bases Taken) are included in the equation and produce a new CRE value of 500, which means that he was responsible for about 9 runs allowed defensively.  This is done for all players and then compared to the positional average, which is where pitchers and catchers deviate from the other positions.

Without BIZ data, pitchers and catchers are evaluated based on the positional average number of innings played per defensive run allowed.  All other positions, however, are evaluated relative to the average number of runs allowed per ball in zone.  These numbers are almost constant year-to-year, with only miniscule variations (for example, the number of runs per BIZ for outfielders from 2012-2014 were 0.079, 0.079, and 0.078).

So in order to calculate Yadier Molina’s 2014 zDefense, his numbers would be plugged into the equation:

  • zDefense (Pitchers/Catchers) = (Innings Played / Positional Innings per Run) – Player Defensive Runs Allowed
  • zDefense (Molina, 2014) = (931.7 / 38.9) – 9.1 = +14.820


In 2014, catchers averaged one defensive run allowed every 38.9 innings; which means that an average catcher would be expected to allow about 24 runs in the number of innings that Molina caught.  Instead, he only allowed 9, saving the Cardinals nearly 15 runs in 2014.  This is all it takes to calculate the defensive contribution of pitchers and catchers.

For infielders and outfielders, zFielding is just one component; one that essentially tells how well fielders handled balls hit to them in terms of errors and preventing baserunner advancement.  It’s calculated slightly differently than for pitchers and catchers, but the first few steps are the same: find the team Base CRE, include player defensive stats, find the difference between the two CRE calculations, compare to positional rate.  Let’s use the Royals’ Alex Gordon in 2014 as an example.  The Royals as a team had a Base CRE of 519, and Gordon’s defensive contribution resulted in a new CRE of 528 (a difference of 9.1).  From here, just plug in the variables:

  •  zFielding (Infielder/Outfielders) = (Positional Runs per BIZ * Player BIZ) – Player Defensive Runs Allowed
  • zFielding (Gordon, 2014) = (0.064 * 261) – 9.1 = +7.724


Considering the number of balls in Gordon’s zone in 2014, he saved the Royals nearly 8 runs just by preventing errors and baserunner advancement.  But there are still a few other considerations for position players: zRange, zOuts, and zDoublePlays.

zRange attempts to quantify the number of runs saved by simply reaching balls in play using BIZ data and the runs per BIZ table from above.  It has 2 forms, one each for infielders and outfielders, but both begin the same way.  The first step is to find each position’s Real Zone Rating (RZR), which measures the percentage of BIZ fielded.  These numbers are more dynamic than the previous table, and the general trend has been towards higher RZR at all positions as offensive production has dwindled in the past decade.

The next step is basically the exact same as zFielding, except instead of finding relative runs allowed, we are looking for relative plays made.  For example, Alex Gordon in 2014 fielded 235 out of 261 BIZ (0.900 RZR), which was better than his positional average of 0.884.  By multiplying 261 and 0.884, it can be seen that Gordon reached about 4 more balls than the average left fielder would have.  From there, the relative number of plays is multiplied by the appropriate constant.  This is where one of the alterations to zDefense occurred.

For infielders, the idea is that by reaching a ball in play, the fielder has prevented the ball from reaching the outfield.  So in theory, this reduces the average number of runs that hit ball would be worth.  This is known as the IF (infield) Constant, and is the difference between the average runs per BIZ between outfield and infield balls in play.  In 2014 this constant was 0.068 (0.078 – 0.010), and has been nearly identical for each of the past three seasons.

For outfielders, the ball in play will almost always be classified as an outfield ball regardless of whether the fielder reaches it or not, so the OF (outfield) constant is just the average number of runs per BIZ for the outfield as a whole.  In 2014 this was 0.078, which would be multiplied by Gordon’s 4 relative plays above average.

Additionally, each player fields a number of balls outside of their zone (OOZ).  The number of OOZ plays is halved because they aren’t necessarily run-saving plays: when a shortstop catches a popup on the pitcher’s mound or when the first baseman extends to his right rather than let the second baseman handle the play, they may count as OOZ plays without being marginally beneficial.  The half of OOZ plays is also multiplied by the appropriate constant, added onto the previous product, and produces zRange.

  • zRange = {[Player Plays Made – (Player BIZ * Positional RZR)] + (Player OOZ Plays Made / 2)} * IF/OF Constant
  • zRange (Gordon, 2014) = {[235 – (261 * 884)] + (106 / 2)} * 0.078 = +4.436


On top of saving the Royals 8 runs with his arm and glove, Gordon also saved them over 4 runs with his legs and eyes.  This is where the biggest change to the formula happened; before, zRange was being calculated nearly identically to zOuts, which resulted in players essentially being credited twice with their relative RZR.  Instead, zRange just multiplies relative plays by the appropriate constant and recognizes that zOuts is a reflection of range and ability to convert balls into outs.

zOuts uses a very different approach than the previous 2 components; rather than find relative run values by conventional means, a rate statistic z-score is found and then multiplied by “playing time.”  It will be shown in the next section that this works remarkably well, but for now we are just looking at the derivation.  For zOuts, 2 different numbers are required for each player: their Real Zone Rating, and their Field-to-Out Percentage (F2O%).  These 2 numbers combine to form outs per BIZ, which is the comparative average each player is evaluated against.  Like the previous numbers, these also remain fairly consistent with a general trend negatively related to scoring.

Also required for z-scores is the standard deviation.  For these calculations, I have been using the standard deviation for just players with at least 100 innings played at that position to eliminate outliers.

Taking the z-score of outs per BIZ is simple enough, but what defines “playing time?”  Well, there are 2 factors that work well in eliminating outliers: the first is the percentage of total innings played at that position by that player.  If a team plays 1400 innings in the field over the course of the year, it means there are 1400 defensive innings available at each position, so a player who played in 1000 of them would have played about 71% of the defensive innings at that position.  The second factor considers that while players may have played an equal number of innings, they may not have had an equal number of balls to field.  This factor is one-half the square root of the number of BIZ for each player.

  • zOuts = [(Player O/BIZ – Positional O/BIZ) / Positional O/BIZ Standard Deviation] * (Player Innings / Team Innings) * (√ Player BIZ / 2)
  • zOuts (Gordon, 2014) = [(0.450 – 0.417) / 0.068] * (1372.7 / 1450.7) * (√ 261 / 2) = +3.741


zOuts is a blended statistic; it measures how well players convert balls into outs by considering their range and out-producing ability.  Alex Gordon saved the Royals another 4 runs this way, which brings his total zDefense to:

  • zDefense (Outfielders) = zFielding + zRange + zOuts
  • zDefense (Gordon, 2014) = +7.724 + 4.436 + 3.741 = +15.900


This is all it takes to calculate the defensive contribution of outfielders, but infielders still have one more factor to consider: double play ability.  zDoublePlays is nearly identical to zOuts, except double plays per BIZ is the positional average required.

From there, the calculation is almost the same as zOuts:

  • zDoublePlays = [(Player DP/BIZ – Positional DP/BIZ) / Positional DP/BIZ Standard Deviation] * (Player Innings / Team Innings) * (√ Player BIZ / 2) * Positional DP/BIZ


The last part at the end affects the weight of zDP in the overall zDefense equation.  The ability to turn double plays isn’t really a selling point for corner infielders because of the relative rarity of those plays.  Double play ability is much more relevant to middle infielders, and multiplying by the positional averages helps to bring this disparity into the equation.  JJ Hardy consistently ranks as elite in terms of double play ability, so we’ll use him as the example player here:

  • zDoublePlays (Hardy, 2014) = [(0.313 – 0.236) / 0.091] * (1257.0 / 1461.3) * (√ 316 / 2) * 0.236 = +1.540


And if we want the entire infielder formula written out:

  • zDefense (Infielders) = zFielding + zRange + zOuts +zDoublePlays


Like the previous post, there is a lot of new information to take in here, so feel free to ask any questions or leave any comments with feedback, thoughts, or concerns with work I’ve presented.  The next installment will be an exploration of z-scores in sports and how they correspond to actual points/runs, which I’ll use to provide credibility for zDefense.


Analyzing the FanGraphs Early Mock Draft from an Outsider’s Point of View – RPs 1-30

The following is a look at the first 30 relief pitchers taken in the FanGraphs Early Mock Draft, with a comparison to their rankings based on 2015 Steamer projections.

Relief Pitchers: 1-10

Relief pitchers started being drafted slowly, with Craig Kimbrel being the first taken towards the end of the 4th round, followed three picks later by Aroldis Chapman. There was a bit of a gap until Greg Holland was taken in the 6th round, then another bit of a gap until reliever started going quickly. Six relievers were taken over thirteen picks in rounds 7 and 8.

The table below shows the first 10 relief pitchers drafted in this mock, along with their Steamer rank and the difference between their Steamer rank and the spot they were drafted. Pitchers with a positive difference were taken higher than their Steamer projection would suggest. Those with a negative difference were taken later than Steamer would have expected.

FanGraphs Mock Draft RPs 1-10 vs Steamer Rankings
PCK RND $$ RP-Rnk NAME Steamer Rank Difference
46 4 $23 1 Craig Kimbrel 2 1
49 5 $28 2 Aroldis Chapman 1 -1
71 6 $19 3 Greg Holland 4 1
82 7 $20 4 Kenley Jansen 3 -1
83 7 $13 5 David Robertson 10 5
85 8 $13 6 Trevor Rosenthal 11 5
92 8 $11 7 Dellin Betances 16 9
93 8 $17 8 Sean Doolittle 5 -3
94 8 $14 9 Mark Melancon 9 0
126 11 $5 10 Zach Britton 26 16


Based on Steamer projections, Chapman and Kimbrel are ahead of the pack, then there is a large group of reliever that could easily move up or down the rankings based on a few saves here, a slightly higher or lower ERA/WHIP there, and small adjustments to their strikeout numbers.

In this grouping, Dellin Betances is ranked 16th by Steamer, mainly because he is projected for only 23 saves as we don’t yet know what the Yankees will do with both Betances and Andrew Miller at the back-end of their bullpen. With more saves, he moves up.

The big overshoot here appears to be Zach Britton, ranked 26th by Steamer among relievers thanks to a pedestrian 3.21 ERA, 1.26 WHIP, and sub-par 7.7 K/9. Britton is projected for 34 saves. Last year, he had 37 saves even though he didn’t get his first one until May 15th. As a team, the Orioles had 53 saves, tied for third in all of baseball. They were tops in MLB in saves in 2013 and second in 2012. If they continue to get saves at that pace, Britton should easily beat that projection.

Relief Pitchers: 11-20

The next 10 relief pitchers were taken over rounds 12 through 15. Here’s the chart:

FanGraphs Mock Draft RPs 11-20 vs Steamer Rankings
PCK RND $$ RP-Rnk NAME Steamer Rank Difference
140 12 $11 11 Cody Allen 13 2
152 13 $5 12 Huston Street 25 13
154 13 $17 13 Koji Uehara 6 -7
156 13 $1 14 Steve Cishek 14 0
157 14 -$3 15 Francisco Rodriguez 65 50
158 14 $6 16 Drew Storen 24 8
161 14 $8 17 Fernando Rodney 19 2
165 14 $12 18 Glen Perkins 12 -6
175 15 $6 19 Jonathan Papelbon 23 4
178 15 $15 20 Joaquin Benoit 7 -13


Based on Steamer projections, Joaquin Benoit looks like a bargain, as he was taken 20th but is ranked 7th. The risk with Benoit is a potential trade during the season. He’s in the final year of a 2-year contract (with a club option for 2016) and Padres’ GM A.J. Preller is not shy about making trades. If the Padres aren’t in contention come June or July, Benoit could be shipped out.

Koji Uehara and Glen Perkins were also taken a bit later than Steamer would suggest. Uehara will be 40 years old and has a career-high of 26 saves (last season). Perkins may not get many save opportunities with the Twins this year because of their last-place projection for the AL Central. With these two relievers, it’s perhaps not surprising to see them both drop a bit.

Francisco Rodriguez had 44 saves last year but has not found a team to play on in 2015. Despite that, he was the 15th reliever drafted, taken ahead of guys with set jobs like Storen, Rodney, Perkins, and Papelbon.

Relief Pitchers: 21-30

FanGraphs Mock Draft RPs 21-30 vs Steamer Rankings
PCK RND $$ RP-Rnk NAME Steamer Rank Difference
192 16 $9 21 Brett Cecil 17 -4
196 17 $8 22 Addison Reed 21 -1
198 17 $3 23 Santiago Casilla 30 7
201 17 $8 24 Hector Rondon 20 -4
222 19 $15 25 Jake McGee 8 -17
230 20 $1 26 Jonathan Broxton 37 11
232 20 $1 27 Neftali Feliz 35 8
234 20 $1 28 Joe Nathan 34 6
238 20 $9 29 Brad Boxberger 18 -11
239 20 $2 30 Jenrry Mejia 31 1


Jonathan Broxton looks like an overdraft here, but he is expected to be the Brewer’s closer at this point, so he could easily finish higher in the relief pitcher rankings than Steamer’s current projection of 37th.

Jake McGee (taken 25th, ranked 8th by Steamer) and Brad Boxberger (taken 29th, ranked 18th) are teammates in Tampa Bay. McGee finished last season as the Ray’s closer but had surgery in December to remove loose bodies from his shoulder. He is expected to miss at least the first month, which may allow Brad Boxberger (14.5 K/9 in 2014) to get some early-season saves, although veteran Grant Balfour is still in the mix. If one of them gets off to a good start, McGee may go back to a setup role.

Relievers in the Steamer’s Top 30 who were not drafted among the top thirty relievers drafted in this mock:

Andrew Miller (15th)

Wade Davis (22nd)

Hunter Strickland (27th)

Jason Grilli (28th)

Ken Giles (29th)

The chart below shows each owner’s reliever picks.

Owner Reliever Pick # Round RP-rnk Stmr-Rnk Difference
Blue Sox David Robertson 83 7 5 10 5
Blue Sox Drew Storen 158 14 16 24 8
Blue Sox Jonathan Broxton 230 20 26 37 11
ColinZarzycki Hector Rondon 201 17 24 20 -4
ColinZarzycki Neftali Feliz 232 20 27 35 8
cwik Huston Street 152 13 12 25 13
cwik Fernando Rodney 161 14 17 19 2
DanSchwartz Aroldis Chapman 49 5 2 1 -1
DanSchwartz Brett Cecil 192 16 21 17 -4
enosarris Sean Doolittle 93 8 8 5 -3
enosarris Glen Perkins 165 14 18 12 -6
enosarris Addison Reed 196 17 22 21 -1
jhicks Zach Britton 126 11 10 26 16
jhicks Santiago Casilla 198 17 23 30 7
jhicks Jake McGee 222 19 25 8 -17
Paul Sporer Dellin Betances 92 8 7 16 9
Paul Sporer Cody Allen 140 12 11 13 2
Pod Greg Holland 71 6 3 4 1
Pod Jenrry Mejia 239 20 30 31 1
Scott Spratt Jonathan Papelbon 175 15 19 23 4
Scott Spratt Joe Nathan 234 20 28 34 6
wiers Trevor Rosenthal 85 8 6 11 5
wiers Steve Cishek 156 13 14 14 0
wiers Francisco Rodriguez 157 14 15 65 50
wydiyd Kenley Jansen 82 7 4 3 -1
wydiyd Koji Uehara 154 13 13 6 -7
wydiyd Joaquin Benoit 178 15 20 7 -13
Zach Sanders Craig Kimbrel 46 4 1 2 1
Zach Sanders Mark Melancon 94 8 9 9 0
Zach Sanders Brad Boxberger 238 20 29 18 -11


  • Colin Zarzycki waited longest to take a closer, not drafting Hector Rondon until the 17th round, then adding Neftali Feliz in the 20th.
  • Zach Sanders, on the other hand, took a couple of top relievers in round 4 (Kimbrel) and 8 (Melancon), then added a guy with potential in the 20th (Boxberger).
  • Steamer most likes the reliever picks of wydiyd. Kenley Jansen was the 4th reliever taken (ranked 3rd by Steamer), Koji Uehara was 13th (ranked 6th by Steamer), and Joaquin Benoit was taken 20th (ranked 7th by Steamer).

What Can We Learn from the 1959 Chicago White Sox?

The terms “scouting” and “player development” are so frequently seen together that they should probably just get a room. It is axiomatic in today’s game that S&PD is the best, and perhaps only sustainable, route to baseball success.  This seems particularly true for the so-called small-market teams who are far too cash-poor to fish in Lake Boras. Which makes the recent antics of A.J. Preller (and the slightly less recent antics of Alex Anthopolous – see #12 and 13) so surprising. These are teams that play in the shadow of giants – figuratively in the Blue Jays’ case and both figuratively and literally for the Pads. If any teams should be S&PD-ing, its these, yet sweeping trades indicate that the two franchises have been less than fully successful at filling their major league roster holes with home-grown talent.

However difficult it is to be a GM in today’s AL East or NL West, few GMs have labored in a more unforgiving environment than those damned souls condemned to compete in the AL in the late 50s and early 60s, during the last of the pre-division-era Yankees dynasties. From 1947 through 1964 the Evil Empire missed the World Series just three times: in 1948 (Indians), 1954 (Indians), and 1959 (White Sox). Of these three, the 1959 “Go-Go” Sox have always stood out as the least probable Yankee-killers.

In an era when offense and power were essentially considered synonyms, the 1959 White Sox hit just 97 homers, not just last in the AL, but last in the majors. It took just four Indians to reach that total in 1948 (Gordon, Keltner, Boudreau, and Eddie Robinson). Yes, the 1959 Sox had three Hall-of-Famers (Nellie Fox, Luis Aparicio, and Early Wynn), but only one (Fox) was arguably in his prime.

All this said, the 1959 White Sox did a lot of things well. They got on base at a .327 clip, 3rd best in the AL. They stole 113 bases, leading the league, and totaling almost as many as the next two teams combined. They led the league in ERA (3.29), though the advanced metrics were less impressed with this staff. And they defended. Oh, did they defend.  They led the majors in Total Zone, and only the Spiders were even close. The White Sox had four of the top ten players in the majors, as rated by FanGraphs’ Def stat. And they were the four guys in the middle of the diamond (catcher Sherm Lollar, Fox at second, Aparicio at short, and Jim Landis in center).

So far, so small market. But of the 15 players with a WAR of least 1.0, just three were home-grown (Aparicio, Landis, and backup catcher Johnny Romano). Aparicio would end up in the Hall, and both Landis and Romano would have respectable careers (just over 20 WAR each), though Romano would spend most of his career with the Indians. The rest of the 1+ WAR players on the 1959 team were acquired by trade, with the exception of three aging but effective relievers, two of whom were signed off of waivers and one of whom was purchased.

And these were no ordinary trades. Let’s look at a couple of the more significant ones (many of these were multi-player deals – I’m focusing on the most significant players going each way):

Sox acquire Nellie Fox from the Philadelphia A’s for C  Joe Tipton in 1949.

Fox was just 21 in 1949, and his 300 or so plate appearances to that point had produced nothing of note, except one interesting harbinger of things to come: 34 career walks against just nine strikeouts. Fox would finish with 719 walks  and just 216 Ks in a career spanning over 10,000 plate appearances. No player with that many PAs has struck out less often.

As for Joe Tipton, you can admit you’ve never heard of him – you’re among friends here. Tipton spent one miserable year with the White Sox as a punchless 27 year old backup catcher before being sent to the city where it’s always sunny. He would develop into a useful backup bat, and amass a career war of 5.4. Fox had a WAR of 6.0 in 1959 alone.

Sox acquire Sherm Lollar from the St. Louis Browns for OF Jungle Jim Rivera and assorted Cracker Jack prizes in 1951.

Lollar was a bit of a late bloomer, with both the Yankees and Browns giving up on him before he found a home on the South Side at age 27, where he would be named to the all-star team six times.  This was probably a little generous, but he was a durable contributor at a position not normally associated with “durable” or “offense.” Rivera, for his part, would go on to a modest career WAR of 6.9. Even better, the Browns traded him back to the South Side the following year, where he would remain for the rest of his career.

Sox acquire Early Wynn from the Cleveland Indians for LF Minnie Minoso in 1957.

An exchange of one Hall-of-Famer for anoth- oops! Sorry about that. At age 37, Wynn looked like he might be done, with his ERA jumping from 2.72 in 1956 to 4.31 in 1957.  He was still durable, though (263 IP), so the Sox decided to get him in exchange for their star left fielder whose power had seemingly collapsed (sliding from 24 homers to 12 in the same two years). This one didn’t work out quite as well for the Sox, who got 6.5 WAR from Wynn in 1958-59, while a resurgent Minoso clobbered the ball to the tune of a 10.5 WAR for the Spiders. Wynn was nevertheless the Sox clear ace in 1959, going 22-10 with a 3.17 ERA (3.66 FIP) and leading the league with 255 IP. Minoso would return to the Sox in 1960, and he still had a couple of good years left, but he would never get that World Series ring.

Sox acquire P Bob Shaw from the Detroit Tigers for OF Tito Francona in 1958.

Shaw was the Sox’s second-best pitcher in 1959, behind only Early Wynn. He was 18-6 with a 2.69 ERA (though his FIP, at 3.36, was less kind). His career looks a little like Ervin Santana’s – basically a slightly above average pitcher with wild year-to-year ERA swings. The Sox would deal him just three years later, and he would pitch for seven different teams in his 11-year career, but he came through for the Sox when it counted most. Tito (whose real name is John Patsy Francona) had a forgettable year in a part-time role in Detroit, but showed the on-base skill that would propel him to three superb years in Cleveland before lapsing back into a bench role, albeit a long and fairly productive one, for the remainder of his career.

There were several other trades that went into building the 1959 Sox, but you get the idea. And it wasn’t just this year – the wheeling and dealing continued from 1957 through 1965, during which time the Sox would finish worse than second just three times. It was the White Sox’s misfortune that their dominance of the AL West ended four years before the division was created.

While the White Sox weren’t especially adept at developing players, they were extremely adept at finding them, and this is where scouting comes in. The Sox appear to have been very good at scouting both other teams’ rosters and their own. The only whiff in the transactions above involved Minoso, a player who was not quite done tormenting baseballs, and even in that trade the Sox received a very effective starter. This is what scouting without player development looks like. And it’s not bad if, you know, you like that sort of thing.

There are obviously only so many lessons today’s front offices can learn from those of yesteryear. While the Sox’ strategy may bear some superficial similarity to A.J. Preller’s, the Sox were able to ruthlessly exploit the reserve clause to pay quality veterans vastly less than any reasonable conception of their market value. Trading for veterans was a lot less costly back then. And while Preller was perhaps unimpressed with prospects he traded away, it is safe to say that he benefited to some extent from the Padres’ previous player development machine, in the sense that other teams were impressed enough with the young Padres (what do you call Padres prospects? los hijos?) to take them off A.J.’s hands.

But the broader point, as suggested by a commenter on my previous post, is that not every successful team has achieved that success by following whatever the then-current orthodoxy prescribes. Small market teams may be better off thinking outside the box than getting spent to death in it.


Why the Chicago Cubs Should Keep Starlin Castro

Ever since the Cubs acquired top shortstop prospect Addison Russell from the Oakland Athletics in the Jeff Samardzija and Jason Hammel deal people began to speculate that Starlin Castro’s time in Chicago may be coming to a close sooner rather than later. Castro’s name began to pop up in trade rumors all the time, Castro to the Mets, Castro to Seattle etc… but Cubs President Theo Epstein and General Manager Jed Hoyer told teams that Castro wasn’t going anywhere. With all the middle infield talent the Cubs have people see Castro as the odd man out. The front office repeated their message about Castro being their guy early in the offseason by saying “ Starlin is our shortstop in 2015.” I know a lot of people expect Castro to be traded at some point, but I’ll go over why I think they should keep the three-time All-Star, and how he’s becoming a better player.

Contract

First off Castro is still young currently 24 years old (he’ll turn 25 in spring training). Castro also has a team friendly deal at 7yr/$61M with an option for the 2020 season. This contract averages out to $8.7M each year, although the contract is back loaded, but still an average of $8.7M is a bargain for a premium position in today’s MLB market.

 Year  Age  Salary
2015 25 $6,857,143
2016 26 $7,857,143
2017 27 $9,857,143
2018 28 $10,857,143
2019 29 $11,857,143
2020 30 $16,000,000 (Team Option) $1M Buyout

Lets compare Starlin’s contract to another young shortstop, Elvis Andrus of the Texas Rangers. Andrus signed an 8yr/$120M contract with the Rangers.

Year Age Salary
2015 26 $15,000,000
2016 27 $15,000,000
2017 28 $15,00,000
2018 29 $15,000,000
2019 30 $15,000,000
2020 31 $15,000,000
2021 32 $14,000,000
2022 33 $14,000,000
2023 34 $15,000,000 (Vesting Option)


As you can see Andrus is due significantly more money than Castro. Compared to Andrus’ contract Castro’s seems like a bargain. But the real question is who is the better player, and is Andrus worth $60M more than Castro? Lets look at each player’s career numbers.

Andrus has posted of career line of (.272/.335/.345) with an OPS of .680, 20 points lower than league average. He has totaled 20 home runs in 6 seasons. Castro has a career line of (.284/.325/.410) with an OPS of .735, 35 points higher than league average. Starlin has clubbed 51 career home runs in one fewer year than Andrus. By comparing these two players numbers and contracts you can clearly see that the Cubs are getting a great deal on Castro. Castro not only makes far less than Andrus he is a superior offensive player, and is also younger with more upside. I believe that Castro’s contract could become more of a steal if Castro becomes a better player, which he is starting to show signs of. Lets go over how Castro is starting to become better in all facets of the game.

Improving Power

Castro totaled 14 home runs in 2014 tying his career high set back in the 2012 season. Starlin would have easily set a new career high if not for an ankle injury that cost him most of September. Despite missing almost 30 games Castro still put up a career high SLG% of .438 besting his 2011 season SLG% of .432. Keep in mind that is the season where Castro hit .307 and had over 200 hits so therefore his slugging percentage was based more on singles and triples and fewer long balls.

One reason for Castro’s improving power is that he is starting to hit more fly balls, and those fly balls are starting to leave the ballpark. In 2010 when Starlin got called up as a 20 year old he looked like a 16 year old due to his lean frame. Castro hit only 3 home runs that year and was mainly a singles hitter when he first started his career. In 2010 Castro’s groundball percentage (GB%) was 51.3% and his fly ball percentage (FB%) was 29.2%, this equaled a groundball to fly ball ratio (GB/FB) of 1.76. Castro’s home run to fly ball ratio (HR/FB) in 2010 was only 2.6%, which ranked 19th out of 22 qualified shortstops. As you can see when Starlin first came up he was a singles hitter who mainly hit the ball on the ground, which isn’t a bad thing, and when he did elevate the ball it rarely left the yard.

Let’s look at these same numbers in 2014. His GB% dropped to 45.3% and his FB% rose to 32.3%, which equaled a GB/FB ratio of 1.40. Now where the biggest change happened is in his HR/FB ratio — it skyrocketed to 10.1%. This means 1 out of every 10 fly balls that Starlin hit traveled over the wall for a homer. His increased HR/FB ratio brought him to 4th among qualified shortstops in HR/FB ratio, which is a huge improvement over his rookie season.

With more fly balls from Castro you’ll see more of this

and this

and this

Not only is Castro hitting more home runs; he is hitting more impressive home runs like these above. Watching Castro’s 2014 season I found myself saying, “wow that was far” on more of his home runs than ever before in previous seasons.

For these reasons above I believe that Castro is poised to show even more power in the coming seasons due to his increased FB% as well as his vastly improved HR/FB ratio.

Improving Defense

Lets take a look at Castro’s fielding numbers from the beginning of his career until now.

Year Errors Fielding Percentage (FP%) FP% Change
2010 27 .950 N/A
2011 29 .961 +11
2012 27 .964 +3
2013 22 .967 +3
2014 15 .973 +6

When Starlin came up in 2010, defense was the biggest weakness of his game by far. In 2010 he committed 27 errors in 123 games, which ranked as the 2nd most in the MLB that year. His FP% of .950, was 2nd to last among qualified shortstops in 2010. In 2011 Castro committed 29 errors, which was the most in the majors that year, although he still ranked last in FP% among shortstops, his FP% rose by 11 points. In 2012 Castro tied for the major league lead in errors at 27. 2013 was more of the same tying for the second most errors in the majors, but in 2014 we saw a great improvement by his committing only 15 errors. This improvement is Starlin’s fielding brought him towards the middle of the pack in FP% among shortstops. Castro even had a 38-game errorless streak in 2014 as well, showing that he has gotten over his problem of making the routine throw to first.

Although the metrics are down on Castro as a defender, I see Castro get to balls that he has no business getting to. For example Castro is one of the best shortstops at making plays on bloopers and shallow fly balls, like this for example.

Castro has great range on balls hit over his head. Not only can he make the plays in shallow left and center field, he covers a lot of ground moving laterally and is quickly able to get to his feet and unleash a strong throw, like this for example.

As you can see Castro is improving his defensive game year by year and there is no evidence to suggest that he can’t get any better in 2015 as well. This is just one of the many ways that Castro is steadily improving his overall game.

Comparing Castro to Other Shortstops

As offensive numbers are down in recent years, finding a premium offensive shortstop is a hard thing to do. Lets see how Castro stacks up compared to other shortstops around the league in 2014.

Among qualified shortstops Castro led all of them in batting average at .292, He was 2nd in OBP at .339, and 3rd in SLG at .438. I’ll take a guy any day of the week that ranks in the top three of those categories among his position. Castro also ranked sixth in line drive percentage at 22.3% (which beat his previous career high by 2%), trailing the leader by only 2%. Castro also ranked first in batting average on balls in play (BABIP); these two categories combined shows that he is putting the ball in play and hitting the ball hard all over the field, which will generate a good average as well as power. Another stat where Castro is ranked in the top three among shortstops is wRC+; his wRC+ was 115, 15 points over league average, good enough for third among shortstops.

One knock on Castro in his career is that he doesn’t walk enough, but looking at the shortstop position as a whole no one is posting a staggering OBP (Except for Troy Tulowitzki, who is in another league compared to every other shortstop, but he can’t stay healthy). Therefore Castro’s .339 OBP is extremely good for a shortstop in the game today. I think people need to compare players to others playing that same position, because if you look at Castro’s numbers compared to other shortstops Starlin is clearly a top three shortstop in the game offensively.

What Do You Do With All These Shortstops?

Some people see the Cubs’ surplus of shortstops as a problem, but I see it as a good problem to have. Normally your shortstop is your most athletic player and covers the most ground, so why not have three of them in the infield? I think if the Cubs fielded and infield of Castro, Javier Baez, and Addison Russell, that infield would gobble up every groundball. Whether Castro sticks at short or if Russell comes up and becomes the shortstop that everyone thinks he will be, the Cubs could have a huge defensive advantage by playing three shortstops in the IF.

Playing three shortstops in the IF would shift Kris Bryant, who will be an average defensive 3B at best, to the outfield where his defense wouldn’t be as much of a concern. Bryant in LF would fill the one spot where the Cubs don’t have a top prospect. This would mean you would have a top prospect at every position in the future. For example C: Kyle Schwarber (if he can stick at C), 1B: All-Star Anthony Rizzo, a combination of Baez, Castro, and Russell all fitting at 2B, 3B, and SS (future positions TBD), LF: Bryant, CF: Albert Almora or Arismendy Alcantara (Alcantara could become super utility as well, a Ben Zobrist role), RF: Jorge Soler. I don’t know about you but a lineup filled with all those top prospects and all that power excites the heck out of me.

Overall I think Starlin Castro is severely under-appreciated not only by the MLB, but also by Cubs fans. Castro has improved in many areas, and I believe that he is among the top three shortstops in the game. Castro is starting to show that he has more power in that bat with an increased FB% and in his FB/HR ratio. Keeping Starlin Castro as well as all of the other shortstops could be very beneficial for the Cubs.