A Discrete Pitchers Study – Pitchers’ Duels
(This is Part 3 of a four-part series answering common questions regarding starting pitchers by use of discrete probability models. In Part 1 we explored perfect game and no-hitter probabilities and in Part 2 we further investigated other hit probabilities in a complete game. Here we project the probability of winning a pitchers’ duel for who will allow the first hit.)
IV. Pitchers’ Duels
Bronze statues and folk songs are created to honor legendary feats of strength and stoicism… And Madison Bumgarner is deserving given his performance in the 2014 World Series. On baseball’s biggest stage, Bumgarner not only steamrolled an undefeated Royals team that was firing on all cylinders but he also posted timeless statistics (21 IP, 0.43 ERA, 0.127 BAA) that were beyond Ruthian or Koufaxian. Even as a rookie hidden among the 2010 Giants World Series rotation, Bumgarner’s potential radiated. So what do you do with an athlete who transcends time? You throw him into hypothetical matchups versus other champions. It would be thrilling, unless you like runs, to pit him against a pack of no-hitter-throwing pitchers (his 2010 rotation-mates) and even his 2010 self. We would be treated to great pitchers’ duels comparable to the matchups we would expect from a World Series.
When you oppose an excellent starting pitcher against another (and their hitters), the results will likely not reflect each players’ season averages. Hits and walks will be hard to come by and runs will be even harder. For our duels, we use each pitcher’s World Series probability of a hit, P(H), Bumgarner from 2014 and 2010 and the rest from 2010; P(H), hits divided by the same base as on-base percentage (AB+SF+HBP+BB), represents the quality of pitching we want from our duels. Even though 2014 Bumgarner faced a different lineup (the Royals) than the lineup his 2010 rotation-mates faced (the Rangers) to produce their respective averages, we are encapsulating the performances witnessed and assuming they can be recreated for our matchups. If okay with this assumption, then we can construct a probability model that predicts which pitcher will allow the first hit in our hypothetical pitchers’ duels. If interested further, we could also switch the variables to predict which pitcher will allow the first base runner by using on-base percentage (OBP).
The first formula we construct determines the probability that 2010 Pitcher A will allow m hits before 2014 Bumgarner allows his 1st hit; it is possible for the mth hit from A and the 1st hit from Bumgarner to occur after the same number of batters, but in a duel we want a clear winner. Let a be P(H) for 2010 Pitcher A and  be a random variable for the total batters faced when he allows his mth hit; similarly, let b be P(H) for 2014 Bumgarner and
  be a random variable for the total batters faced when he allows his 1st hit. If 2010 Pitcher A allows his mth hit on the jth batter, he will have a combination of m hits and (j-m) non-hits (outs, walks, sacrifice flies, hit-by-pitches) with the respective probabilities of a and (1-a); meanwhile 2014 Bumgarner will eventually allow his 1st hit on the (j+1)th batter or later and he will have 1 hit and the rest non-hits with the respective probabilities of b and (1-b). We can then sum each jth scenario together for any number of potential batters faced (all j≥m) to create the formula below:
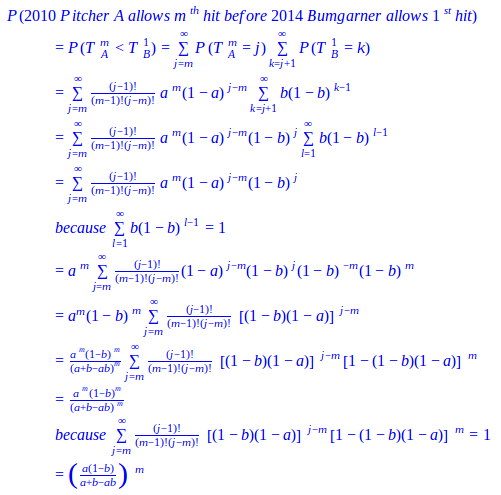
If we assume an even pitchers’ duel of who will allow the 1st hit, for m=1, then we have the following intuitive formula for 2010 Pitcher A versus 2014 Bumgarner:
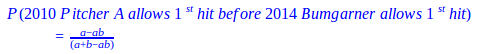
This formula takes the probability that 2010 Pitcher A allows a hit minus the probability that both pitchers allow a hit and divides it by the probability that 2010 Pitcher A or 2014 Bumgarner allow a hit. Furthermore, if we let this happen for m hits, we arrive at our deduced formula. We should also note that according to the deduced formula, we should see the probability decrease as m increases. This logic makes sense because the expected span of batters until 2014 Bumgarner allows his 1st hit, , stays the same, but we are trying to squeeze in more hits allowed by 2010 Pitcher A, which makes the probability become less likely.
Table 4.1: Probability of 2010 Pitcher A Allowing mth Hit Before 2014 Bumgarner Allows 1st
|
Tim Lincecum |
Matt Cain |
Jonathan Sanchez |
Madison Bumgarner |
|
| World Series P(H) | 0.196 | 0.143 | 0.273 | 0.111 |
| Allows 1st Hit before Bumgarner’s 1st | 0.583 | 0.504 | 0.660 | 0.441 |
| Allows 2nd Hit before Bumgarner’s 1st | 0.340 | 0.254 | 0.435 | 0.195 |
| Allows 3rd Hit before Bumgarner’s 1st | 0.198 | 0.128 | 0.287 | 0.086 |
In Table 4.1, we compare 2014 Bumgarner and his 0.123 World Series P(H) versus each starter from the 2010 World Series Giants rotation and their respective P(H). We expect 2014 Bumgarner to have the advantage over 2010 Lincecum, Cain, and Sanchez, given how he dominated the 2014 World Series; clearly he does. In an even pitchers’ duel, he would win with a probability greater than 50% even after the chance of a tie is removed; we could even see 2 hits from the other pitchers before 2014 Bumgarner allows his 1st with a probability greater than 25%. However, against a comparably excellent pitcher, himself in 2010, he would likely lose the duel because 2010 Bumgarner actually has a better P(H). Notice that from Sanchez to Lincecum and from Lincecum to Cain, the P(H) descends steadily each time; consequently, the same pattern of linear decline also follows duel probabilities when transitioning from pitcher to pitcher for each of the different hits allowed. Hence, the distinction between exceptional and below-average pitchers stays relatively constant as we allow more hits by them versus 2014 Bumgarner.
We can also construct the converse formula to calculate the probability that 2010 Pitcher A allows 1 hit before 2014 Bumgarner allows his nth hit. We let  be a random variable for the total batters faced when 2014 Bumgarner allows his nth hit and
  for when 2010 Pitcher A allows his 1st hit. However, instead of directly deducing the probability that 2010 Pitcher A allows 1 hit before 2014 Bumgarner allows his nth hit, we’ll do so indirectly by taking the complement of both the probability that 2014 Bumgarner allows his nth hit before 2010 Pitcher A allows his 1st hit (a variation of our first formula) and the probability that 2014 Bumgarner allows his nth hit and 2010 Pitcher A allows his 1st hit after the same number of batters.
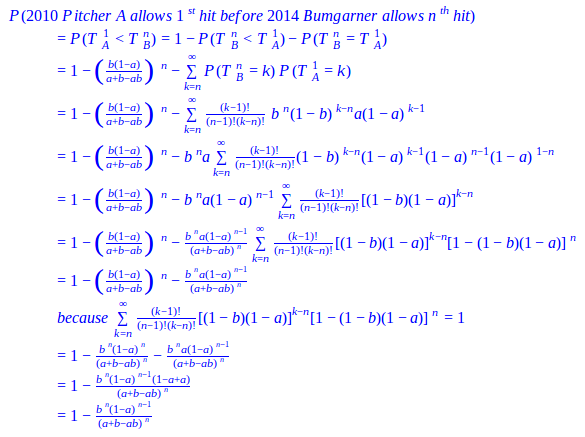
The resulting formula takes the complement of the probability that 2014 Bumgarner allows n hits and 2010 Pitcher A does not allow a hit in (n-1) chances and divides it by the probability that 2010 Pitcher A or 2014 Bumgarner allow n hits. In this formula we can contrarily see the probability increase as n increases. By extending the expected span of batters, , to accommodate 2014 Bumgarner’s n hits instead of just 1, we’re granting 2010 Pitcher A more time to allow his 1st hit, resulting in an increased likelihood.
Once again, if we set n=1 for an even matchup, we get the same formula as before:
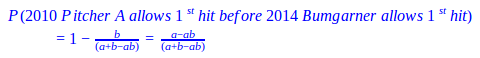
Table 4.2: Probability of 2010 Pitcher A Allowing 1st Hit Before 2014 Bumgarner Allows nth
|
Tim Lincecum |
Matt Cain |
Jonathan Sanchez |
Madison Bumgarner |
|
| World Series P(H) | 0.196 | 0.143 | 0.273 | 0.111 |
| Allows 1st Hit before Bumgarner’s 1st | 0.583 | 0.504 | 0.660 | 0.441 |
| Allows 1st Hit before Bumgarner’s 2nd | 0.860 | 0.789 | 0.916 | 0.723 |
| Allows 1st Hit before Bumgarner’s 3rd | 0.953 | 0.910 | 0.979 | 0.862 |
In Table 4.2, we again use 2014 Bumgarner’s 0.123 P(H) versus those displayed in the table above. As expected, the probabilities from the even duels are the same as Table 4.1 because the formulas are the same. Although this time from Sanchez to Lincecum and from Lincecum to Cain, the difference between each pitcher noticeably decreases as we adjust the scenario to allow 2014 Bumgarner more hits. Thereby, there is less distinction between exceptional and below-average pitchers if we widen the range of batters, , enough for them to allow their 1st hit versus 2014 Bumgarner.
Madison Bumgarner may have dominated the 2014 World Series as a starter, but he also forcefully shut the door on the Royals to carry his team to the title (by ominously throwing 5 IP, 2 H, 0 BB). Given the momentum he had, he proved himself to be Bruce Bochy’s best option. However, not every game is Game 7 of the World Series, where a manager must decisively bring in the one reliever he trusts the most. A manager needs to assess who is the appropriate reliever for the job and weigh which relievers will available later. Fortunately, an indirect benefit of the pitchers’ duel model is that it can calculate the relative probability between two relievers for who will allow a hit or baserunner first; this application could be very useful in long relief or in extra innings.
Table 4.3: Probability of 2010 Pitcher A Allowing mth Baserunners Before 2014 Bumgarner Allows 1st
|
Tim Lincecum |
Matt Cain |
Jonathan Sanchez |
Madison Bumgarner |
|
| World Series OBP | 0.268 | 0.214 | 0.409 | 0.185 |
| Allows 1st BR before Bumgarner’s 1st | 0.602 | 0.547 | 0.698 | 0.511 |
| Allows 1st BR before Bumgarner’s 2nd | 0.362 | 0.299 | 0.487 | 0.261 |
| Allows 1st BR before Bumgarner’s 3rd | 0.218 | 0.164 | 0.339 | 0.133 |
Suppose we’re entering extra innings and the only pitchers available are 2014 Bumgarner and 2010 Bumgarner, Lincecum, Cain, and Sanchez with their respective statistics from Table 4.3 (where we substituted P(H) in Table 4.1 for OBP). We wouldn’t automatically throw in our best pitcher, 2014 Bumgarner, with his 0.151 OBP; we need to compare how he would perform relative to the other 2010 pitchers and see what the drop off is. Nor is it a priority to know how many innings to expect out of our reliever because we don’t know how long he’ll be needed. What is crucial in this situation is the prevention of baserunners as potential runs. 2010 Bumgarner, Cain, and Lincecum would each be worthy candidates to keep 2014 Bumgarner in the bullpen, because each has a reasonable chance (greater than 40%) of allowing a baserunner by the same batter or later than 2014 Bumgarner. Hence, the risk of using a pitcher with a slightly greater chance of allowing a baserunner sooner may be worth the reward of having 2014 Bumgarner available in a more dire situation. Yet, we would want to avoid bringing in 2010 Sanchez because the risk would be too great; the probability is approximately 49% that he could allow two baserunners before 2014 Bumgarner allows one. Preventing baserunners and using your bullpen appropriately are both high priorities in close game situations where mistakes are magnified.