Complete Outfield Dimensions
I’ve been consistently dismayed at how metrics such as park factors could be calculated when it seems as if the fundamental data for calculating such metrics, the actual size and dimensions of MLB parks, is unknown.
Any diagram or database of park dimensions I’ve found usually has LF, CF, and RF distances measured along with distances from home plate to the power alleys. A typical diagram is the following one of Fenway Park where five “important” distances have been marked.
The locations of these markings, particularly the power alleys, is extremely inconsistent across the different ballparks. In some parks the power alleys are measured at LCF and RCF (22.5° from each foul line), in other parks it’s where there is a corner in the outfield fence, and in other parks it’s just somewhere. In the Fenway image it’s impossible to tell where exactly any of those markings are and what any of the distances are between them. In any case, these five data points, plus any other distance markings, are not enough to define the shape and size of a ballpark.
We should be able to point in any direction in a ballpark and know the exact distance to the fence. Guessing by examining the proximity to the closest marked spot is insufficient for any real analysis. In order to understand the properties of a ballpark, to, for example, determine the ideal defensive positioning of the outfielders, we need to be able to mathematically define the boundaries, i.e. the location of the outfield fence.
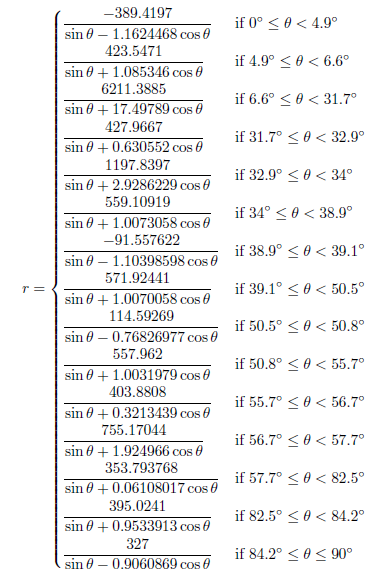
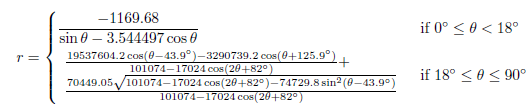
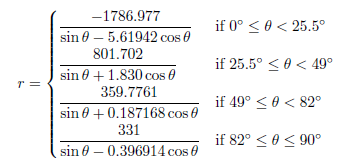
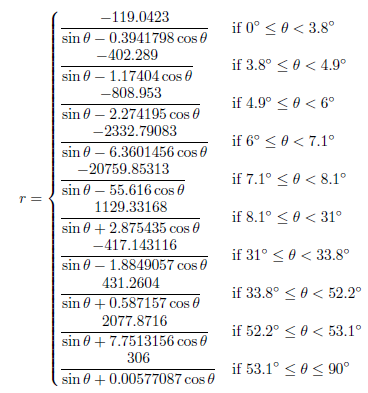
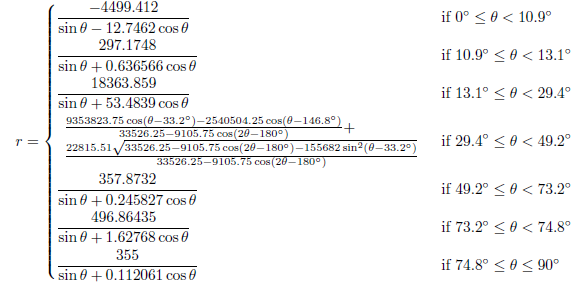
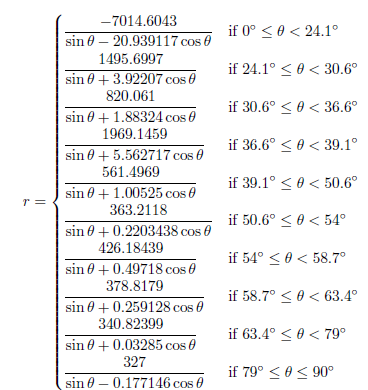
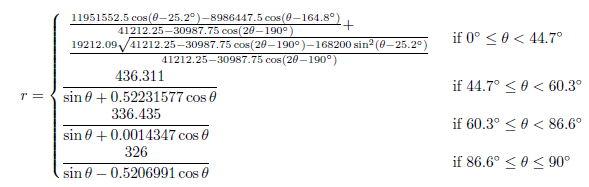
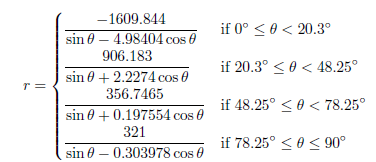
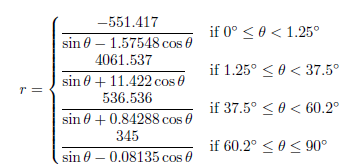
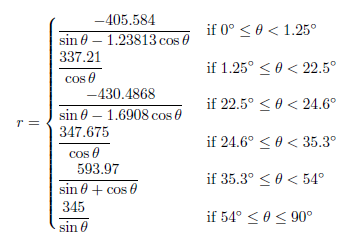
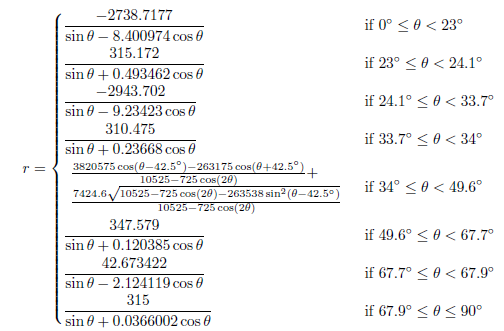
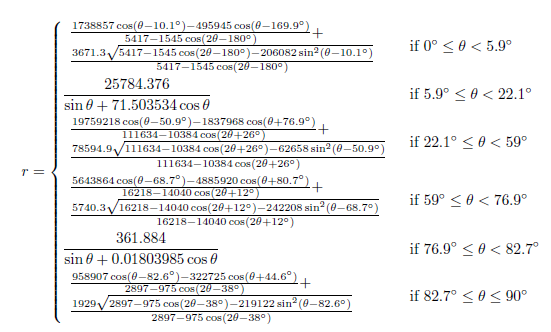
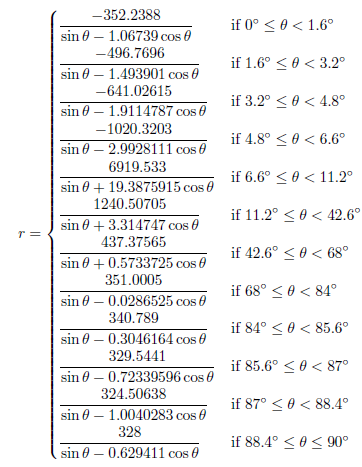
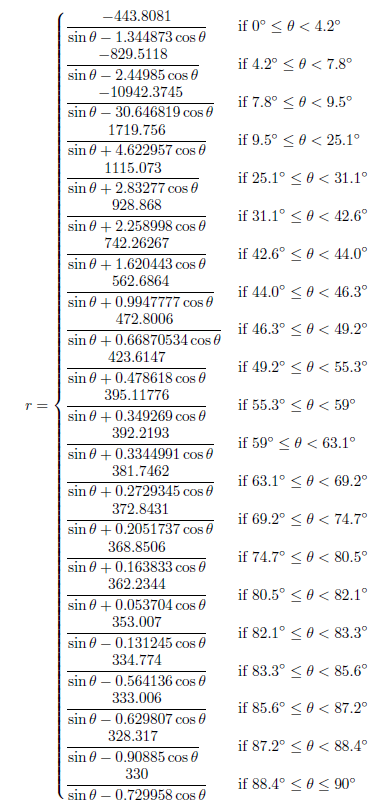
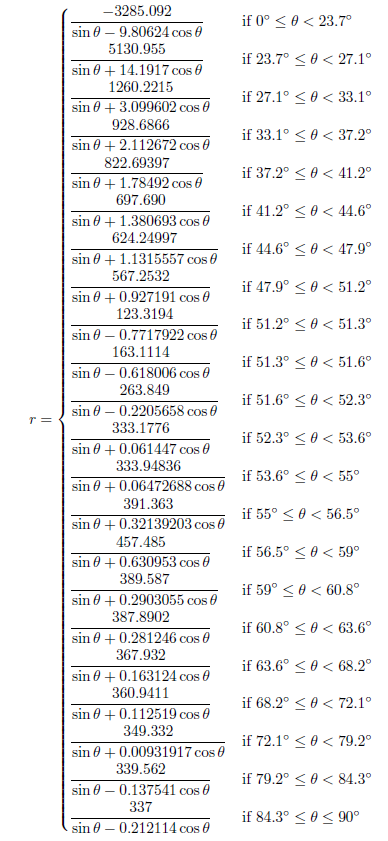
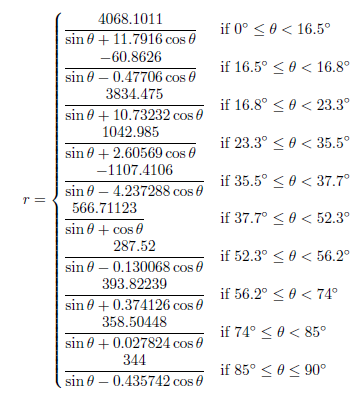
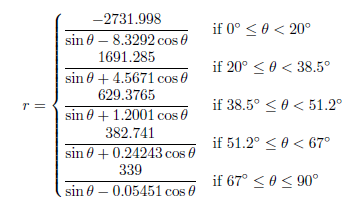
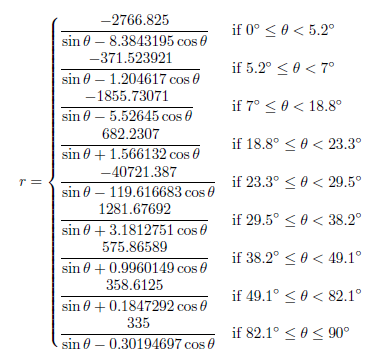
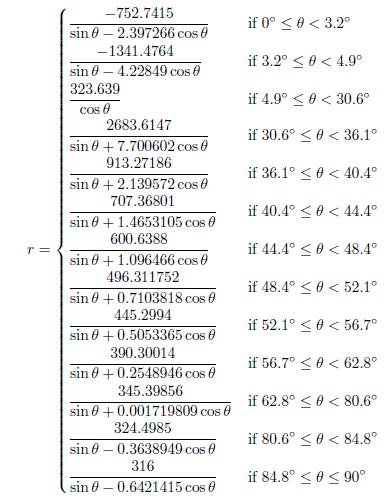
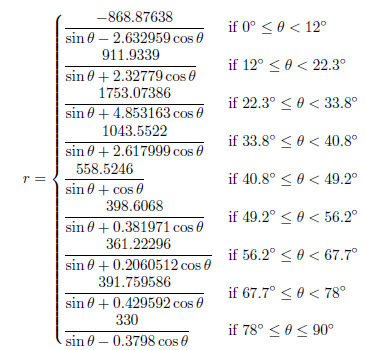
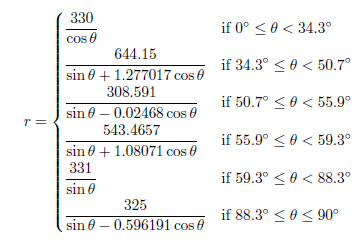
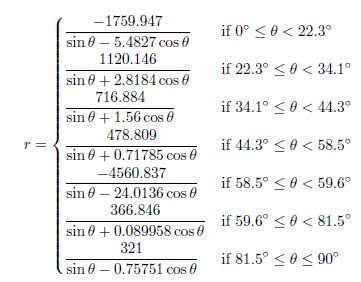
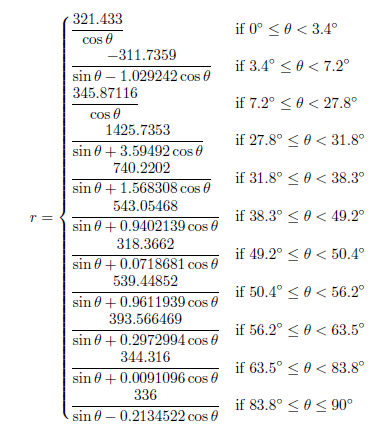
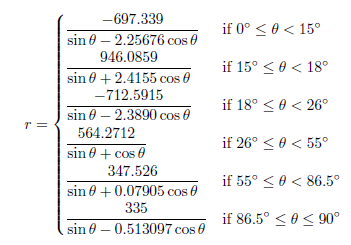
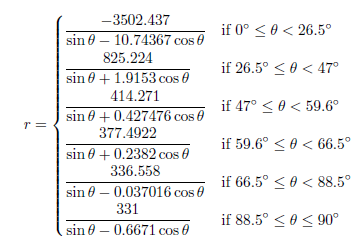
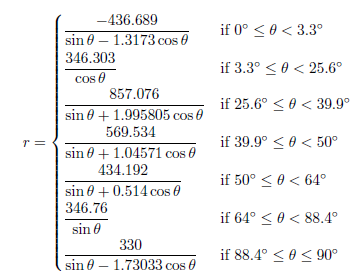
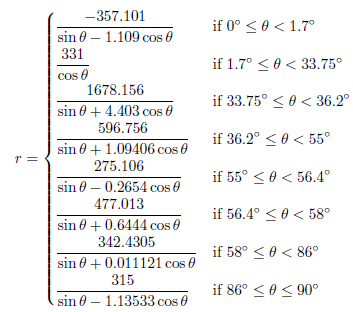
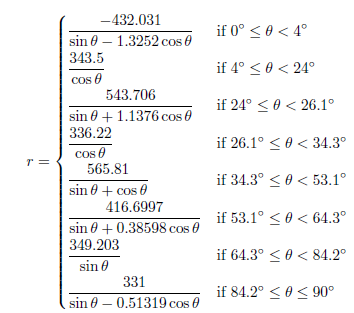
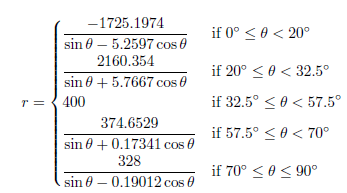
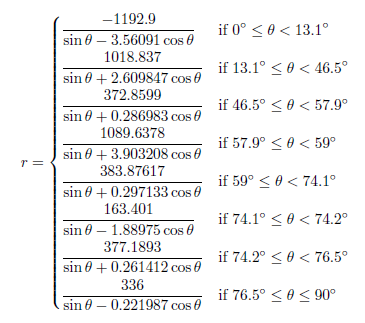
These mathematical formulas defining the outfield fences are exactly what this article presents. If you look to the bottom of this article you’ll see the 30 equations that define the major league outfield fence distances from home plate. The equations are given in polar coordinates in terms of the angle θ from the right field foul line (RF=0°, LF=90°). The resulting distance, r, is given in feet.
The equations are all piecewise functions, with breaks between the sub-functions whenever the outfield wall changes direction. The sub-functions are given by linear functions or ellipses (all mapped to polar coordinates) where appropriate. Some ballparks are more complicated than others and that’s generally reflected in the number of required sub-functions. Some of the functions may seem intimidating, however, I would intend that any analysis with these functions would be done by computer, which makes the number of sub-functions in each piecewise definition generally irrelevant once the equations have been coded.
These equations were determined by examining the diagrams at ESPN Home Run Tracker, as well as park dimension data from Wikipedia, Clem’s Baseball, MLB team pages, and any other park diagrams I could find. These sources were not always in agreement and I used my best judgment when these situations arose, however I would guess that the standard error of the fence distance for any angle for any park is only a couple feet. There are also often many more precision digits that appear in the equations than necessary. This is for two reasons. The first reason is that it helps avoid discontinuities when transitioning between the functions and the second reason is that sometimes I just wrote down a lot of digits.
As a simple exercise of what can be done with this type of data, I’ve calculated the areas of the outfields of all the different MLB parks, as well as the respective sizes of left, center, and right field. The results are shown in Table 1 (sortable by clicking any of the header items). As an arbitrary start point, I assumed the outfield started 150 feet away from home plate and that each field spans 30°. Many of these results match our intuition (Yankee Stadium RF is tiny, Comerica Park CF is huge), but we now have numbers assigned to that intuition that can be analyzed.
| City | Team | Stadium | OF | LF | CF | RF |
|---|---|---|---|---|---|---|
| Arizona | Diamondbacks | Chase Field | 94.1 | 28.7 | 36.2 | 29.2 |
| Atlanta | Braves | Turner Field | 94.1 | 29.2 | 35.3 | 29.6 |
| Baltimore | Orioles | Oriole Park at Camden Yards | 87.8 | 27.1 | 34.4 | 26.3 |
| Boston | Red Sox | Fenway Park | 83.5 | 21.1 | 32.8 | 29.6 |
| Chicago | Cubs | Wrigley Field | 89.7 | 26.8 | 34.1 | 28.8 |
| Chicago | White Sox | U.S. Cellular Field | 87.8 | 26.5 | 34.2 | 27.2 |
| Cincinnati | Reds | Great American Ball Park | 87.1 | 26.7 | 34.5 | 26.0 |
| Cleveland | Indians | Progressive Field | 85.6 | 25.8 | 33.2 | 26.6 |
| Colorado | Rockies | Coors Field | 97.3 | 30.2 | 38.3 | 28.8 |
| Detroit | Tigers | Comerica Park | 95.8 | 28.5 | 39.9 | 27.4 |
| Houston | Astros | Minute Maid Park | 88.6 | 23.2 | 38.8 | 26.6 |
| Kansas City | Royals | Kauffman Stadium | 97.9 | 30.4 | 36.9 | 30.5 |
| Los Angeles | Angels | Angel Stadium | 89.2 | 29.0 | 32.7 | 27.5 |
| Los Angeles | Dodgers | Dodger Stadium | 91.1 | 28.8 | 33.8 | 28.5 |
| Miami | Marlins | Marlins Park | 93.4 | 28.3 | 36.9 | 28.3 |
| Milwaukee | Brewers | Miller Park | 91.1 | 28.9 | 34.6 | 27.6 |
| Minnesota | Twins | Target Field | 90.4 | 28.0 | 35.8 | 26.6 |
| New York | Mets | Citi Field | 91.5 | 27.1 | 36.0 | 28.4 |
| New York | Yankees | Yankee Stadium | 87.6 | 27.7 | 35.6 | 24.2 |
| Oakland | Athletics | O.co Coliseum | 88.4 | 27.5 | 33.4 | 27.5 |
| Philadelphia | Phillies | Citizens Bank Park | 86.2 | 25.7 | 34.9 | 25.5 |
| Pittsburgh | Pirates | PNC Park | 90.2 | 29.8 | 33.9 | 26.5 |
| San Diego | Padres | PETCO Park | 90.8 | 27.9 | 35.0 | 27.8 |
| San Francisco | Giants | AT&T Park | 92.2 | 27.3 | 36.2 | 28.7 |
| Seattle | Mariners | Safeco Field | 87.8 | 27.2 | 34.2 | 26.4 |
| St. Louis | Cardinals | Busch Stadium | 91.1 | 28.6 | 34.1 | 28.4 |
| Tampa Bay | Rays | Tropicana Field | 89.6 | 27.4 | 36.5 | 25.7 |
| Texas | Rangers | Globe Life Park in Arlington | 92.7 | 28.9 | 36.1 | 27.7 |
| Toronto | Blue Jays | Rogers Centre | 91.8 | 27.9 | 35.9 | 27.9 |
| Washington | Nationals | Nationals Park | 88.8 | 28.2 | 32.8 | 27.8 |
The previous definition of the different fields could be modified or determined based on the intended purpose. For example, for determining the outfield positioning, the relative speed of each fielder would determine the area for which each fielder is responsible. With these equations, those values can be exactly calculated. Also, just because two fields have the same area, does not mean they are of equal difficulty to defend. The shape of the fence determines how accessible the different parts of the area are. Again though, with these equations these shapes and values can be determined.
These equations are limited though in that they only define the outfield in fair play. For further research and to more completely account for different stadiums, the distances from the plate to the fence for all 360° of rotation should be known. Foul territory is a much greater consideration in some parks than others.
And now, the equations.
Arizona Diamondbacks – Chase Field
Atlanta Braves – Turner Field
Baltimore Orioles – Oriole Park at Camden Yards
Boston Red Sox – Fenway Park
Chicago Cubs – Wrigley Field
Chicago White Sox – U.S. Cellular Field
Cincinnati Reds – Great American Ball Park
Cleveland Indians – Progressive Field
Colorado Rockies – Coors Field
Detroit Tigers – Comerica Park
Houston Astros – Minute Maid Park
Kansas City Royals – Kauffman Stadium
Los Angeles Angels – Angel Stadium
Los Angeles Dodgers – Dodger Stadium
Miami Marlins – Marlins Park
Milwaukee Brewers – Miller Park
Minnesota Twins – Target Field
New York Mets – Citi Field
New York Yankees – Yankee Stadium
Oakland Athletics – O.co Coliseum
Philadelphia Phillies – Citizens Bank Park
Pittsburgh Pirates – PNC Park
San Diego Padres – PETCO Park
San Francisco Giants – AT&T Park
Seattle Mariners – Safeco Field
St. Louis Cardinals – Busch Stadium
Tampa Bay Rays – Tropicana Field
Texas Rangers – Globe Life Park in Arlington
Toronto Blue Jays – Rogers Centre
Washington Nationals – Nationals Park
This is really awesome work! I’m excited to see where this goes. I know you talked about adding foul territory, which is clearly important, but have you also considered adding the third dimension (height, primarily of the walls). I know nearly nothing of advanced math, so this may be too much work or too hard, but I could see how helpful that could be for determining what the defensible area is. And how hard it is to get a ball out of any given park.
Regardless, this is awesome work! I can’t wait to see it in action.
Yes, the wall height is definitely important and my next piece of work.
This is really good work. Thank you.
Since most of your r(theta) functions have the form X/(sin(theta)+Y cos(theta)), why not just quantify each park using 2 smoothed functions some X(theta) and Y(theta) instead of these huge conditional statements?
I didn’t want to use smoothed functions, I was trying to find the dimensions as exactly as possible.
I could have done it in terms of X(theta) and Y(theta), according to your definitions, but then those still would have ended up being piecewise functions which then would need to be plugged into a second equation. Although some of these equations are large, they’re explicit and as exact as I could be.
^In this case, X and Y have very intuitive interpretations: X is just the overall distance normalization, and Y is some curvature/tangentiality parameter
I copied the table into a spreadsheet and did some calulations. (all percentages are based on MLB average)
The AL East has the smallest total OF (97.37%), RF (95.03%), and LF (96.93%). The NL Central has the smallest CF (97.18%).
The NL West has the largest OF (102.94%), LF (103.5%), and RF (103.67%). The AL Central has the largest CF (102.18%). (If Colorado is excluded, NL West still has the largest OF (102.05%), LF (102.36%), and RF (103.65%).)
The Royals (108.25%) and Rockies (107.59%) are the only OF at least 6% larger than MLB average.
The Red Sox (92.33%) and Indians (94.65%) are the only OF at least 5% smaller than MLB average.
Red Sox LF (23.59% smaller), Astros LF (15.98% smaller), and Yankees RF (12.28% smaller) are the only fields more than 8% smaller than MLB average (LF compared to MLB LF, RF to MLB RF, etc.).
Tigers CF (13.25% larger), Astros CF (10.12% larger), Royals LF (10.09% larger), Royals RF (10.56% larger), and Rockies LF (9.37% larger) are the only fields more than 9% larger than MLB average (LF compared to MLB LF, RF to MLB RF, etc.).
It is interesting to see how some of the teams in divisions bunch together in terms of park type. It means that if you can find a player to best suit your home field advantage, it may also help for a significant percentage of your road games.
One thing I would caution about when using percentages with those numbers instead of absolute values is just how I defined the OF. If I say started the OF at 200′ instead of 150′ you would see a larger percentage difference between the parks.
Wow. Uh, thank you. Thank you very much.
yuge
Andrew, thank you for this good work. However, my supposition is different than yours: Kaufmann Stadium outfield is not the largest; rather Coors Field outfield is largest.
Coors to Kaufmann comparison by wikipedia data:
LF Line 347 ft > 330 ft
LC 390 ft > 387 ft
CF 415 ft > 410 ft
RC 375 ft 330 ft
The deepest point at the K is 410 feet in straightaway CF or theta = 45. Coors has 420 ft depth at the LF-CF wall intersection and 424 ft depth at the CF-RF wall intersection per bestfoulballseats.com.
So the depth of Coors dominates the depth of K for all values of theta > ~40 degrees. Coors dominates the K for 0 > theta < 10.
For ~60 degrees of the range of theta the depth of Coors is larger and for ~30 degrees the depth of the K is larger.
I believe the K is symmetric and your formula does not hold symmetry. I will examine this further and post further.
I will do some additional geometric calculations and post again to further attempt to refute your findings for the rank of Coors and the K outfield areas.
That said, I commend your work and agree that MLB should survey the "in play area" at each park and post the data for all to use.
OK, I’ve posted this reply a couple times now but it contains a link so I’m guessing that’s why it’s having trouble. I’ll just provide instructions. For an important diagram, go to hit tracker online, click ball parks, click Kauffman, then click Overlay Ballpark, and select Coors.
The distance points you mentioned above are all at points where Coors is deeper, but this is why I said that it’s important to account for the distance at all points, especially with curved walls. You’ll notice that although Kauffman is shallower right down the lines, within a few degrees it becomes significantly deeper for both LF and RF. Coors is deeper in CF but it isn’t enough to overcome the deficit from LF and RF. This is reflected in the numbers in the table above.
Now the method I used does have some error associated with it, I assume a standard deviation of a couple feet for all locations. So if I ended up on the wrong side of the error for these, the areas of the two parks are close enough that they may be reversed. However looking at that overlay diagram and trusting my method, I am fairly confident in my results.
Here’s the link: http://www.hittrackeronline.com/overlay/overlay_1422717596_794552482.jpg
Andrew- Thanks for pointing out the overlay feature at the home run tracker site. The overlay of Coors and Kaufman does indicate you are correct (and I was wrong) regarding the ordinal value of outfield area is Kaufman 1 and Coors 2. Good job!
For Coors the outfield can be modeled with four triangles. I tried to use three triangles but this neglects the wall configuration near the RF foul pole. I will attempt to confirm your Coors overall outfield area number with the addition of the area of the four triangles and post back.
I wonder if we can ask HOK (Kaufman designers) to provide some simpler math to describe the outfield wall configuration. I’m going to have to brush up on seldom-used elliptical curve fitting skills and see if I can replicate your outfield area number for the K.
Another method might be through photogrammetric techniques using readily available “satellite” images.
I also wonder as to the source of the overlays for Home Run Tracker and their fidelity with the “as-built” stadium configurations.
Thanks for the reply and well done!
Great work. Now how up-to-date are your dimensions? For example, Citi Field is bringing in their fences again. Are your dimensions reflective of that, or are the dimensions from this past season?
Dimensions are from 2014.
I have calculated an estimate for the left field area for Coors Field to be 30,549 square feet which is within 1.1 percent of your estimate of 30,200 square feet. My estimate is based on the following assumptions: Range to left field foul pole is exactly 347 feet; range to intersection of LF and CF walls is exactly 420 feet and on the exact azimuth 30 degrees clockwise from the left field foul pole. Using side-angle-side property for a triangle, the distance from the foul pole to the intersection of the LF and CF walls is 210.7 feet. The angle between the foul line and the LF wall is 94.6 degrees. The area of the triangle formed by home plate, LF foul pole and LF wall-CF wall intersection point is equal to the product of (0.5) (210.7)(347) (sin (94.6))=36,439 square feet. The infield area per your convention of range less than 150 feet is given by (30/360)(pi)(150)(150)=5,890 square feet. Thus the Coors Filed left field area is 36,439-5,890=30,548 square feet.
Errata: “Field” not “Filed” in the last sentence
Errata: 30,549 square feet vice 30,548
I’ve modeled the Coors Field outfield area with triangles and come to an area estimate of 97,869 square feet using trigonometry. Andrew’s estimate of 97,300 square feet is about six tenths of one per cent smaller. Here’s how my estimate and Andrew’s estimate compare for each of the three fields (in 1000 sq ft):
RF: 28.6 28.8
CF: 38.7 38.3
LF: 30.5 30.2
Total: 97.9 97.3
So I guess looking at your numbers above, I found the LF and LCF markings to be a couple feet deeper than what I got from diagrams, and the hittracker online diagram has the corner slightly off from the 60 degree point.
I don’t think any of these are major issues, as by your method you only came up with a very small difference. As to your previous point, it does speak to how many of these hittracker diagrams were created, but also as to how accurately real parks are labeled. I’m willing to accept that any of these distances may have a couple feet of error, but I think it’s still more complete and usable than anything currently available.
This is amazing. Thank you.
Wow. Lots of work went into this. Facinating for us geometry geeks.
One thing to note, however – I’m from St. Louis and the RF foul line is marked 335′, not 330′, which appears to be the baseline dimension for the rest of the calculation. This results in the calculated Busch Stadium dimessions being slightly off by a factor of 335/330 = 1.0151515…