Archive for Player Analysis

The Astros Might Not Need a First Baseman

A little over two weeks ago, Dave Cameron suggested here that the Astros might need a new first baseman. Last summer, they transitioned newly-signed Cuban prospect Yulieski Gurriel from third to first in hopes he would solve the Astros’ continual first-base issues. Gurriel did not live up to expectations, to say the least. In short, he displayed poor plate discipline as an extremely aggressive hitter, but did not hit the ball with enough authority to overcome his plate approach deficiencies (You can get the more detailed version in Cameron’s article).

However, since the exact day the article was released on April 11, Gurriel has been on a tear. He has accumulated 23 hits in 54 plate appearances, including five doubles and two long balls, to go along with eight runs scored and seven RBI. So, what has Gurriel changed recently?

In his 165 plate appearances in 2016 and up until April 11th, Gurriel posted an absurd 42% O-Swing%. The MLB average is just 29%. He paired that with a 76% Z-Swing%, nine percentage points above average. Gurriel was swinging at anything and everything thrown his way. Since then, he has lowered his O-Swing% to 34% and his Z-Swing% to 68%. Gurriel is showing much improved plate discipline, something he was vaunted for while playing in Cuba. It has not resulted in walks, as Gurriel has drawn only one walk since April 11th, but there is evidence as to why. Let’s look at this rolling average graph of Gurriel’s O-Swing% and Zone% across his career. As Gurriel has continually swung less at pitches out of the strike zone, the number of pitches he is seeing in the strike zone has grown. With more pitches in the zone, he has had less opportunity for walks.

Gurriel has taken advantage of the increase of strikes thrown his way. On his swings at pitches in the zone since April 11th, Gurriel has made contact 97% of the time. The MLB average for Hard% of batted balls from 2016-17 has been roughly 31%. Pre-April 11th, only 27% of Gurriel’s batted balls were hit hard. Post April 11, that number has skyrocketed to 44%. Gurriel is picking his spots now, and when he does decide to swing, he’s making contact. And hard contact.

Previously, pitchers were attacking outside of the zone, knowing Gurriel would swing and produce weak contact. With his decrease in aggression, pitchers have been forced to throw over the plate. Gurriel is sitting on good pitches to hit now, allowing him to make hard contact. The walks have not come yet, but if he continues to play like this, pitchers will learn not to throw in the zone to him. We are dealing with a relatively microscopic sample size here, but players don’t dramatically decrease their aggression just by chance. Gurriel’s current hitting is clearly unsustainable, as he is running a 253 wRC+ since April 11th, but if he continues to show the patience he is playing with right now, don’t expect him to revert back to pre-April 11th Yulieski Gurriel.

So, in summary, what has Gurriel changed?

Not a ton, it appears. He has simply just hit with more patience, which has trickled down into the rest of his game. Gurriel always had the ability to barrel up balls, but he was not showing it because he was not swinging at the right pitches. If Gurriel keeps doing what he’s doing, the Astros definitely won’t need a first baseman.

The Jose Altuve Adjustments

Out of the many differentiae that make up José Carlos Altuve’s thumbprint on baseball, from his 5’ 6” stature, to getting cut from his first tryout with the Astros but showing up the next day anyway, his groundball percentage would likely not rank toward the top for most fans of the Venezuelan. However, most of said fans have not seen this graph.

As you can see, after decreasing his rate consistently for four seasons, Altuve is hitting more groundballs and hitting more balls toward right field in 2017 than at any other point in his career. Although this is in a sample of just 88 plate appearances, and may be a statistical blip, I think that with a hitter like Altuve it is worth investigating.

Altuve’s BABIP is also a high, even for him, .393. Apart from being the most satisfying stat to say out loud, BABIP is also the one thing that alters early-season statistics more than any other, but .393 for Altuve isn’t like the clearly unsustainable .455 that Steven Souza Jr. is currently running. It’s just .044 points higher than his last season rate, so while it’s probably not sustainable (DJ LeMahieu led the league in BABIP last year at .388) it’s not lifting him to his 134 wRC+ by itself.

So what’s the reason for this? Is it a change in approach? A reaction to what other teams are doing? Teams don’t appear to be shifting Altuve, so it doesn’t look like he’s trying to beat them by hitting grounders through an open hole. It does, however, look like maybe teams are attacking him down and away slightly more than in the past. Here are Altuve’s heat maps the last two seasons.

2016

2017

There does appear to be a slight uptick in balls in the bottom corner of the zone, but it’s hard to call it a novel trend when the basic strategy against Altuve since he came into the league remains basically the same: down and away.

But the story doesn’t end there! There are two things that do appear to be starting a trend.

First, his Zone% (meaning the percent of the time that opposing pitchers throw him a strike) has been consistently trending downward since he came into the league. It’s currently at 46% according to Trackman, which is the lowest mark of his career.

Second, his Fastball%, according to Baseball Info Solutions, is at 49.7%, which is also a career low, and actually over 8 percentage points lower than the rate he’s seen in his career.

Now, this all makes intuitive sense. Altuve’s power has risen in recent seasons, and it looks like pitchers have adjusted accordingly; no surprise there. What I thinks is worthwhile in all this is that Altuve is adjusting right back. Before this past weekend in Tampa Bay, Altuve had no home runs on the year. He’s been going with what pitchers have been throwing him. They want to throw him offspeed down and away, and he’s been going with it, exchanging some of the power he took last year to keep his overall offensive profile as one of the league’s elite hitters.


Jacob deGrom’s Encouraging Adjustment

Jacob deGrom struck out 10 batters in his fourth start of the 2017 season. He also walked six and gave up three earned runs on eight hits. The statline alone might tell you it was his weirdest game of the year, and maybe his worst.  

Before that, in his third start, he went seven innings and struck out 13.  He allowed back-to-back dingers early and then took control of the game, allowing only three more baserunners the entire night. His pitches were humming like a barbershop quartet. That statline makes it sound like his best start of the year.

But it wasn’t.

No, that would be his second turn, on April 10 at the Phillies, where he only struck out three. He also walked two and gave up six hits in six innings. That sounds terrifically pedestrian until you realize how he did it.

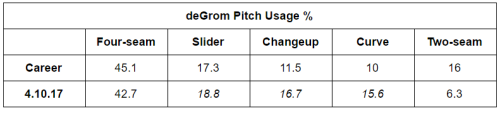
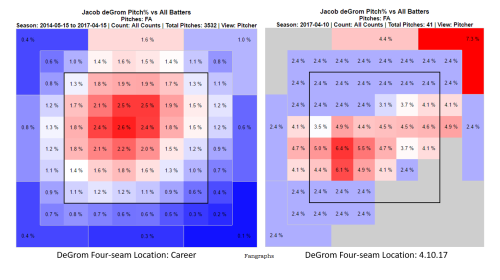
We can start with his fastball, which was a big reason he labored through 31 pitches in the first inning (he only threw 96 all night). Compared to where he’s located it through his career (left), it was all over the place that night (right). It contributed to six men reaching base in the opening frame. He also gave up both walks then, one of which came with the bases loaded. And then Brock Stassi came to the plate and worked a 2-2 count. deGrom threw a changeup, induced an inning-ending double play, and transformed for the rest of the night.

image


image

Equal pitch distribution is always interesting. It can speak to a lack of predictability and according effectiveness. But seeing it so even among the slider, curveball, and changeup in this way is more than interesting; it’s relatively unprecedented. Historically, I couldn’t find anyone whose pitch mix has broken down that way for their career.

That’s significant for a few reasons. First, it could explain why Phillies hitters ended up struggling when deGrom seemed to be on the ropes. I could hardly believe they didn’t do more damage as Stassi hit into the double play. But the rally faltered because deGrom had already started to adapt, and in a way that hitters simply aren’t exposed to. In that context, and considering the Phillies aren’t exactly Murderer’s Row, it’s not so strange.

The slider-change-curve pitch mix also speaks to the importance of an effective fastball. With an unreliable four-seamer, deGrom basically ignored his two-seamer. Maybe he did that because if he couldn’t locate the straight one, he figured the alternative that has four to five more inches of movement was no good, either.

But more than anything, deGrom’s adjustment that night was compelling because we’re in an age of sport where we constantly hear about guys unleashing their egos to achieve eminence. And he went the other way.

Alec Fenn of BBC delved into ego’s place in sports. He spoke with confidence coach Martin Perry, who tells how some of the most exceptional players “don’t see risks; they have a bulletproof certainty they’ll produce and [with that] supreme level of confidence, magic can happen.”

Perry compares ego to the stuff of Harry Potter and Disney World, around which entire entertainment universes have been built. For all the mystique ego can produce, it’s no wonder we speak about it so lustfully and embrace it so openly.

A pitcher is provided more opportunity to drive a game with his ego than any other player because of his involvement in every play. On that night in Philadelphia, Jacob deGrom was determined to assert himself and beat the Phillies by establishing his fastball, as any pitcher would try. When it didn’t work, he walked away from his ego but maintained bulletproof certainty. He went with the flow. He didn’t get the win but was a huge reason the Mets did, and gave us a glimpse at an alternative route to success in the process.

—

data from FanGraphs


Important Michael Lorenzen Update

Michael Lorenzen has made some headlines this year as a hitter. He hit a home run! He has a 232 wRC+! Wow! But here’s an interesting tidbit about him you may not have known — he also pitches occasionally! As I’m typing this, he has pitched 11 innings with a 9.82 K/9 and a 2.45 BB/9, a pretty good start which suggests that his 5.73 ERA will come down soon. The most interesting part to me, though, is that he is getting these results in a completely different manner than the way he pitched in 2016.

We took a look at Michael Lorenzen’s 2016 season a little while back and noted that while he was throwing his sliders very hard, he simply wasn’t getting any results with them. Thanks to the Statcast search at Baseball Savant we can take a look at his 17 sliders this year. The first thing that jumps out is the velocity — he is averaging 86 MPH on his slider, significantly down from the 91.5 MPH average in 2016. In fact, he’s maxed out at 89 MPH this year, which means his average slider velocity from a year ago is two ticks higher than his maximum slider velocity this year. And that’s with everyone’s velocity looking higher this year.

But the second thing that you’ll notice is that the results when he throws the slider are really good:

Michael Lorenzen Sliders by Result, (early) 2017
Result Count
Ball 3
Called Strike 4
Foul 2
Groundout 3
Flyout 1
Swinging Strike 4
SOURCE: Baseball Savant

In 2016 Lorenzen threw 67 sliders of 94+ MPH and got four swinging strikes. He already has that many swinging strikes on his sliders in 2017, in only 17 pitches. He’s yet to allow a base hit on the pitch, and has only missed the zone three times. This is a pitch that’s really become a weapon for him, after being a serious liability last year.

Now if that were the only thing that’s different about Lorenzen, it would be fairly interesting. But it’s not. Based on results alone, he looks like a completely different pitcher than last year:

View post on imgur.com


Last year his cutter was his best pitch; this year it’s been his worst. Last year his slider was his worst pitch; this year it’s been slightly above-average. Now, just like in every other baseball article you’ll read this month, I will include the caveat that it’s early. But to see this kind of a swing in results is intriguing. I would suspect he’ll be going to his off-speed stuff a bit more in the coming months. It’s working for him, and it might help make his fastball look even faster. Don’t get distracted by his hitting — his pitching is the thing to keep an eye on. He’s put bits and pieces of it together in the past, and if he can put it all together now, watch out.


Jeff Samardzija’s Ongoing Breakout

Early in the baseball season, I’m always checking the statistical leaderboards to see who sticks out. Sometimes it’s a batter with an incredible ISO (Thames), a hitter with a laughably low BABIP (Schimpf), or in this case, a pitcher whose swinging-strike percentage sits significantly higher than his career mark (Samardzija). While we’re only a few weeks into the season and the simple reasoning that small sample sizes shouldn’t be trusted looms large, occasionally a player makes a change that draws my interest. In Jeff Samardzija’s case, dating back to the last few months of the 2016 season, he’s undergone a noticeable modification in his pitch peripherals.

Pitchers are always making adjustments. Adding in new pitches, subtracting some from their mix, or altering a pitch to complement the rest of their offerings. While it shouldn’t come as a surprise when a pitcher does tweak a pitch, it stands out when the results are as drastic as Samardjiza’s. Let’s take a look at Jeff’s horizontal pitch movement for three of his most-used pitches dating back to the start of the 2016 season to see if anything jumps out.

Horizontal Movement

Month Sinker Slider Split
3/16 -9.74 1.16 -6.47
4/16 -9.70 1.11 -6.96
5/16 -9.55 1.17 -8.13
6/16 -9.62 0.34 -7.45
7/16 -9.68 -1.35 -5.75
8/16 -9.71 -0.83 -5.77
9/16 -9.84 -0.25 -5.57
10/16 -9.35 -0.60 -6.08
Month Sinker Slider Split
3/17 -9.42 -0.97 -6.65
4/17 -10.10 -0.01 -6.76


Nothing crazy happening here, other than a slight shift in the movement of his slider. It went from breaking away from righties, to not breaking at all. A difference of about an inch or two which can certainly add up under the right context. Now, for the vertical movement.

Vertical Movement

Month Sinker Slider Split
3/16 4.77 1.10 4.27
4/16 4.89 1.19 5.22
5/16 4.28 1.47 2.97
6/16 4.18 2.56 2.89
7/16 4.93 3.75 5.15
8/16 4.87 3.02 4.13
9/16 4.91 3.22 4.01
10/16 6.26 3.68 4.45
Month Sinker Slider Split
3/17 5.17 5.39 4.51
4/17 6.63 6.07 4.97


Over the course of the 2016 season, the continued refining of the slider is quite apparent. Consistently, month over month, the pitch featured less vertical movement than before. This mix of pitches starts to form around July to August of last year, and takes a huge step forward in 2017. The difference in vertical break between the three currently sits at less than an inch and a half.

Think about that from a batter’s perspective. Three pitches, all coming in with comparable downward break, yet two will feature severe break in on a right-handed hitter (sinker and splitter) and one won’t break in at all (slider). The batter is left guessing about which lateral direction the pitch will go in its final moments before crossing the plate. Previously, with a noticeable difference in vertical movement, the hitter had a better idea of what pitch was coming in. He could see the drop associated with a slider, leading to a more confident prediction of how the pitch would break. While the sinker is thrown harder, around 93, compared to the slider and splitter, both around 85-87, the combination of the three seems to have thrown hitters for a loop, as evidenced by the stark increase in whiffs.

Whiff Percentage

Month Sinker Slider Split
3/16 9.30 23.08 16.67
4/16 5.26 12.00 2.94
5/16 5.88 10.78 8.57
6/16 5.65 13.95 15.38
7/16 4.67 16.10 0.00
8/16 6.50 7.55 26.32
9/16 6.17 11.11 20.35
10/16 5.56 11.11 25.00
Month Sinker Slider Split
3/17 7.14 23.33 40.00
4/17 8.41 20.75 27.59


Notice how, starting in August of 2016, the splitter features a huge up-tick in whiffs. This was right when Samardzija was altering the vertical movement of the three to mask their identities. By this season, when the three became even closer in nature, the whiffs skyrocketed. The batter’s utter confusion in trying to classify each offering results in more whiffs.

Samardzija certainly seems to be onto something here. Again, while this is a small sample, it makes me wonder about usefulness of quantifying pitches individually by their velocity and movement. Before, his slider featured more movement, yet Jeff’s cumulative whiffs were lower overall. Once he changed the pitch to look more his like other offerings, the results improved. Perhaps a more holistic approach is necessary when we look at a pitcher’s individual pitch performance. How effective a pitcher’s repertoire appears is more than a sum of its parts, as seen in Samardzija’s recent changes.


Francisco Lindor: Challenger to Trout’s Throne

Francisco Lindor has seemingly always been the platonic ideal of a shortstop since was drafted eighth overall in 2011. Most shortstop scouting reports contain phrases like “if he can stick at the position” or “will likely move off the position as he develops,” but Lindor was the rare prospect that scouts universally believed to be a shortstop. Lindor was clearly a major-league shortstop, but whether he was an everyday player or All-Star hinged on his bat. In his first season, Lindor showed his bat belonged in the majors, hitting .313/.353/.482 for a 126 wRC+ with 12 home runs and stolen bases in just 99 games. Defying calls for regression, he followed up with a .301/.358/.435 line for a 112 wRC+ in 2016, while essentially tying Brandon Crawford as the most valuable defender in baseball. He was Andrelton Simmons with a bat.

However, it appears Lindor isn’t satisfied with being a perennial All-Star. He is gunning to dethrone Mike Trout for American League MVP. In a mere 42 PA in the 2017 season, Lindor already has four dingers and is topping the offensive leaderboards with a 216 wRC+. While Lindor has yet to collect 50 plate appearances this season, there are indications that Lindor has taken another step forward and will frighten pitchers as much as he does ground-ball hitters. Read the rest of this entry »


How Aaron Judge Can Turn the Corner

Yankees right fielder Aaron Judge is, to say the least, an imposing figure in the batter’s box. Judge is one of only three position players in baseball history with a height and weight of at least 6’7” and 255 pounds, respectively – the other two, for those curious, being 1960s power hitter Frank Howard and current Tigers minor league Steven Moya – and with his enormous size comes enormous strength. According to Statcast, 59.5% of Judge’s batted balls last season left the bat with an exit velocity of at least 95 miles per hour, a mark that trailed only those of the Brewers’ Domingo Santana and the Mariners’ Nelson Cruz. Further, Judge’s average exit velocity ranked second among the entire league, with only Cruz ahead of him. However, the player comparison that most swiftly comes to mind is the Marlins’ Giancarlo Stanton, who, incidentally, finished third in average exit velocity last season. When Judge truly barrels up the ball, as exemplified here, his raw power tends to elicit the type of awe usually reserved for Stanton.

Unfortunately for the Yankees, Judge was largely unable to capitalize on this strength in 2016. Although he only saw 95 plate appearances, he batted an uninspiring .179 with an astronomical 44.2% strikeout rate. Even his ISO, above average at .167, was still disappointing for a player claiming raw power as his most prominent attribute.

The Yankees, of course, were fully aware that their right fielder’s approach at the plate needed an adjustment. Said Yankees assistant hitting coach Marcus Thames during spring training:

“I thought [Judge] started expanding a little too much… At the big-league level, the game’s a little bit more physical, it’s a little bit faster and I thought it sped up on him a little bit and he started expanding.”

A cursory look at Judge’s 2016 batting statistics plate surprisingly suggests that plate discipline may not be as big a problem as one would expect based on Thames’ comments. Among 451 position players with at least ninety plate appearances in 2016, Judge’s O-Swing percentage was tied for 119th at 33.6% (27th percentile), and his Z-Swing percentage of 63.5% ranked nearly identically, at 112th (68th percentile).  Judge, surprisingly, rated fairly well in both measures: he chased far fewer balls than the average hitter, and he swung at a healthy percentage of strikes.

His contact rates, on the other hand, did not inspire quite the same sanguinity. Last season, Judge ranked dead last in overall contact percentage, as well as on pitches outside the strike zone. On pitches inside the strike zone, his contact percentage saw a slight improvement relative to his peers, but still ranked 42nd from the bottom. BaseballSavant’s pitch heatmaps suggest that Judge seemed to have the most difficulty with low and away pitches, both in and out of the strike zone. The following graph displays the locations of Judge’s swinging strikes from 2016 (not including foul balls):
2-Judge[A-SwingingStrikes]

As the preceding heatmap illustrates, the crux of Judge’s contact problems occurs in the low-and-away portions in and around the strike zone. However, a heatmap of Judge’s hardest-hit balls (exit velocity >= 100) shows that Judge’s best contact occurs on pitches that aren’t located anywhere near the low and away sections of the zone. In fact, the pitches Judge hits best are on the inside half of the plate:

2-Judge[B-100MPH]

Now, let’s see where Judge’s weaker contact (exit velocity <= 99) falls in the strike zone.

2-Judge[B-99MPH]

So, low and away pitches not only induce a league-leading whiff rate for Judge, but even when he does manage to connect, he connects with his weakest exit velocity. Marcus Thames’ comments, therefore, may require a slight adjustment: Judge didn’t necessarily expand the zone in 2016, but he certainly didn’t make the most efficient use of it. Courtesy of Brooks Baseball, the following graph illustrates Judge’s 2016 whiff rate by zone:

2-Judge[C-WhiffRateX]

From these charts, we can observe Judge’s whiff rate slowly rising from left to right (inside to outside) across the strike zone. To cut down on his high swinging-strike rate, which was the third-highest in the league among those 451 batters, Judge should reduce his swing rate on low and outside pitches – at least, until the count or game situation demands a more aggressive approach. Ahead in the count, however, Judge should look primarily for the middle-in pitches that have produced better and more frequent contact. He shouldn’t even consider swinging at anything on the outer sections of the plate, as he did last season while ahead in the count (heatmap from FanGraphs):

2-Judge[E-AheadInCount]-FanGraphs


As of Tax Day afternoon, the Yankees are only 11 games into the season, so it’s admittedly a bit early to draw any major conclusions. Even so, we should note that Judge has shown signs of legitimate improvement over last year’s campaign. In 33 at-bats, Judge is slashing .276/.364/.621, and although a 175 wRC+, .345 ISO, and 50% HR/FB rate are all but guaranteed to decline, there’s still reason to believe that Judge has made significant strides in his approach at the plate. Last year, Judge saw the 18th lowest percentage of fastballs in the league at 49.8%, a percentage that this season has dipped even further, to 45.5%. Pitchers, expecting Judge to flail as in 2016, have fed him a steady diet of low and away breaking balls. The following chart reflects all off-speed pitches Judge has faced to date in 2017:

2-Judge[D-17Offspeed]

Even with this steady diet of low and away breaking balls, Judge has managed to cut his O-Swing% from 34.9% to 23.9%, and his swinging-strike percentage has fallen from 18.1% to 12.0%. This is especially impressive considering that, like last year, pitchers have thrown him a fairly low percentage of strikes (about 41%).

The Yankees have lots of reason for optimism regarding their young slugger. As the starting right fielder in Yankee Stadium’s less-than-spacious right field, Judge’s value to his team will derive mostly from his batting output. If Judge can consistently lay off of the low and away pitches that gave him problems last year, he’ll have more opportunity to mash the balls that find the inner half of the plate – like this beauty from last Wednesday. If his early 2017 performance is any indication, Judge’s offseason adjustments have the potential to transform him into a Giancarlo Stanton-caliber power hitter.


What Happened to Adam Wainwright?

At 24 years old, Adam Wainwright burst onto the scene, closing out the 2006 World Series and bringing the Cardinals their first championship in almost 25 years. Over the next 10 years, he was the opening day starter five times and racked up the 7th-most wins of any pitcher despite missing the entire 2011 season and most of the 2015 campaign. If you prefer to measure a pitcher’s performance in Wins Above Replacement as opposed to wins, Wainwright was still a top-10 pitcher from 2007-2016.

Adam Wainwright

If you’re still not convinced, he finished in the top three of Cy Young voting four times and received MVP votes in 2009, ’10, ’13, and ’14. By all accounts, Adam Wainwright was an elite player for the better part of a decade, even after recovering from Tommy John surgery in 2011. Still, by all accounts, he has been anything but elite since.

What happened?

In 2014, Wainwright’s last dominant year (6.1 WAR), he threw almost 230 innings on his way to a 20-9 record with a 2.38 ERA. Since then, he has posted a 4.35 ERA — almost a full 2 runs worse than 2014. Is this just the decline that comes with age, especially as he pitches in his age-35 season? Is it lingering effects from his devastating Achilles injury in early 2015? Admittedly, it’s probably a combination of both. They key, however, is the pitch he used to break onto the scene way back in 2006.

hrlpgo.0.gif

The curveball, which was his go-to pitch for years, is no longer devastating hitters with the consistency that it once did.

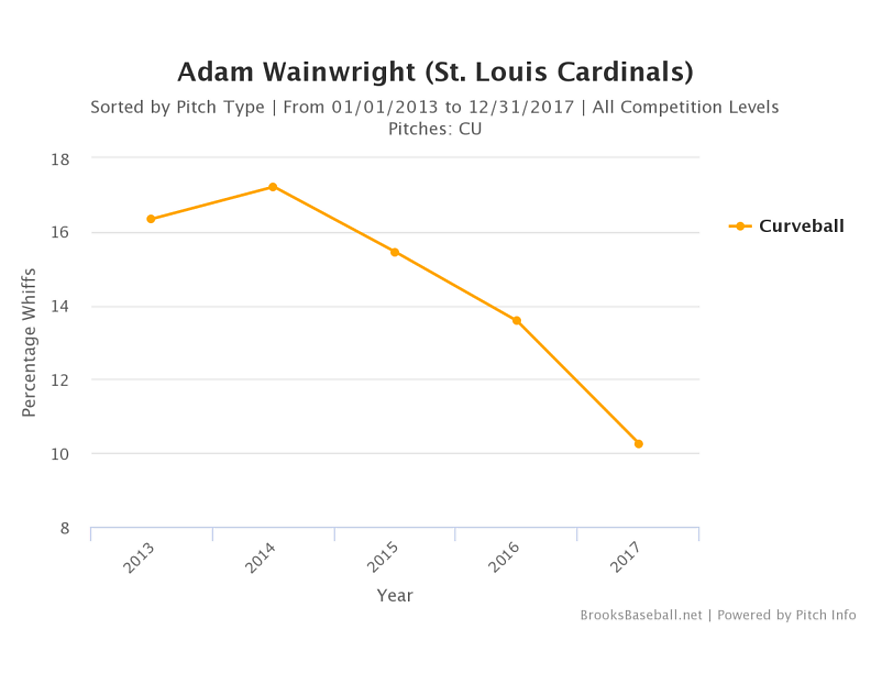
There has been a consistent decline in the percentage of whiffs Adam gets on his curveball. It peaked at 17.22% in 2014 and has fallen to 10.26% early in 2017 — a 40% decrease.

Curveball Whiff Rate

But a decreasing whiff rate doesn’t necessarily mean the pitch is failing him; maybe the batters are just making more contact?

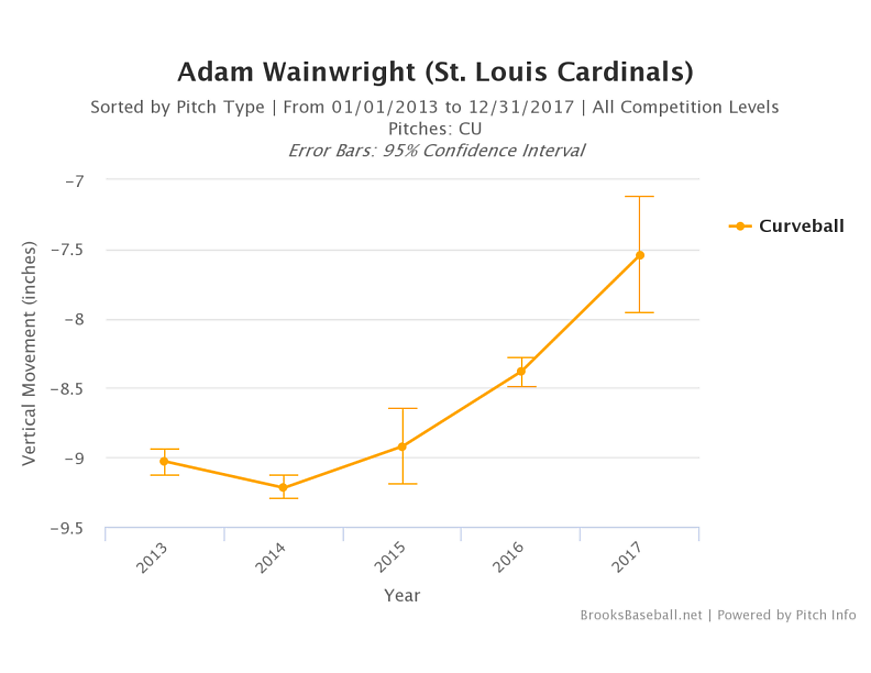
When looking at how the vertical movement of his curveball has changed over the last few years, it is evident that the pitch has regressed.

Vertical Curveball Movement

From 9.22 inches in 2014 to 7.54 inches in 2014, the movement on Wainwright’s curveball has decreased by almost 20%. No wonder the whiff rate decreased by so much — the curveball doesn’t have the necessary movement to trick hitters.

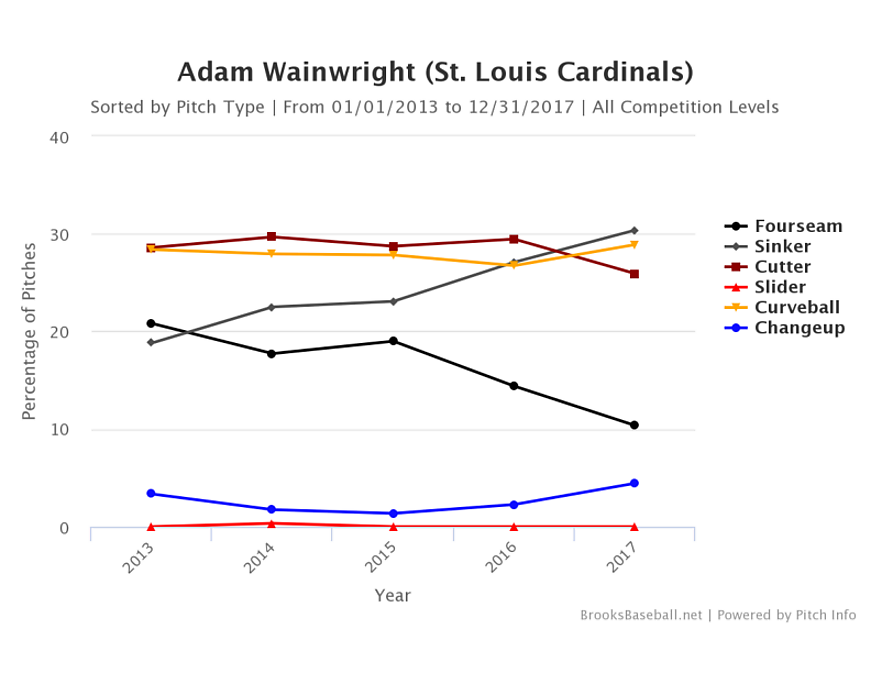
This is probably a result of age. How many pitchers maintain the efficacy of their best pitch for their entire careers? None. But the most important thing to do, especially with a curveball, after realizing you can’t get the ball to move like you once could, is to selectively pick when to use it. If Wainwright used his regressing curveball more sparingly, it might be more successful. Instead, he has taken an obviously less effective pitch and increased how often he uses it.

Pitch Usage

Wouldn’t it make sense to use a decreasingly-effective pitch less often? As you can see, instead of markedly decreasing how often he uses his curveball, the long-time Cardinals ace actually increased its usage rate. Now, the graph shows a variance of only a few percentage points — relatively insignificant. Notably, the 28.89% usage rate is the most Wainwright has ever used his curveball.

Let’s do a quick recap. Adam Wainwright is not getting whiffs from hitters because his curveball doesn’t have the movement it once did. And instead of lowering its usage rate, he increased it to an all-time high.

What should we expect to happen when a less-effective pitch is used more and more?

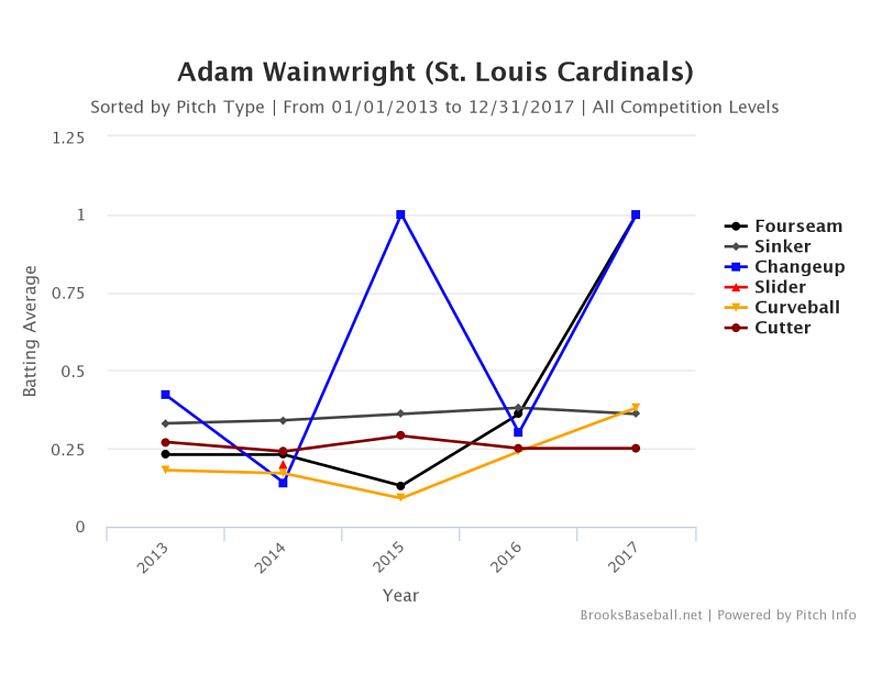
Batting Average by Pitch Type

The batting average against his curveball has risen to .380 in 2017 — more than doubling since 2014. This is alarming. It leaves hitters hoping Wainwright throws them a curve — a stark contrast from a pitch that used to buckle knees.

Recently, we’ve seen less of Wainwright’s dominant curveball, and more of his less-effective curveball, leading to more hits, runs, and losses. Wainwright’s success is directly linked to the effectiveness of this pitch. While it may no longer be elite, it can be effective if he saves it for the right moments.


Platooning Kolten Wong and Jedd Gyorko

Last week, the Cardinals announced that Kolten Wong would be part of a platoon with Jedd Gyorko. As Mark Saxon noted, Wong did not react well to the news (although he later clarified that he would prefer to stay in St. Louis). Kolten and the Redbirds agreed to a five-year, $25.5-million contract last spring, but what might have served as a confidence booster for the young second baseman resulted in a slash line of .240/.327/.355 over 121 games.

The reason for this platoon is Gyorko’s bat. He did lead the Cardinals with 30 home runs in 2016, a number that had him tied for 11th in the National League. But is Gyorko that much better offensively to offset Wong’s defensive attributes?

Let’s look at this from two different perspectives: in the field and at the plate.

In the Field

Using data from 2015 and 2016, Wong and Gyorko played over 1000 innings at second base — a large enough sample size to use in an analysis. Examining the Ultimate Zone Rating per 150 games (UZR/150), we see that Kolten and Jedd have scores of 3.1 and 4.2, respectively. So, while Gyorko seems to have an advantage here, over the course of a 162-game season, this is a relatively insignificant difference.

Looking at Def, which measures the number of runs above or below average a player is worth, we see that Wong scores 8.2, while Gyorko scores 5.3. According to FanGraphs Rules of Thumb for interpreting this statistic, both players are between “above average” and “great defenders.” Wong’s advantage here equates to about 1/3 of a win. Again, no significant difference in their fielding abilities.

If we look at the Inside Edge Fielding statistics from FanGraphs, we see, as a whole, that Kolten makes more difficult plays, but Jedd makes the easier play a greater percentage of the time. For instance, look at the percentage of “unlikely” plays that each player made. An “unlikely” play is a play that is made 10-40% of the time. Kolten made 27% of these plays, while Jedd did not make a single one. At the same time, looking at plays that are “likely,” Kolten made 73% of them, while Jedd made significantly more (88%).

An analysis of these statistics shows us that, in the field, Kolten may make more web gems, but Jedd is the more consistent everyday second baseman. Nevertheless, there is not much separating these two on the defensive end.

At the Plate

At first, this part of the debate seems relatively simple. Gyorko led the team in HRs last year, he is clearly the much better hitter, right? Let’s take a look. At first glance, the players look very similar, with Jedd posting a line of .245/.301/.445 and Kolten producing a line of .254/.323/.375.

One key aspect of a platoon is starting the right-handed hitter against southpaws and vice versa. So let’s look at the zone profiles.

Kolten vs. Righties

Jedd vs. Lefties

Kolten is, far and away, the better hitter in this platoon in terms of average. But Gyorko’s greatest success was his power, right? So let’s look at the slugging zones.

Kolten slugging vs. Righties

Jedd slugging vs. Lefties

Although there are places where Jedd has the higher slugging percentage, Kolten has slightly lower, but similar zone ratings over a longer period of time. Even with advanced statistics, these two players are very difficult to separate.

By the eye test, Kolten seems to have the advantage in the field, but the statistics tell us that these two players are actually very similar. In addition, Jedd seems like the better hitter, but the statistics tell us that, again, they are very similar. Perhaps there is one thing that we can glean from this analysis: Kolten should be put in a place where he can reach base in front of players who drive the ball and Jedd should be placed where he can drive runners in.

To respond to the question asked at the beginning, should this platoon continue? The statistics tell us yes. As a younger player who just signed a large extension, Kolten has more upside. However, if we are to make a decision for this year, not the future, the numbers tell us that the platoon should continue because neither player has separated himself from the other.


Luis Severino, a Changeup, and a Little Bit of Luck

Luis Severino had a great 2015 in his two-month debut, and was supposed to take a big step forward in 2016. Luis Severino took a big step backward in 2016. He was sent back to Triple-A in May, and when he came back late in the season, he was almost exclusively used as a reliever (albeit with incredible results). The reason for his struggles is pretty clear, even on the back of his baseball card – a 1.39 HR/9 rate. So clearly, the homer problem is what we’ll be looking into today, but what if I showed you this?

Severino 1

*as SP

You’ll see that I only used his numbers as a starting pitcher; they would be skewed in his favor if I included his dominant innings as a reliever. Even so, the number of fly balls were extremely low, he wasn’t being hit very hard…in fact, he was generating a lot of infield pop-ups and a lot of soft contact in general. This is the opposite of what one would expect from a pitcher with a homer problem. It gets even weirder.

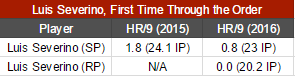
Severino 2

His issue in 2016 was homers, but in the roughly one-third of his innings as a starter in the first time against an opposing batting order, he beat the league average and his own 2015 mark, which had actually been below league average. And for good measure, in the other roughly one-third of his innings that he was a relief pitcher, he gave up zero home runs. That’s befuddling. But there is a silver lining to this; we now know where the problem is. Clearly, Severino’s problems lie in the second and third time through the opposing order. We can finally find the glaring problems there.

Severino 3
Severino’s problems can be summed up in this table. While his groundball rate was still healthy and even above league average, there was still a significant decrease from the 51.9% mark he posted in 2015 in the same circumstances. When his groundball rate dropped, his line-drive rate rose to the point that would tie Mike Fiers for the league lead (and that isn’t a good thing). So the increased line drives were part of the problem, and as the saying goes, increased line-drive rate equals higher BABIP. In Severino’s case, “higher” means .394, which is, by the nature of the statistic, absolutely unsustainable. Additionally, the 3.0 HR/9 is extremely ugly (as expected, since this is where we deduced the homer problem to be), and yet the HR/FB rate can expect positive regression as well.

Now, before we pin all of Severino’s troubles on luck, let’s remember that he is responsible for turning those ground balls he was getting in 2015 into line drives. Severino went from throwing his changeup 12.8% of the time in 2015 to only 8.9% in 2016, essentially becoming a fastball/slider only pitcher. Without an offspeed pitch or even a third offering of any sort, Severino naturally became rather predictable as the game went on. I am not sure exactly why Severino scrapped his changeup, and this Eno Sarris chart you’re about to see will only puzzle us further.

eno sarris changeup

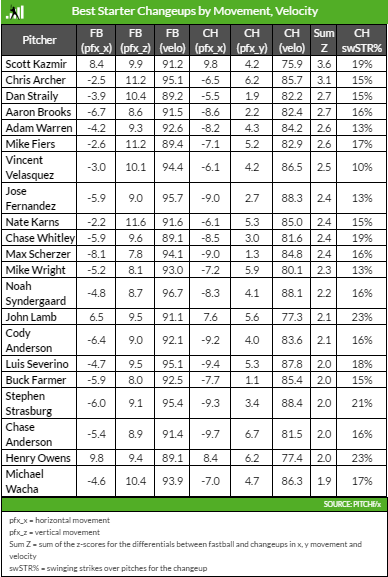
The entire article deserves a full read for context, but by Sarris’ metric, Luis Severino had the 16th-best changeup among starters in 2015. Maybe there are some imperfections with PITCHf/x, maybe the sample size was too small, but batters only hit .222/.323/.259 against it, so the results back up the metric. That kind of effectiveness would have gone a long way for Severino in 2016. To the Yankees’ credit, the only instructions they gave Severino when he was sent back to the minors were to work on his changeup. Later in the season, after the Yankees called him back up to New York, Severino was deployed as a relief pitcher, allowing him to continue his two-pitch ways.

Clearly, there are two factors we were able to pin down that derailed Luis Severino. Some of the problem for him was terrible luck, as the .394 BABIP and 31.0% HR/FB are likely to come back down to earth. Some of the problem was self-inflicted, like the abandoning of his changeup, which at 57.9% in 2015 was a groundball machine, leading to more line drives in 2016. The recipe for success is there for Severino, both in his right arm and in the wishes of the Yankee management. Take spring-training stories for what you feel they are worth, but it sounds like Severino is working on reincorporating that 2015 changeup back into his repertoire. If it is indeed back, beginning with his first start scheduled for April 7, expect Severino to take the step forward in 2017 that he was supposed to take in 2016.

All stats via FanGraphs