Archive for Player Analysis

The Jeff Samardzija Experiment

Jeff Samardzija is incredibly frustrating at times.  For the first few months of 2016, Giants fans saw a pitcher who would more than earn the five-year, $90-million contract he had signed in the offseason.  In April and May, Samardzija posted FIPs of 3.67 and 2.45, as well 11.9% and 19.1% K-BB rates.  Those numbers are pretty worthwhile considering Samardzija has forged himself into a workhorse, averaging over 200 IP over the past four seasons.  The Giants would be plenty happy with that for a full season.  All seemed well in Giants land.  The free agents were proving their worth, Madison Bumgarner’s greatest concern was with his own hitting (that may always be true), and Buster Posey was healthy.  The even-year sorcery seemed to be working.

June and July came around, though, and Samardzija saw himself regress into what looked like the 2015 version of himself.  In June and July Samardzija posted FIPs of 7.09 and 5.06.  Samardzija was giving up homers at an alarming pace and he was desperately struggling to strike people out.  Oddly enough, Samardzija was drastically altering his pitch mix in the middle of the year.


Holy cow.

That looks experimental more than anything else.  For Samardzija to maintain his level of performance even in his good months is pretty solid given such drastic changes in pitch mixes.

For reference, here is Samardzija’s FIP throughout the course of last year.


You can see the success I mentioned earlier before June and July came around, but Samardzija also set out on a strong end to the season, posting a 3.67 FIP in August and a 2.38 FIP in September/October to somehow bring his FIP below the league average.  That final stretch also saw Samardzija posting a 21.8 K-BB% as well, maintaining a similar walk rate he posted all season while striking out 28.6% of batters.

Staring through the bevy of pitches Samardzija featured through the season, you can see where he was getting to in the end.  He almost entirely ditched his cutter and found a balance between his four-seam and two-seam fastballs.  The curveball usage held steady, the slider usage went down, and the splitter continued to emerge as a favorite.  The splitter usage has appeared to come about as Samardzija’s neutralizer towards lefties, and it has worked well.  Lefties have given Samardzija trouble for his whole career and the near-60-point difference in wOBA versus lefties last year is fairly alarming (.331 vs .276), so an offspeed pitch that moves away from lefties is crucial.

That splitter itself is fairly similar in movement to Masahiro Tanaka’s.

Samardzija: -6.7 x, 3.9 z

Tanaka: -6.7 x, 3.3 z

Should Samardzija use the splitter versus lefties as much as Tanaka does (nearly 30%!) and locate it as Tanaka does (low and away from lefties), it should be effective, given his SwStr% with the pitch throughout his career (19.5%).

Here is Samardzija in his last tune-up before the season.

(Skip to 0:13 for the nasty nasty.)

In those final two months last year, Samardzija was able to continually do better against righties while limiting lefties to a somewhat manageable .410 SLG.  Should Samardzija maintain a similar pitch mix, he would look more like his four-win 2014 campaign.  Pitching isn’t that simple, but he’s making his way back to something that had worked quite well for him in the past.

The 2016 Giants season became all about the monstrous second-half collapse, but hidden in there was a bit of a Jeff Samardzija resurgence.  In 2017, Samardzija will almost assuredly be worth his salary in durability alone.  But if he can continue to utilize his splitter as he had toward the end of 2016, I would expect him to outperform his projections (Steamer 3.84 ERA 3.78 FIP 4.09 xFIP) and deliver a performance more in line with his 2014 season.  The Giants rotation already runs deep, but they could be looking at one of the most durable and effective groups of front-line starters in the game.


Vince Velasquez Is the Future of the Phillies, If…

On April 7th, Vince Velasquez pitches the Phillies’ home opener. His electric talent makes him a linchpin for the team’s plan to return to contention, and his four-seam fastball could be the key. It’s his best pitch, and it had the 12th-best weighted value among pitchers who threw at least 130 innings last year. MLB’s 5 Statcast Storylines for the team features him and the 27.4% swinging-strike rate he got on it, tops in the league.

And oddly, even more than his dubious health, it could be his biggest obstacle to stardom.

Corinne Landrey at Crashburn Alley found that Velasquez was in the top 15 for overall fastball usage last year, and top three in two-strike counts. Immediately, we could reason he threw it too much, even when acknowledging the rankings above. But it’s worth noting how, exactly, it looked.

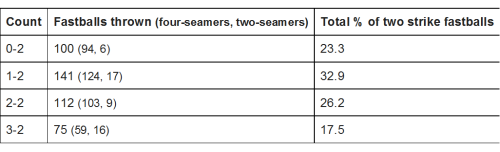
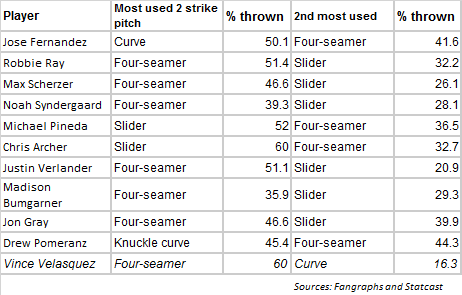
380 of his 428 two-strike fastballs were four-seamers. They accounted for 60% of his two-strike pitches. It’s not just that he threw a ton of heat when hitters had their backs against the wall. It’s that he didn’t use his secondary offerings to keep hitters honest.

image

The top 10 qualified pitchers by K/9 last year  —  and some of the best pitchers in the game  —  present various paths that can be taken with two strikes. The range between their most used and second-most used pitches in those counts goes from 1.1% to 27.3%. The range for Velasquez screams from the page: 43.7%.

It might be easiest to think of this like kids on a seesaw. His four-seamer was like a particularly stout kid (maybe Billy Butler) and his curveball was like a particularly scrawny kid (say, Jose Altuve). The way he used these pitches in two-strike counts didn’t lend itself to a fluid, balanced approach during the most advantageous situations.

The problems Velasquez’s fastball created were subtle because overall it was so good. Guys weren’t driving it out of the park or putting up crooked numbers against it, but they were letting him wear himself out. While he got a whiff nearly 26% of the time in a two-strike count when using his four-seamer, there was also better than a 2:1 chance the at-bat would continue because it was either fouled off or called a ball. The foul balls were a major reason he worked a ton of deep counts last year, and what made making it through even six innings a coin flip all year.

There’s a chance that could be due to where he was locating his heat, too.

A look at his heat maps shows Velasquez hammered the zone with his four-seamer when behind (left). When ahead, as he would be with two strikes, he threw it higher (right). That’s generally good when thinking about sequencing, changing the eye level of hitters, and possibly the concept of having a pitch to spare.

But Velasquez’s fastball is a riser  —  it averaged 9.75 inches of positive vertical movement last year, or about a full inch more than the league average. While the maps of different counts will show slightly different locations, the big picture suggests his four-seamer could have been easier to take when higher in the zone because hitters and umps alike perceived it was already up.

Landrey also found that Velasquez was beginning to favor his changeup toward the end of the year as a lead secondary offering. While that’s positive, it’s bizarre that it took so long to show up in the majors since it was lauded through the minor leagues. Right now, the opposition knows he’s dynamic but can be worn down and sent out before the sixth inning. As he matures, he could become a force they genuinely dread.


An Opening Day Overreaction: Jose Ramirez the MVP Candidate

Jose Ramirez broke out for the Indians last season. Long seen as just a placeholder for Francisco Lindor, Jose hit well enough all year to keep getting starts in a utility role, and eventually moving up to become the full-time third baseman for Cleveland. Ramirez derived the majority of his value from an elite contact rate, and excellent base-running, swiping 22 bags and hitting for an average well over .300. All in all, Jose was worth nearly five wins above replacement. There has been a lot of speculation as to whether he can repeat his huge breakout last year, if we may have already seen his peak, or maybe, he’s just getting started and there are even greater things to come.

Looking at Jose’s numbers from last season, I can see three areas for improvement. First off is defense. According to defensive runs above average, Jose was only worth 0.5 throughout the 2016 season. Jose is a shortstop by training; however, he spent most of the first half of the season bouncing around positions in a utility role, before landing at third base full-time. Considering this and the fact that he has rated out as a plus defender in past seasons, I think it is safe to project an improvement here with a more consistent role.

Second is his walk rate. Jose walked in 7.1% of his plate appearances in 2016. To compare, in 2015, as well as in his Triple-A career, his walk rate hung right around 9%, so there is possibly some room for improvement there as well.

The final area for improvement is Jose’s home-run hitting. Despite recording 60 XBHs last year, Jose only left the yard 11 times. It is very difficult to put up an MVP-quality season with lower-end HR numbers. Since 2011, there have been 29 positional-player seasons worth 7+ WAR, and every single one of them included over 20 HRs.

So what will Jose look like in 2017? It’s hard to tell, unless of course you decide to overreact to this week’s opening game, in which case…

WELCOME TO THE MVP RACE JOSE RAMIREZ

Jose batted four times in the opener, and he had one walk and one HR. THE TWO THINGS HE NEEDED TO GET BETTER AT!!! Now obviously this article is a bit tongue-in-cheek, and a sample size of one game means VERY little. The walk especially tells us just about nothing. You give me 4 PA in a major-league game and I might even luck into a walk. However, there is reason to take note of the home run.

Prior to 2017, Jose Ramirez had hit 19 home runs in the majors. His previous best exit velocity was 107.8 MPH on a HR. The longest HR of his career had traveled 437 feet. Jose’s HR in game number one left his bat at 109.3 MPH and traveled 447 feet.

So MAYBE this is a hint that Jose has added some power since last season. That would be a reason to get excited. If you take Jose’s 2016 numbers, then bump him to a 9% walk rate, 22 HRs, and plus defensive value, and even account for a few points of BABIP regression, he’s a 7-8 WAR player, and looks real similar on paper to Mookie Betts.

So, if we overact to opening day, this would make Jose a legitimate star and MVP candidate. His season will be extremely exciting to follow, although in the end probably overshadowed by Madison Bumgarner’s race to 60 dingers.


Berrios and Beer

Beerrios! That’s a way better title, but we’ll stick with the original. So I’m spending my Saturday brewing a batch of beer and dealing with some pitchFx data. If everything goes well, you’re going to get some baseball info and some brewing highlights. But also Happy Opening Week! It’s the greatest time of the year.

All right, let’s deal with some baseball first. Jose Berrios had a pretty brutal 2016 with the big club — all in all, he started 14 games and rattled off a 3-7 record with an 8.02 ERA, an ugly 1.87 WHIP, and a not-top-of-the-rotation strikeout rate of 7.6 K/9. His FIP and xFIP were better but still not great at 6.20 & 5.64. His BABIP certainly didn’t help his numbers, sitting at 0.344, but that alone can’t explain how truly atrocious his numbers looked in his first taste of the big leagues. I’m going to use the pitchRx package to look at pitching data from 2016 and see if we can figure out what went wrong and how we can fix it.

All right, now on to the beer portion. Today I’m making my Deep Lake Dark Lager. Behind every great beer there is a great story. This story begins when I worked out at a remote research camp and fridge space was not reserved for amateur beer-making. A key process in lagering a beer is fermenting the beer at low temperatures, which is why I mentioned the fridge space. We got around lagering our beer in the fridge by putting the fermenting beer into a keg and dropping the keg into a lake to about 15 meters deep (~49 feet). At this depth the temperature was steady at about 5°C (41°F). A little tip for any newcomers to the brewing community: Your beer needs to maintain command, something Berrios couldn’t do. Zing!

If anyone wants to take a quick look at some gifs of Berrios’ sick curveball (and other pitches), check them out here: http://www.pitcherlist.com/Jose-Berrios/

I tried to find a comp for Berrios related to pitch velocity, and if we ignore his slider, Jacob deGrom comes out looking like a pretty good match. Here are how their pitch velocities line up using 2016 pitchFx data. I know it’s not a good idea to exclude one of deGrom’s best pitches, but I’m more interested in consistency between starts.

Velocity Comparison – Berrios vs DeGrom
Name Four-Seam Two-Seam Curveball Change-up
Jacob DeGrom 93.4 93.3 80.4 85.5
Jose Berrios 93.4 93.2 81 84.7

Just eye-balling, they look pretty good. Let’s take a look at pitch velocity by start.

Just looking by eye, it’s hard to tell if you could consider one guy more consistent than the other. But obviously we might be able to give deGrom the benefit of the doubt here, since he was pitching with scar tissue or bone spurs in his elbow. Either way, he was pitching in discomfort. There is one thing that catches my attention, though — it’s those last 11 starts by Berrios, and you can see his change-up velocities start to sneak up from ~83.5 to 86 MPH. The unfortunate thing is that there is no concurrent increase in four-seam (FF) or two-seam (FT) velocity. Near the end of the season Berrios was trying to complement his fastballs with a change-up that had a really poor velocity difference. Let’s check that out in a bit more detail.

Okay, you give that plot a bit more thought. My timer just went off and I’ve got to go sparge the grains. I converted a five-gallon water cooler into a mash tun for steeping my brews, which works awesome, because it’s insulated so it holds the heat really well. The aspect I really love about this beer is that is has a really light lager taste, but it has a nice dark colour, which makes it a great spring beer. And to get this effect in your beer is really simple. For the 45 minutes where you are steeping your grains, only add the light grains, then just before you sparge, throw on your dark grains (in my case carafa III). That way, as you sparge you get the colour from the dark grains and none of the taste. Yaaaay beer. Everything is all sparged and now I’ve got to bring the wort to a nice rolling boil.

All righty, let’s discuss that velocity difference. I’d say there is a similar trend from his early-season call-up and his late-season starts as well. He starts out with a pretty decent velocity difference, but with each start that difference gets smaller and smaller. Especially in the second half of the season — he started out with a fantastic velocity difference. That combination should have led to some really effective pitches, but as we move into September and October those pitches are starting to look more and more similar and their effectiveness all but disappears.

Back to brewing — boiling achieved! I’ve got to let the liquid boil down for a couple hours, so through the magic of the internet, let’s fast-foward to the next step. And what a fantastic surprise, the battery in my scale is dead and of course it’s some weird specialized kind that I don’t have on hand. Well luckily I wrote the weight on the bags when I packed the hops last fall so I’m going to eyeball it and hop(e) for the best. At least now I can honestly say I can never reproduce this batch, but that’s part of the fun. So I figure I added about an ounce of hops; we’ll really never know. I’ve got to let that boil for another 40 minutes then add the flavour hops and some irish moss.

I think we can agree that this was not a season marked by consistency for Jose Berrios. But I was curious as to how his release point affected the velocity of each pitch. For all of the data presented here, I used the pitchRx package to download and store the 2016 pitchFx data. In the pitchFx data, you can pull out the release point for each pitch recorded throughout the season. Using this data, I created a general additive model using the bam() function for the R peeps out there, and within the bam function I modeled pitch velocity and pitch break separately using a Gamma link. I like to use the Gamma link because, in a not very sciencey description, it’s very flexible and fits a wide range on models. So first, a couple of notes; 1) There are two plots coming up; the first predicts pitch velocity and the second predicts pitch break length (movement). 2) Pay attention to the prediction window, the coloured box, for each pitch. And 3) These models were only run on Berrios.

And pitch break (break_length):

You can tell that velocity and break length change with different release points. I mean, there is a pretty complicated relationship with how his release point affected both the pitch break and the velocity, and I’m not really sure what the sweet spot actually is. His change-up velocity plot has a really nice faded red area sort of right in the middle of the prediction grid. This area represents roughly an 84.5 MPH change-up which would complement his 93 MPH fastball quite nicely, but unfortunately his arm slot seems to be drifting along an axis which we will get to in a second. Did you happen to notice how the coloured boxes moved slightly among pitches?

So remember how Berrios was apparently tipping his pitches this past year? Well, if not, check this out. So the way he was delivering the ball basically gave the batters a full view of what was coming. I mean, I know I don’t possess the ability to spot small things in deliveries and assess pitches. I watched gifs of Berrios throwing all of his pitches over and over many times and I can’t pick anything up. But I am sure that there are players out there who can pick up those minor details. So I’m thinking there may be more to this than just how he started his wind-up, and where he was releasing the ball was also giving batters a clue as to what was coming. Check out this plot showing how Berrios and deGrom released their pitches.

So you’re probably wondering what’s going on there. Each ellipsoid represents a different pitch, curveballs in blue, 2-seamers in orange or orange-red etc. Each ellipsoid contains 95% of the pitches thrown for each pitch type. Generally deGrom releases the ball about a foot over in comparison to Berrios, but that’s not what it important. What’s important is how each pitcher’s change-up overlaps with their respective fastballs. deGrom has remarkable consistency to throw both types of fastballs and his change-up, and the ellipsoids are basically completely overlapping. Right away we can see that something is going on with how Berrios is releasing his change-up. It only overlaps with about half of his fastball release points, but his arm angle also seems to be drifting, and you can see the ellipsoid is stretched one direction. So I’m guessing he’s not only tipping his pitches in his wind-up, but there is also some release-point trouble happening here that no doubt some hitters are able to pick up on.

Final update on the beer: I added in the flavour hops and irish with about five minutes left and took everything off the heat. Luckily, it’s still a bit cold here so I left the beer outside to cool for a couple hours to get it down to room temperature so I could pitch the yeast. And fast-forward a couple of days…I let the yeast start the fermentation process at room temperature for a couple of days, then moved it into a fridge. I’ll leave it there for about three weeks, transfer the beer to a keg, and then it’s basically ready to drink!

Thanks for sticking it out to the end; I hope you enjoyed “Beerrios.” This ended up having a lot more deGrom in it than initially planned, but I think it was a good comparison to include. I think we were able to successfully identify a couple serious flaws from Jose Berrios’ debut season, and hopefully he’ll be able to shake that off, work on fixing his mechanics, and take another shot at the majors in 2017. I have a feeling we are going to see him mid-April or early May, and I really hope we get to see what he can do over an entire season. If he can transfer just a fraction of his minor-league success to the majors, we will get to see a pretty dynamic young pitcher, and the Twins have been waiting a long time to get a pitcher of this caliber back into their rotation.


The Dodgers May Have Found the Next Justin Turner

Over the past few seasons, there seems to have been an uptick in power breakouts for hitters. J.D. Martinez, Jose Altuve, and Daniel Murphy are examples of guys who dramatically increased their power output seemingly out of nowhere. One of the most notable cases is Justin Turner, who transformed himself from a mediocre utility player with the Mets into an elite third baseman with the Dodgers. The Dodgers were rewarded for identifying a player with untapped potential and extracting that potential. Today I’m here to tell you that they’ve done it again, with Rob Segedin.

All right, a little background first. Rob Segedin was drafted in the third round by the Yankees back in 2010, and was traded to the Dodgers last year for pitching prospect Tyler Olson and KATOH star Ronald Torreyes. Despite having a pretty decent track record in the minors, he debuted in the majors just this past season and has never received much fanfare, even from the statistical community (the last article he was mention in on FanGraphs.com was a prospect report written back in 2012). Part of this is probably due to the fact that he’s usually been old for his level and never really hit for much power. The slew of injuries didn’t help, either.

Last year, however, all that changed. Well, the power and the health changed; he was still relatively old. Over 424 plate appearances in Triple-A last year, Segedin slashed .319/.392/.598 with 21 homers and a .279 ISO. That’s really good! The year before, his ISO was .136. Now, Segedin did move from Scranton to the PCL, which is significantly more hitter-friendly. But still, it’s hard not to be impressed with those numbers. And looking at his spray charts, the difference is stark (via MLB Farm).

Basically every home run Segedin hit in 2015 was pulled far left. In 2016 there’s a lot more action to center-left, and even some to the opposite field. And while, having looked over some footage, there doesn’t appear to be any obvious change to his swing, there’s another possible explanation for the sudden improvement. Segedin largely credits it to more consistent playing time after moving to the Dodgers organization – “It was a little frustrating for me last year to not be an everyday player and not get those everyday at-bats,” Segedin said. “I think playing for another organization was better for my career.” (Idec, Keith. “Baseball: Old Tappan’s Rob Segedin at Home in Dodger’s Organization.”NorthJersey.com. The Record, 14 July 2016. Web. 27 Mar. 2017.)

As mentioned earlier, Segedin had his big-league debut last year, so we have some MLB data to work with. And I’m gonna be honest. It doesn’t look great. Not on the surface, at least. In 83 PA, he slashed .233/.301/.370, good for an 83 wRC+. The great power numbers he had in Triple-A didn’t seem to translate, as he posted a mediocre .137 ISO. So yeah, that’s not very encouraging.

But there’s reason for optimism! For one, despite the low ISO, his exit velocity was pretty good. Rob Segedin’s average EV last year was 91.6 MPH, which is the same as Carlos Santana and Evan Longoria, and puts him higher on the list than Edwin Encarnacion. Segedin’s problem was less about hitting the ball hard, and more about putting the ball in the air: his average launch angle was 8.6 and his ground-ball rate was 52.8%. Which is a major problem (it’s hard to hit for power when you hit everything on the ground), but it may not be as bad as it seems. For one, it was only 83 plate appearances, and though GB% stabilizes pretty quickly, there’s still a good bit of noise in that sample. Also, remember what Segedin said about inconsistent playing time hurting his performance? Well in 18 of his 83 plate appearances, he came to the plate as a pinch-hitter. In those 18 PA he hit a whopping 24 wRC+ , as opposed to a 99 wRC+ when playing as a regular. I mean, I know that’s a ridiculously small sample, but it fits the narrative, so here we are. For what it’s worth, he’s batting .444/.500/.944 with 2 home runs in 20 PA this spring.

It’s kinda hard for me to look at Segedin’s current situation and not be reminded of Justin Turner. That said, he’s probably gonna strike out a bit more than Turner did. And he might struggle to find playing time in a crowded Dodgers infield. So there probably isn’t quite as much upside. But all the signs of a Rob Segedin breakout are there. All he needs is the opportunity.


Mark Trumbo and Fitting a Square Peg in a Round Hole

A long, slow dance in free agency for Mark Trumbo culminated with a three-year pact worth $37.5M to return to his 2016 team, the Baltimore Orioles. Trumbo, a classic slugger, reportedly hoped for an extra year and a total value of $75-80M on the heels of a season in which he led Major League Baseball with 47 home runs. Those who favor traditional statistics would point to Trumbo’s home-run totals and argue that he is one of the premier sluggers in the game, but in a baseball landscape run by the sabermetric crowd, Trumbo is seen as a one-dimensional player. In this chart, we will look at statistics that paint the picture that Trumbo is a one-dimensional player.

Mark Trumbo and His Contemporaries (2016)

Player 1st Half BA 2nd Half BA UZR/150 Baserunning Runs fWAR
Mark Trumbo .288 .214 -9.9 -2.0 2.2
Mark Reynolds .283 0.1
Chris Carter .213 0.9
Jose Bautista -9.3 1.4
Joe Mauer -2.2 1

It is argued that Trumbo’s year was inflated by an unsustainable .288 batting average in the first half, comparing him to Mark Reynolds, a cautionary tale of a player who peaked with a rather one-dimensional 44-homer season of his own. This is only accentuated by the fact that Trumbo’s batting average collapsed to .214 in the second half; this is nearly identical to fellow 40-homer masher, Chris Carter, who was non-tendered for being one-dimensional himself. Incidentally, Carter has been mentioned as a cheaper and nearly as valuable alternative for teams unwilling to make the splurge this offseason on Trumbo. On the field, Trumbo has been worth just about -10 runs per 150 games, which is more negative value than Jose Bautista, who was ravaged by injuries this season. On the bases, he provided enough negative value to compare to Joe Mauer, a former catcher.

There are several issues with this argument, though. The first is that Trumbo’s 2.2 fWAR is significantly higher than the one-dimensional sluggers (and others) he is being labeled alongside. Another is that he was stuck in the outfield by Baltimore in 2016 despite having no business being there. In fact, in his career, Trumbo grades out as an above-average first baseman. On the basepaths, Trumbo’s value is 105/146 of all qualified players, which isn’t as much of a tanker as one would think. As for his fluctuating halves, there is a tale behind that, too.

Mark Trumbo, Above Average First Baseman

Player BABIP wRC+ UZR/150
Mark Trumbo (1st Half) .327 143
Mark Trumbo (2nd Half) .216 98
Mark Trumbo (Career) .288 111 6.3 (1B)
2016 1B AVG .307 120 .3


Batting Average on Balls in Play (BABIP)
assesses whether a player is going through a lucky (or unlucky) streak based on deviation from their normalized rate. The average BABIP is .290, and Trumbo is no different, checking in at .288 for his career. His first half was above the average rate, while his second half was at an extreme (and unsustainable) low. As you can see in the chart, his wRC+ is in line with the offensive-minded first basemen of the league, and there is room for some uptick. His defense at first base, even if 6.3 is too optimistic, can make him a $75M man. A lot of Trumbo’s depressed value comes from spending too much time in right field; this chart will break down the calculation behind Trumbo’s 2016 fWAR and estimate what he can provide if played at his true position (and some time at DH).

Mark Trumbo as Full Time 1B (2016, 2017 Projection)

Player Mark Trumbo
Batting Runs 18.7
Baserunning Runs -2
Fielding Runs* 5.7
Positional Adjustment* -12
League Adjustment 2.6
Replacement Runs 20.1
fWAR* 3.4

fWAR calculation: (BR+BsR+FR+Positional Adjustment+League Adjustment+Replacement Runs)/(R/W)

*Assumes a 6.3 UZR/150, 135 games played as 1B, 15 games played as DH

This is an aggressive projection, but Trumbo proves that he is not a one-dimensional player. A 3.4-win player is extremely valuable, and if he produces to that level over the next three years, he will provide a significant amount of surplus value.

Mark Trumbo Projected Surplus Value, 2017-2019

Year fWAR $/WAR Value Produced Salary Surplus/Deficit
2017 3.4 8M 27.2M 11M +16.2M
2018 2.9 8.4M 24.4M 11M +13.4M
2019 2.4 8.8M 21.1M 11M +10.1M
Totals 8.7 72.7M 37.5M* +35.2M*

*Assumed aging curve via FanGraphs: +0.25 WAR/yr (18-27), 0 WAR/yr (28-30),-0.5 WAR/yr (31-37),-0.75 WAR/yr (> 37, assumes a 5% inflation/year in $/WAR

*$4.5M of Mark Trumbo’s contract is deferred and to be paid in $1.5M increments from 2020-2022; that amount was subtracted from the overall surplus.

This chart shows the full potential of Mark Trumbo, quality first baseman. As calculated in the “Value Produced” column, he is rather close to the $75M man he marketed himself as. Because of the stigma surrounding his 2016 season, his market did not develop, and clearly overcorrected. Contending teams with needs at first base went elsewhere – the Red Sox signed Mitch Moreland, the Indians signed Edwin Encarnacion, and the Blue Jays signed Kendrys Morales. Even the Colorado Rockies signed SS/CF Ian Desmond for $70M (plus the 11th overall pick in the draft) to learn yet another new position. Unfortunately for Mark Trumbo, the team he signed with, the Baltimore Orioles, already employs a first baseman in Chris Davis. This redundancy will force Trumbo to again be a square peg in a round hole; part-time DH, part-time right fielder. This has been an unfortunate circumstance for him throughout his career, playing for teams that already had Albert Pujols and Paul Goldschmidt. What might have been to see Trumbo realize his full value, on a contract he deserves, and hitting moonshots out of Coors Field or Fenway Park.


Sigh of Relief Aside, Expect a Big Year From David Price

No matter what team you root for, we are all baseball fans, and as baseball fans, the game is better when David Price comes out of a visit with Dr. James Andrews in one piece. Red Sox fans held their collective breath after the (since-updated) report was released that Price was being sent to Dr. Andrews following a troubling MRI scan. Even Boston’s brass was expecting to lose Price for the year to Tommy John surgery. Of course, it is not known exactly what Price was diagnosed with, and being shut down for seven to ten days is still troubling, but while the spirits are up, let’s consider something else: David Price will be back in serious Cy Young contention this season.

To be clear, David Price was an excellent pitcher in 2016. Any team would sign up for a 4.5 fWAR pitcher, and that production alone is All-Star worthy. However, in the context of David Price’s career, 2016 qualified as an “off year.” His previous two seasons saw him post totals of 6 fWAR and 6.4 fWAR, respectively. Looking at traditional stats, his 3.99 ERA was his highest since his 128-inning rookie season. So while Price was worth every penny in 2016, it wasn’t the rosiest year of his career.

If we want to find out what was different for David Price in 2016, we won’t have to look very far.

What Went Wrong For David Price in 2016

Year HR/9 FB% HR/FB% Pull% Hard Hit%
2010 0.65 39.6% 6.5% 30.1% 25.5%
2011 0.88 36.9% 9.7% 34.4% 24.7%
2012 0.68 27.0% 10.5% 35.3% 25.6%
2013 0.77 33.4% 8.6% 34.7% 28.6%
2014 0.91 38.1% 9.7% 36.4% 28.3%
2015 0.69 36.4% 7.8% 33.3% 28.2%
2016 1.17 33.9% 13.5% 44.1% 34.8%

*all stats via FanGraphs

Starting in column two, we can see a clear-cut spike in the number of home runs he allowed. Your first thought may be that this can be explained by his having to pitch in the notoriously hitter-friendly Fenway Park, but Price has pitched nearly his entire career in the confines of the American League East and hasn’t had a homer problem until this point. So we move to column two, with the hopes that an increased fly-ball percentage would be the answer to our question. However, his fly-ball percentage was actually his third-lowest recorded since 2010, which makes his spiked home-run-per-fly-ball percentage in column four even more puzzling. With the mystery unsolved, we move to the next column, which measures the percentage of balls in play that were pulled by opposing batters. This rate increased dramatically in 2016, and it coincides with the escalated hard-hit rate in column six.

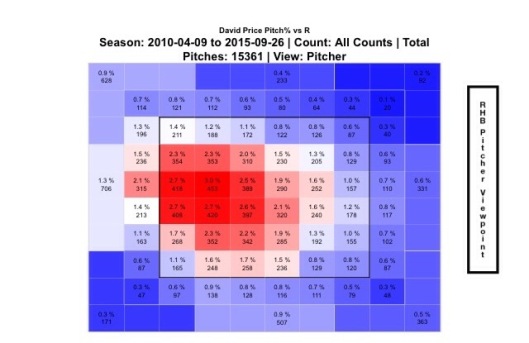
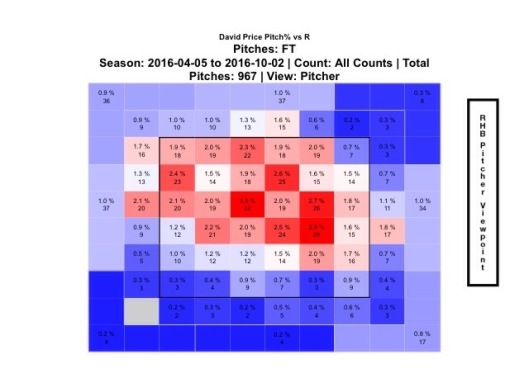
If opposing batters (generally righties) are squaring up on the ball and pulling it more than ever (generally to the Green Monster) on Price, it stands to reason that he is giving them pitches to pull hard. Let’s first examine a heatmap from Price’s pitch locations to right-handed batters over the same six-year sample size we have been using.

fullsizerender-7

*via FanGraphs

This looks pretty good! It’s no wonder why Price has been so adept at avoiding the longball; he really pounds the outside corner on those right-handed batters. So let’s look at 2016 and see if anything has changed.

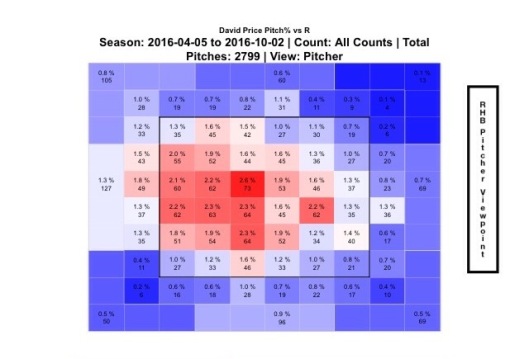
fullsizerender-9

*via FanGraphs

Yeah, that will change your fortunes. Much less of that outside corner action, much more of that “meatball right down the middle” action. I decided to dig a little deeper and look at which of his four pitches (fastball, cutter, changeup, and curve) was most responsible, or if multiple pitches were culprits. I’ll save you the trouble and get to the one culprit.

fullsizerender-8

*via FanGraphs

We’ve got a match, and you probably guessed it – it’s the fastball. I can’t explain to you why Price was missing his spots, but you and I know that this is a game of inches, and his fastball was responsible for 16 of the 30 homers he gave up. While this is purely speculation, it’s possible that Price was getting acclimated to his new environment and $217M contract. Whatever the case may be, this is the only adjustment that he really has to make in 2017 to return to his previous levels of Cy Young stardom.

Pitching is an unforgiving occupation, and pitchers often spend years refining their craft, but I am willing to go out on a limb and bet that someone of David Price’s caliber can make this one readjustment. He is no longer the new big-ticket addition in Boston (that would be Chris Sale), nor is he the defending Cy Young (that would be another teammate, Rick Porcello), which should lessen the pressure somewhat. With the hopes that Price is in good health, you can expect a huge bounce-back year from him in 2017.


The 2017 Red Sox Season Ends and Starts With Bogaerts

The Red Sox are currently tabbed as the favourites in the American League by most experts and odds-makers, but there was a lot of roster turnover from last season so it is difficult to really project their level of success for the coming year. Their positive 2017 outlook is despite losing the face of their franchise and best power hitter, David Ortiz, to retirement. He has been one of the most consistent clean-up hitters in the past decade and so offensively he leaves big shoes to fill (pun intended). The Red Sox offense in 2017 led the majors in most offensive categories like AVG, OBP, SLG, Off WAR component, swStr%, contact% and had the best OPS since the 2009 Yankees. Instead of signing or trading for a big slugger in the offseason to fill this void, Red Sox management looked elsewhere by acquiring one of the majors’ best starting pitchers in Chris Sale. The 2017 Red Sox are now led by a young nucleus of hitters who are projected to carry an offence that is likely going to be one of the best, and the Red Sox are banking on the continuing development of their young offensive talent to help them go far in the postseason.

One player who is expected to make major offensive contributions this season is Xander Bogaerts — a hitter who has shown the ability to hit for an elite batting average (.320 BA in 2015) and display some power (21 HR in 2016). He plays for one of the league’s most scrutinized teams and at one of the most important positions, creating an environment that demands excellence and puts a high level of pressure on a young player. Bogaerts has posted back-to-back seasons with a WAR over 4 and a wOBA over .338 but he achieved these feats in contrasting ways. In 2015, it was driven by an elite batting average, while in 2016 he made some changes to his swing and approach at the plate and was able to hit for a high average (.294) while increasing his home-run total from 7 to 21.

But when we delve into the numbers of his 2016 season, we learn that it was a tale of two halves. His noticeable two-halved season is similar to the 2016 seasons of Matt Carpenter and Kevin Pillar, players who I have written about recently, but these tales were directly related to injuries they sustained. For Bogaerts, however, his change was not due to an injury but from a change in his approach at the plate. This change had a negative effect on most of his offensive statistics and perhaps is a cause for concern for the coming season.

In the first half of the season versus the second half of the season, his batting average fell from .329 to .253, his BB/K fell from 0.59 to 0.37, his OPS dropped by 134 points, and his wOBA dropped by 57 points. The only improvements he displayed was improving his HR/FB ratio from 10.6% to 12.1% and increasing his ISO slightly by 13 points (.146 vs. .159).  So what changed, you ask? Well, you can probably tell from interpreting the aforementioned changes in his statistics; he sold out for power. He made a significant change to his ground-ball to fly-ball ratio, as it decreased from 1.62 to 0.98. Below we can see the change in his AVG/P from the first half to the second half of the 2016 season:

​​

He stopped hitting balls to the opposite field, decreasing his Oppo% by 6.3% and increased his Pull% and Cent% by 2.8% and 3.5%, respectively. See below for a summary:

​​

He also increased his average launch angle from 6.3 degrees in 2015 and 6.9 degrees in the first half of 2016 to almost double those marks in the second half of 2016 — 13.1 degrees. Despite increasing his launch angle in the second half, he made no major changes to his exit velocity (89.8 MPH vs. 90.2 MPH) or to his swing speed (61.3 MPH vs. 61.7 MPH).

In the table below, we see how Bogaerts ranked at his position in wRC+ and wOBA based on batted-ball type in the first half of the season and the second half:

Further, it is interesting to investigate his home and road splits in the second half as he hit .325 at home vs. .207 on the road. His second half away FB% was 39.9% and pull% was 42% while at home it was 38.3% and 52.1%. He increased his away FB% by 9.4% and increased his home FB% by 5.9% and his pull% by 7.7%. This change obviously helped him when playing at Fenway Park as his ISO increased from .172 to .205 while maintaining an identical batting average. However, while playing on the road, this new approach to hit fly balls and to pull the ball over an imaginary Green Monster led to major struggles at the plate.

I wanted to see if there was hope for Bogaerts with his new fly-ball-driven plate approach, so I wanted to look at hitters who made similar changes year-over-year and how they fared. I used data from the past four seasons and looked at qualified hitters who had at least a 0.40 decrease in their GB/FB from one year to the next. Analyzing the data, I found that Xander Bogaerts’ second half was eerily identical to Salvador Perez’s 2014 season. Perez made similar changes in his fly-ball approach from his 2013 to 2014 season and below are the results:


Apart from their HR/FB ratios, their batted-ball and hitting-profile metrics are identical. Bogaerts decided to pull and hit fly balls in the second half and if he was able to sustain this batted-ball profile over the course of a full season, versus if he kept his batted-ball profile the same as he had in the first half of the season, he would have hit six more home runs. Hitting over .310 with 18 HRs is much preferable to hitting sub .260 with 24 HRs. Of course, this extrapolation has its flaws, but whenever your hitting is compared to a catcher’s, it is a bit of a sign of concern.

It is not all doom and gloom for Bogaerts, as he is only 24 years old and has a lot of time to build into his frame and develop a power stroke. Looking at the same set of data, Bogaerts’ 2016 full-season data (a mixture of high-average approach vs. HR-hitting approach) looked similar to Robinson Cano’s 2016 season, apart from his ability to tap into his power. Cano and Bogaerts decreased their GB/FB rates by 0.72 and 0.75 respectively from 2015 to 2016, as shown below:


If Bogaerts can learn to hit the ball harder more consistently and perhaps focus less on pulling the ball, and revert back to his 2014 Oppo% of 32%, he could turn into both an elite power and contact hitter. An ideal future player comparison for Bogaerts would be somewhere in between Derek Jeter and Robinson Cano. Being able to utilize the whole field, hitting for a high batting average, stealing some bases, scoring lots of runs atop a killer lineup, and hitting for a lot of extra-base hits are all within the realm of possibilities for this young shortstop.

An important aspect to consider for the upcoming season is, where should Bogaerts hit in the batting order? According to Ian Browne of MLB.com, John Farrell is tinkering with the idea of hitting Bogaerts sixth in the Red Sox lineup, and this was the case for his first spring-training game since returning from the WBC on Thursday. And perhaps he has done so for good reason. In 2016, Bogaerts had most of his success hitting third in the lineup, but was moved to the two-hole on August 10th and stayed there for the vast majority of games there on out, and he began to struggle at the plate. It is a bit of a chicken-and-the-egg dilemma but something that probably prompted the move was his inability to hit with runners in scoring position. His batting average fell from .351 to .136, due mostly to his increased FB% — a trend that he has showed throughout his short major-league career, as shown by the table below:


His struggles with runners in scoring position are something that I am sure Farrell is well-aware of, and therefore his move down in the batting order makes a lot of sense, especially if he continues struggling with his new approach at the plate. It should not only helps his team be more efficient at run production, but it should also help Bogaerts’ chances of stealing more bases this season — something he has talked about doing more of if given the opportunity. He stole 11 bases in the first half of the season but only stole two in the second half, something that he attributed to having fewer green lights from his coaching staff when on the base paths, as they didn’t want to take the bat out of Big Papi’s hands. Of course, that is no longer an issue, and if he does in fact hit in sixth slot, he should have more opportunities to run than if he hit fourth – a position in the order that he was originally projected to hit from.


Fantasy Perspective: The move down in the order will definitely hurt his counting stats in runs and RBI, but the optimist in me believes that he will revert back a little to his 2015 self and hit fewer fly balls than he did in the second half of 2016. This should hopefully help him hit for a high batting average, considering he was able to sustain a BABIP in the .370 range over the course of over 1000 PAs from the beginning of the 2015 season to the halfway point of the 2016 season. His batting average over that period was .323, which which was tied for second with Jose Altuve, and only trailed Dee Gordon at .324. A more balanced approach should hopefully result in productive power numbers from Bogaerts, posting an elite number of doubles and HRs in the mid- to high teens. He has talked about trying to steal at least 20 bases this season and the likelihood of doing so is highly dependent on where he hits in the order. So if he stays in the six-hole for the majority of the season or moves up to the two-hole at some point – I believe that 20-25 steals is achievable.


Hitters Who Made the Most Outs When Ahead in the Count

Last week I explored how exciting it is when certain things happen in baseball that shouldn’t. Some of the moments are quirky, like Ben Revere homers, while some of them are static shocks of excitement, like a guy getting on despite being behind in the count. They’re all enjoyable though.

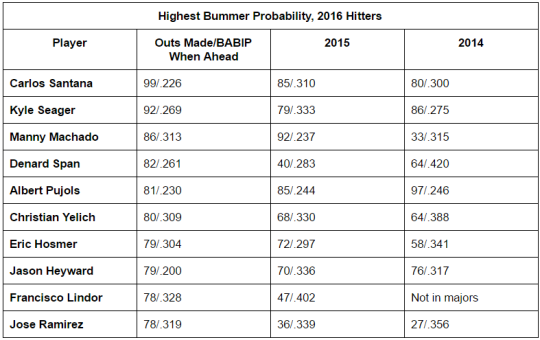
But let’s be fair. Sometimes hitters are up at the plate with the advantage. They’re ahead in the count, have the pitcher behind the 8-ball and the defense extra up on its toes, but then…womp womp. They strike out, hit a weak fly ball, or tap a grounder to short, and the at-bat ends with the curt sound of a deflating balloon. And we’d be remiss to not acknowledge the guys who left us deflated most in 2016.

image

Like last time, that’s the top 10 from last year, plus their previous two years for some context. This list is just as interesting because it’s just as diverse in terms of position, age, and spot in the lineup. Certain guys do stick out though. You can’t help but think how the consistency in the numbers for Albert Pujols could speak to his decline. From 2008-10, which are the first three years of data available from Statcast, his BABIP when ahead was .389, .313, and .288. Those are also the last three years his batting average was .300 or better, which is understandable if you consider the possibility that pitchers have become less fearful of him when they give him advantageous counts.

Then there’s the Curious Case in the Collapse of Jason Heyward. Nobody expected him to be so bad so quickly in his first year with the Cubs. How much of it had to do with his BABIP loafing on the Mendoza line when ahead? As such an aberration, does it suggest he could bounce back with anything more than terrible luck? Probably at least a little.

And let’s not forget Francisco Lindor! He’s the only guy to show up on this list and the best-when-behind list. Perhaps that speaks to his relative youth — maybe too much comfort when ahead and focus that wants to make up for it when behind. That will be interesting to track as he moves into the next phase of his career.

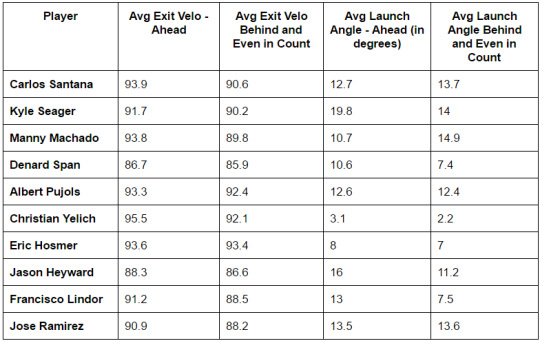
image

Collectively, these guys were all more comfortable when ahead, as you may have guessed. Pujols sticks out again in terms of how the ball comes off his bat. While he’s been making outs at a high rate when ahead the last three years, he’s also still squaring up the ball pretty darn well. As for Heyward, his launch angle when ahead might be another reason he could improve in 2017, even if his exit velo is almost definitively average. Unless his combo of loft and soft-ish hitting gives defenders enough time to get to the ball. Then maybe he’s doomed forever.

Kyle Seager has the highest launch angle when ahead and second-highest in other counts. While he clearly likes to put the ball in the air, his decent-but-not-exceptional exit velo might make for a lot of long outs. And at the other end of the spectrum, Christian Yelich’s numbers tell us he’s hitting it low and hard a ton. That makes it easier to grasp why he made 80 outs when ahead in the count last year, but he also more than doubled his career home-run total last year, so he’s starting to put some loft under the ball.

Based on the numbers immediately above, Carlos Santana might get on base even more in the coming season. Hitting it as hard and at the angles he did in 2016 makes it seem unreasonable that he made the most outs in the league when ahead.

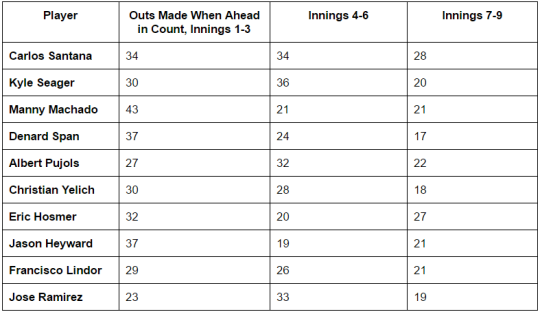
And finally, we examine when these guys made their outs when in hitters counts. Like the best-when-behind list possibly provided some inkling when to tune into a game or one of those players’ at-bats, this data might tell you when to tune out. Unless you’re into disappointment or schadenfreude.

image

Only two guys made more outs in the last three innings than they did in the first or middle three: Eric Hosmer and Jason Heyward. It’s intriguing that everyone else trended down as the game went on. I don’t readily buy into the idea of players being “in the zone” or “a great place mentally.” However, I am curious about the possibility of mentality making an impact on action in this context because I do believe mind and body are one. That they might come together as the stakes get higher would speak to the crux of how any of these hitters have become professionals.

I don’t think these numbers are as informative in the players’ approaches when ahead as much as they are a matter of BABIP. And by no means do I think that’s bulletproof. They still tell us how they hit the ball and when, which means they leave open opportunities to examine where tweaks might occur, though. With the variability of average on balls in play, it’s unlikely these players post the exact same numbers, but if any of them come close, it could account for roughly 20% of the total outs they make all year. Or 20% of the reasons you see what other games are on.


Kiermaier Takes Guaranteed Cash, Rays Upgrade Asset

Center fielder/sabermetric superstar Kevin Kiermaier signed an extension with the Tampa Bay Rays for 6/$53.5M this week. Dave Cameron of FanGraphs notes that he will receive roughly $30M for three arbitration seasons and $12M per year for three free-agency seasons. There will also likely be a $12M team option. Cameron’s article, while rightfully criticizing Major League Baseball’s flawed arbitration system, will run counter to my argument. Kiermaier is an excellent player, no doubt – a defensive whiz, a great base runner, and a league-average bat to boot. One thing that is not on his side is age. Kiermaier will be 27 this season, would have been 30 in free agency, and will be 33 or 34 when his contract is over. Much of Kiermaier’s value is derived from his defensive prowess; he has recorded a 44 UZR for his work in center field in his career. While this is impressive, the precedent for Kiermaier to continue this excellence through his free-agent years is unlikely. Let’s consider the center fielders of the UZR era who have signed significant free-agent contracts.

Major Free Agent Center Fielders’ UZR

Player FA Age Contract CF UZR (Pre-Contract) CF UZR (Post-Contract)
Carlos Beltran 28 7/119M 16.1 15.1
Juan Pierre 29 5/44M 32.6 -0.8
Gary Matthews Jr. 32 5/50M 12.4 -24.4
Torii Hunter 32 5/90M 11.9 -17.7
Aaron Rowand 30 5/60M 46.2 7
Melvin Upton Jr. 28 5/75.25M 18.6 1.6
Angel Pagan 31 4/40M -1.5 -25.6
Michael Bourn 30 4/48M 51.6 -14.2
Jacoby Ellsbury 30 7/153M 28.9 -2

*data via FanGraphs

Here we see a list of center fielders with (mostly) fantastic defensive records before signing a free-agent contract around the age of 30. With the exception of Carlos Beltran, the youngest player on this list, every single one of these players’ defensive values in center cratered. All of them were or will be rendered unplayable in center before the expiration of their contracts. Kevin Kiermaier is a fantastic center fielder, but even he is no immortal among these men. With the stench of the Jacoby Ellsbury deal still fresh in the air, it is likely that most executives around the game will prefer developing defense rather than buying it.

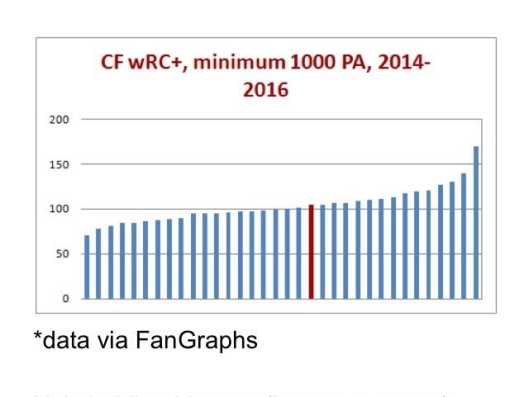
The Rays get to pay Kiermaier $24-36M for 3-4 free-agent seasons in exchange for the guaranteed money during his arbitration years, but if Kiermaier the hypothetical free agent isn’t going to be paid for his defense, is his bat really going to be worth 3/$24M or 4/$36M? Looking at Kiermaier’s place among center fielders with at least 1000 plate appearances in the previous three seasons, his wRC+ made him this red mark on the graph.

wRC+ chart

He’s holding his own (league average), and this is around where he has been for his whole career, but this is also supposed to be his prime. If this is the offensive peak (plateau?) of Kevin Kiermaier, it’s hard to imagine him creating $24-36M worth of value if the plateau crumbles around the age-30 mark.

While Kevin Kiermaier is a bona fide stud, it’s likely he will only be one until he reaches what would have been his free-agent years. By signing this extension, I believe Kiermaier increased his career earnings, while taking that money guaranteed. However, don’t presume that Tampa was reckless about the $24-36M they will allocate to Kiermaier over those last three or four years; precedents can be broken, and he is an awesome player. It’s also important to consider the new asset that Tampa upgraded to, a nice Adam Eaton-esque carrot to dangle in front of interested teams – seven years of control of Kevin Kiermaier.