Author Archive

The New-Look Phillies Lineup Plans on Stealing All Your Strikes

You’ve probably heard of how pitchers and catchers can steal strikes via expert control and framing. Some guys are just so good at painting the edges that they get those calls, plus the benefit of the doubt on the ones that push a little further outside. Think Zack Greinke, Aaron Nola, or Kyle Hendricks for pitchers. On the catching side, the names are less heralded, but think Yasmani Grandal, Jeff Mathis, or Max Stassi. They all deliver or receive the ball with such veracity that it’s almost magical to witness as a viewer, and probably infuriating as a hitter.

But all’s fair in love and baseball. If pitchers and catchers can aid themselves in stealing strikes that help them get outs, logic follows that hitters can do the same to prolong at-bats, even if we don’t necessarily talk about it under the same terms. Certain guys are just better than their peers at knowing when to swing and when not to, whether the ball is in the zone or not. And maybe, just maybe, that’s part of why the Phillies went out and acquired Andrew McCutchen and Bryce Harper this winter: they know when they can afford to not swing, even if the ball ends up on the edges or in the zone. In addition to Rhys Hoskins and Cesar Hernandez, the team now has three of last year’s top five hitters in baseball (and four of the top 30) at getting pitches in those spots to be called balls.

phils strike stealers

There’s a lot to unpack here. In each of the past three seasons, only about 220 hitters have qualified to be a strike thief each year by having seen at least 1,500 pitches. While hypothetically that works out on average to about seven guys per team, it’s certainly not how the talent is actually distributed. Just seven teams accounted for half of the top 30 alone in 2018. In many respects, what one team has is what another inherently can’t. Read the rest of this entry »


A Peek into the Astros’ Secret Sauce for Pitching

The Franklin Institute is a science and research museum located in Philadelphia, Pennsylvania. Among its many draws are a giant heart you can walk through, the SportsZone where you can sprint the 40-yard dash and compare your time to professional athletes, and a Changing Earth exhibit made entirely of sustainable materials that focuses on the ways the planet has transformed over time. Through all of that, plus rotating feature exhibits, it’s easy to lose sight of a tried and true experiment: The Ruler Drop Test.

If you never performed the experiment in middle school, the Ruler Drop Test is exactly as it sounds. Take a ruler — or, in the case of the Franklin Institute, a yardstick — and hold it vertically between your index finger and thumb on your dominant hand, about one-fourth from the bottom. Then release it and see where you can catch it. The shorter the distance between where you let go and where you catch it, the faster your reactions are. Science!

It’s a simple experiment, but it is illustrative. And with how it’s centered on vertical drop and expectations, it could help us understand how the Houston Astros have used advanced technology and data to tweak pitchers’ repertories to reach new levels of success. Read the rest of this entry »


Fast, for a Catcher: Analyzing a Quickly Moving Backstop Market

Have you ever had a baseball game on in the background in the dead of summer as you quietly go about your day, and then you catch an absolute gem from a broadcaster that stops and makes you laugh? “He got down the line in a hurry… He’s pretty fast, for a catcher.”

It’s possibly the game’s greatest backhanded compliment; an ode of sorts to the frequently lumbering yeoman who not only endure the dog days of August but who do so willingly, wearing additional gear and sitting in an awkward squat for hours. A single sentence about their baserunning abilities — or lack thereof — conveys perhaps a modestly complete understanding of what baseball is, when you stop to think about it. And it’s a delight.

This offseason has seen a different kind of speed from catchers: the one at which they’re changing teams. Maybe it’s coincidence that some of the more offensive-minded ones have reached the market together, and they’re some of the names moving between teams. While backstops make it difficult to capture their entire value in a single stat because of all they do, we can and do quantify offense. That makes it easier, if you’re a front office, to jump on a guy you know can beat the .232/.304/.372 average triple-slash line catchers produced in 2018 and see it as a win.

But the offense-oriented catchers aren’t the only ones moving between teams, and it becomes harder to separate them from each other when considering defense or the total package. It is much harder than separating, say, Mike Trout and Charlie Blackmon. And that’s what makes the catcher carousel this offseason a unique ride. Read the rest of this entry »


Eugenio Suarez Has Optimized His Brain, Results Have Followed

Last season, Eugenio Suarez was a pretty good Major Leaguer — 17% better than his peers, by measure of the runs he created. He was far better at home than he was on the road, as you may expect for a slugger who plays half their games in Great American Ball Park, but overall he had turned into a dude with Cincinnati in his third full year there.

2018 has been a different, even better story since jump street, though. Suarez has morphed again, this time into arguably the best hitting regular third baseman and the eighth best hitter in all of baseball, regardless where he’s playing. It’s even more impressive when considering his thumb was broken on an errant pitch in April and he hasn’t missed a beat since coming back. The whole thing is really curious.

Suarez rate stats

He’s walking and striking out a little less and he’s hitting a few more balls in the air. None of those explain how he’s driving the ball so much harder, as his ISO indicates, or why he’s been 23% better than last year when he was pretty good, though. Sometimes, seeing year-over-year differences in these numbers tells enough of the story. But looking at the surface doesn’t for Suarez doesn’t show us how he went from a dude to the dude. He leaves us with no choice but to wade into the water.

Suarez Contact and Discipline

Did your eyes pop going over the change in how Suarez attacks the ball like mine did? He’s dwarfed his lightly hit dinkers this season compared to last. He’s absolutely ripping the ball when he does hit it. He’s chasing the exact same rate of pitches and he’s going more at the ones in the zone. Throw in that he’s hitting the ball less to the opposite field and more up the middle, and the picture starts to clarify.

But not completely. We can see the What that’s driving Suarez’s production, but not the How. We don’t know how he went from just above average at generating hard contact to top two in the Majors, a half percentage point behind only Matt Carpenter, who has been Ares on a warpath for months.

Let’s wade into the Suarez water deeper and get to some gifs.

Suarezzz17

This is Suarez in 2017. He pulls a 94 mph fastball into left field for a single. He ended up driving in a run. An all around solid outcome.

Suarez 18 change

This is Suarez this season. He drives a 94 mph fastball into the right field seats for his 22nd tater of the year.

Suarez’s two swings are largely the same. But the big difference is that he’s gone from starting with his bat being parallel to his body in 2017 to starting with it parallel to the ground in 2018. His rate stats being so similar over the last two seasons suggest that he hasn’t drastically changed his approach. The tiny mechanical difference in his stance suggests that he’s found a way for his brain to make the same decisions in the mere milliseconds it takes for a pitch to reach the plate, but provide much more impressive results.

Frankly, what he’s doing this season is amazing. We don’t know where he’ll go next, but we do know that the new Eugenio Suarez is a strong representation of baseball in 2018: able, powerful, smart, and optimized.

Data from FanGraphs. Gifs made with Giphy from Statcast video


George Springer Isn’t Quite Seeing What He Wants

Look up and down the Houston Astros roster and it’s difficult to imagine them getting any better. They’re on pace to win 105 games, which is four more than even last year. But it’s possible. Though their pitching staff is the best in the league and maybe one of the best ever, their offense has been more middling. And it may start at the top with George Springer.

So far Springer has registered 1.6 fWAR and a 113 wRC+ in 97 games. While being 13% better than league average is pretty good, it’s not quite what you’d expect from him. Last year he surged to a 140 wRC+ mark. Even if you account for regression, you don’t account for him being almost 30% less than the batter he was just a season ago.

Right now the projections love him. He’s pegged to account for at least 1.5 wins for the rest of the year, in less than 60 games, and a wRC+ of at least 128. And remember that as projection systems evaluate a player’s true underlying talent level at a given point in time, they’re also conservative in nature. You could somewhat reasonably argue, then, that Springer could possibly manage an even bigger rebound here as the season resumes.

But there’s a catch with projection systems. They might capture a player’s true talent level, but by nature they can’t capture all that goes into preparing for that player. Maybe based on George Springer’s past body of work, compared to players of his ilk and age, he really is a hitter who is at least 30% better than his peers right now. But based on how pitchers have attacked him this year, he hasn’t been, and there’s one reason that sticks out as to why.

SpringerHeat2017

Pitchers are locating their four-seamers to Springer differently this year. On the left, you see where they spotted the pitch to him in 2017, mostly outside. Springer is 6’3 and looks every bit of it in the box. He has an upright stance. When he gets ready to swing he becomes relatively compact. His arms move down while his hands load and he has a moderately  pronounced leg kick. Given how he condenses himself, it’s possible pitchers felt there was an opportunity to attack away because of how it would take him more time to expend the energy to get there on their fastest pitch.

But if you look on the right side of the heat maps above, you’ll see the fastballs Springer swung at. He didn’t have difficulty getting to those pitches and you can see why for yourself if you get out of your seat and pretend to take a swing as you read this next part. (That’s what I did. It was fun!) Go ahead. Stare down Luis Severino or Jacob deGrom fearlessly as you ready yourself for what’s about to come. Make sure you’re in an upright stance. Slowly coil up as you get ready to take your cut. Follow through.

Notice where your arms and legs go? They explode out. They pretty much have to, right? Now imagine you’re a top tier athlete on a top team in the world, like George Springer is, and you can see how he’d shred fastballs on the outer half. He accumulated a 17.4 pitch value against four-seamers last season, which was good for 15th in all of the Majors.

SpringerHeat2018

So, the solution? Try to take advantage of the way Springer coils up. Bust him inside some more to keep his body and bat from exploding through the pitch. And so far this season, it’s working. He’s managed only a 6.9 pitch value against four-seamers so far. That’s still relatively nice, and top 40 in the Majors. His wOBA against four-seamers this year is still .381, but that’s down nearly 50 points from last year. In many ways he’s been perfectly cromulent, even if a far cry from the top six outfielder and top 20 hitter in all of baseball he was in 2017.  

Pitch values come with caveats. They can be deceptive because on the surface they look like they report only on one specific pitch, but the value of each pitch is often heavily tied to how it’s sequenced with others. We don’t immediately know what set up the performance of the pitch we’re evaluating, and that’s a big deal. However, Springer has seen and offered at pretty much the same volume of four-seamers as just a season ago. Pitchers have merely changed where he’s seeing it.

Springerrrrrrr

If he’s still favoring swinging at the fastballs on the outer half, it’s probably because he knows he can crush them. Just last night, on June 21, poor Noe Ramirez served him a pitch right in his happy zone and the Angels paid dearly. The Astros are a smart club. Maybe they’ve tried or are brainstorming possible solutions to Springer getting crowded with heat. Maybe they’ haven’t and they’re just telling him to keep on keeping on because it’s not like he’s turned into a liability. But good gravy, imagine if he figures it out before October.

Pitch percentages and heat maps from Statcast. All other data from FanGraphs.


Johan Camargo Deserves your Attention

If you’re following the Atlanta Braves this season — and it would be hard not to, as they’ve lead the NL East for a large portion of the first hal — there’s a lot that may draw your eye. Ozzie Albies, Ronald Acuña have provided anticipation. Nick Markakis has surprised. Freddie Freeman has been himself. A host of pitchers, like Mike Foltynewicz, Sean Newcomb, Mike Soroka, Shane Carle, AJ Minter, and Dan Winkler, have all emerged as more than expected in some respect. But another name should also grab your attention: 24-year-old, switch-hitting Johan Camargo.

The Atlanta system has been among the best in baseball the last couple years, boasting both depth and top end talent. The litany of players above largely verifies that. Two years ago, the last time Camargo was eligible to be on a prospect list, he was effectively ranked as the 52nd-best prospect in the team’s system by FanGraphs. He was said to be “a plus defender at third” but also that “his feel for hitting and lack of balance at the plate are both non-starters.” He was ultimately compared to Abraham Nunez.

While Nunez enjoyed a long professional career, he also retired being worse than a replacement level player. His career fWAR was -1.4. Upon arriving in the Majors last year, Camargo seemed to immediately dispel any such comparison. His defense between shortstop and third base was passable, but his bat was more than anyone ever seemed to imagine. He mustered a 102 wRC+ in 82 games, which was 14% better than Nunez ever achieved.

Camargo performed that way largely on the tails of a .368 average on balls in play. Sustainable? Probably not, but it was something, and way more than what was ever expected of him. That’s already a win for a team’s 52nd-best prospect. But this year he’s gone from something to something to write home about.

CamargoOne

All of his numbers so far jump off the chart. Last season he whiffed five times more than he walked. This year he’s walking an additional 8% and striking out less. He’s driving the ball at a clip that’s 33% higher than last year. He’s been 15% better than the average Major League hitter, and that’s with his average on balls in play dropping more than 80 points! That’s fantastic! So for the second time in as many years, Johan Camargo is forcing us to beg the question: is he for real?

CamargoTwo

Well, dang. His walk rate skyrocketing seems legitimate with how much less he’s swinging at balls out of the zone. Spitting on offerings that are inherently less hittable will influence the rest of his batted ball profile, too. He’s traded in weaker contact for harder contact. Hard contact throughout the league is up by nearly 4% from last year. That’s substantial because the amount of balls in play is in the thousands — think of it like getting a 4% raise in a single year, compared to, say, 1.5% for cost of living. Alex Chamberlain recently examined how it’s meant less overall, but this much is clear: Camargo is still knocking the crap out of the ball.

This authority has lead to improved exit velocity on line drives and fly balls. Last year, on average, Camargo hit balls in the air at 91.4 mph. This year he’s doing it at 93.8 mph. The tick and a half might not seem like much but it moves him from the 23rd percentile in all the Majors to the 76th. And considering his average launch angle on those balls in play — 25.4 degrees — it’s significant. Rob Arthur has found that “the very best hitters in MLB tend to smack lots of balls with launch angles around 25 degrees and exit velocities above 90 miles per hour,” and so far Camargo is only trending upward.

We might be able to contribute this next gear at the plate from Camargo to a more exaggerated leg kick. See below for yourself.

CamargoSideBySide

On the left is Camargo in 2017 when he first showed us he might be more than we thought. On the right is him in 2018, as he insists that he is. Leg kicks like this are timing mechanisms players use to establish rhythm at the dish. His teammate Ozzie Albies, who is also a switch hitter blasting by his projections, employs a similarly pronounced leg kick. Camargo seems to have found one that does the job for him, providing him the balance and feel at the plate he lacked as a minor leaguer.

Maybe we’d have heard more about Camargo by now if he was on a different team, or if Atlanta hadn’t surged to contention so quickly. Maybe it’s tougher to see how far he’s come given that he started so far off everyone’s radar, or that he’s supposed to be a utility man and placeholder for prospect Austin Riley. But Johan Camargo is more than any of that, and he’s showing us how.

Exit velocity, launch angles, and stills from Baseball Savant. All other data from FanGraphs.


Acquiring Manny Machado Is Imperative for the Phillies

We’re two weeks out from the trade deadline. It may be quiet for most of baseball, given the state of the Haves and Have-nots shaping a less traditional mid-season urgency than in the past. Most of the AL playoff picture appears to be nearly set, at least to many observers. Meanwhile, the NL is up for grabs. As of July 14, the Phillies hold the biggest divisional lead at just 1.5 games over Atlanta, while the Dodgers have only a half game lead over the DBacks and the Cubs are in a dead heat with the Brewers. Manny Machado is the trade deadline’s biggest fish and he’s been connected to nearly all of those teams.

Given the state of competition in the NL, Machado could dramatically impact the league’s playoff race. He’s projected to be worth at least two more wins. That’s a bigger gap than any current divisional lead. It could be easy to argue that he’s a critical addition for any club, but it may not be more important for anyone than the Phillies.

Of course, there’s the short term considerations for the Phillies to acquire Machado. The team is competing earlier than anticipated. Their top tier farm system could handle the cost of acquiring a star on an expiring contract and still be excellent. It doesn’t hurt when the star in this case has intense connections to the current Phillies front office, from its director of scouting to its general manager to its president. But then there’s this:

ss war

That’s every first and second place team in the NL right now. The Phillies have had some terrible shortstop production in 2018. That could be because their expected starter, JP Crawford, has only managed to appear in 34 games this year, of which only 25 have come at short. The team’s primary replacement has been Scott Kingery, who’s appeared at short in 68 games. He was bally-hooed in Spring Training as he pushed for a roster spot and was signed to a long-term extension to accommodate him making the team, but he’s been miserable in his Major League debut. He’s mustered a 66 wRC+. In other words, he’s been 34% worse than average.

Beyond just being an upgrade at shortstop, Machado could help the Phillies become a more efficient offense overall. To date, they’ve left 654 runners on base, which is 11th-worst in the Majors. But they’ve also share the league’s 10th-highest OBP at .320. So they’re one of the best teams at getting guys on base, and one of the worst at driving them in. Machado has a wRC+ of 131 with men on base, and that may be a bit muted because Baltimore has been so bad. He’s garnered 11 intentional walks in those situations this year, which is already two more than he’s ever had in a full season.

Trading for Machado does more than just improve the Phillies and their chances this year, too. It keeps him away from every other team that would stand to get better by acquiring him. Maybe you read that and thought, “duh.” But if you notice in the chart above, the Brewers may especially feel the urgency to make a big move. They’re the only contender which has been worse at shortstop than the Phillies. They’re also trying to stave off the Cubs, who everyone seems to be waiting to click again and run off with the division, just like last year.

Long-term, Machado serves additional purpose for Philadelphia if they can sign him to an extension, which they may stand a good chance to do. Atlanta’s top tier farm system has put them in position to churn out role players and superstars with staying power. Even if the Nationals lose Bryce Harper this winter, they still have Juan Soto and the rest of the cast that’s good enough to compete. The Phillies system has produced talented Major League pieces the last couple years and is still ranked highly, but it lacks players who are projected to be stars on the level of the other teams in the NL East.

Acquiring Machado now is a move the Phillies can make with confidence because of how it impacts the present and scales for later. The iron is hot. They should strike.

LOB data from Baseball Reference. All other data from FanGraphs.


Relievers who Will Matter in the Second Half

A slump-proof, lockdown bullpen doesn’t just win games. It can effectively end them before they’re over. But relievers are weird. Even when they’re not pooping their pants, they’re probably the most volatile players in all of baseball. They seem to represent only the foremost moment in any given season, making trying to project which ones will be good largely a fool’s errand.

But there is a tool that can help, maybe: SIERA. That’s Skill-Interactive ERA. It’s an ERA estimator like FIP or xFIP, but it’s better because it accounts for more of the noise that can result from batted balls. It also has a stronger correlation to predicting a pitcher’s future ERA.

It’s important to acknowledge that it isn’t an ERA projector, but can inform us of the quality of the skills a pitcher has demonstrated most recently. And now, as the season heats up, and as potential playoff teams show more urgency, and we’re in the foremost moment the season has to offer, we can use SIERA to see which of baseball’s oddest bunch could offer big benefits in the second half. Let’s dig in.

Juan Nicasio currently has a SIERA of 2.49. His ERA is a flat 6.00 through 34 appearances. Because SIERA is best used as a starting point for evaluating a player, the disparity between his results versus how he’s actually pitched pushes us to look further. One thing that jumps out is his strand rate, which stands at a homely 53.3%. That’s 20% worse than league average for relievers. It’s probably fueled by a .396 BABIP which is a whole hundred points worse than league average, and this is all happening while he’s striking out more and walking less batters than he ever has.

The thing about Nicasio isn’t any of those wonky stats, though. It’s that it’s hard to see him not getting better while playing on a team that’s been thriving in one-run games all season. The Mariners may effectively gain a lockdown arm for their bullpen as the ledger balances for him, and they’ve already had a top ten group by fWAR. What they’re doing is unprecedented and Nicasio is another reason it could keep happening.

Harris
Photo: Karen Warren/Houston Chronicle

Will Harris would likely elicit a shrug from anyone who peered at his 4.15 ERA. His FIP and xFIP are both sub-3.00, though, and his SIERA is an even tinier 2.40. Including him here might be considered cheating in two ways: he’s appeared in ten games over the last month with an ERA of 2.70, and he’s an Astro.

He was victimized by home runs earlier in the year and has been better at keeping the ball in the park, having allowed only one dinger over the last 30 days. It helps that he’s striking out a career high, too, with a reworked curveball that’s tighter and sharper than ever. Remarkably, he might only be the third-best Astros reliever behind Collin McHugh and Brad Peacock. Maybe it’s not cheating so much as it is just unfair that the Astros could get even better with a guy they’re already trotting out there.

And then there’s a pair of Phillies, Hector Neris and Tommy Hunter. Neris has become much maligned and was even sent to the minors to figure himself out. He’s given up a homer on nearly every third flyball allowed, which is bonkers. His fastballs have flattened out, which probably plays into his splitter playing down, too. While his 6.90 ERA is woof-worthy, his 2.95 SIERA is pretty nice and tells us his fastballs being worse shouldn’t make him this bad.

Phillies general manager Matt Klentak caught some flak on talk radio for recently saying that Tommy Hunter’s 2018 has actually been one of his best. His ERA is approaching 5.00 but his SIERA sits at 2.87, so maybe Klentak’s statement gives us a glimpse into the team’s beefed up sabermetric approach. Hunter has fallen victim to similar issues as the others above — high BABIP causing a lower strand rate.

Neris
Photo: Chris Young/CP

The thing about Hunter (25.1) and Neris (30) is they’ve accounted for 55.1 innings out of the Philadelphia bullpen. Positive regression for them could be critical for the team, as others like Edubray Ramos and Victor Arano are slightly outperforming their peripherals so far. They’re on pace for 88 wins, and every inning is going to be important for them in the second half as the team pushes for the playoffs for the first time since 2011.

Looking at a pitcher’s SIERA gives us a stronger sense of their most recent performance. It can also give us a sound starting point for where else to look to understand how the moment has treated them. Beyond that, it can also help us zoom out and examine a pitcher’s potential impact on their team while we move onward to October, no matter how weird they are or have been.


Data from FanGraphs.


Examining the Struggles of Ozzie Albies Through the lens of Neuroscience

Ozzie Albies has been at the heart of his team’s unexpected push for the NL East division lead all season. He was there before Ronald Acuña came up. He’s been healthy since Acuña got hurt. He blasted through April with a triple slash of .293/.341/.647. A .647 slugging percentage! Everyone was astounded. Articles were written about how rare and mystifying it was, whether it was sustainable, and how it was nearly impossible to provide a comp for him because there hasn’t been a player like him before. He appeared to be imposing his will on anyone who dared to pitch to him.

Well, gang, May happened. And June is in the midst of happening. And while his overall performance to date still provides us great insight to the player we can look forward to, Albies has had a much tougher go of things. That triple slash slunk to .264/.306/.432 in May. So far this month, it’s at .154/.200/.346.

The good has been unprecedented; the bad has turned abysmal. Each has been more extreme than his profile ever seemed to offer. When Albies was first called up last year, Baseball Prospectus said he “has a slash-and-dash offensive approach that marries well with his advanced bat control and plus-plus speed.” But since he’s been in the Bigs, he’s been more of a free-swinging, freewheelin’ monster.

In 2017, he offered at more than 51% of the pitches he saw. Had he qualified, that would’ve placed him in the bottom 20% of the league, in the company of Yangervis Solarte and Brandon Crawford. This season he’s been even more severe, swinging at more than 55% of all pitches faced. That puts him in the bottom 5% of qualifiers. So, really, what is going on?

Neuroscience GIF-downsized_large

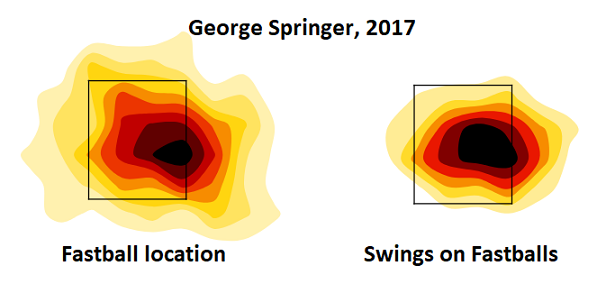
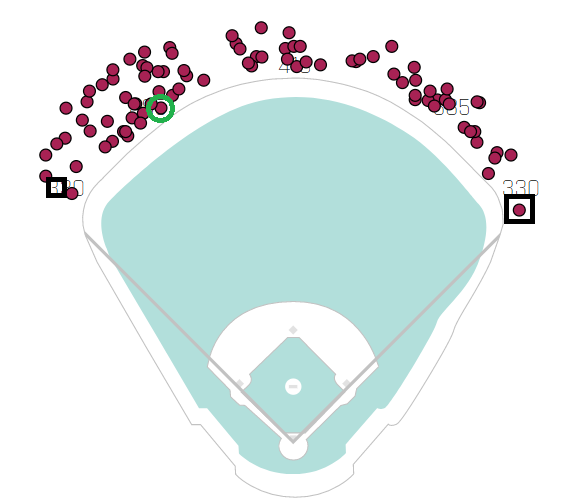
This gif shows the plate from the catcher’s view, and consists of only lefthanded plate appearances by Albies. It accounts for about 70% of his plate appearances and is where the struggles have really come in, as he’s hit only .232 from the left side as opposed to .318 from the right.

On the left side of the gif is a heatmap of Albies’s swing percentages. On the right is where pitchers have located to him. The first is through April, and the second is from May through 6/14. At the start of the season, pitchers filled the zone and challenged him. Per Baseball Savant, more than 41% of pitches he faced crossed the plate that month, and he used his exceptional bat control to punish those balls. However, since May, pitchers have thrown it in the zone far less — a shade under 33% of their total pitches to him. When you’re swinging at more than 55% of the pitches you’re seeing, but only one in three is over the plate, you’re bound to run into trouble.

There are two possible suggestions to make for Albies here. One would be mechanical, assuming something is wrong with his swing. That would probably be premature, given how good he’s been at such a young age. The other would be mental, which seems more likely. His advanced bat control appears to have convinced him that he can hit anything, so he’s going for it. But by doing so, he might be poorly manipulating the signals in his brain he uses to make contact.

Bijan Pesaran, a professor of neuroscience at New York University, explains it this way through the scope of ping pong players:

“When [they] are playing at a high level, they look at the ball up to the point where they hit it. As soon as the paddle makes contact with the ball, you can see their eyes and head turn to now look at their opponent. They think they are looking at their opponent when they are hitting the ball, but they are looking at the ball. Their eyes are tracking the ball, even though they are aware of their opponent.”

Pesaran also says that the cerebral cortex is arranged more like a mosaic than a traditional puzzle. That’s the part of the brain ballplayers would use for pitch recognition and location. If Albies is going to parts of the zone he’s unfamiliar with — parts he doesn’t approach when he’s hitting at a high level — he’s essentially attempting to rearrange the mosaic network that relays the signals from his brain to his swing. It also means he could be looking at the ball longer since he’s not used to seeing it in those places.

The result is a hitch in the 200 millisecond cycle where his brain processes a pitch and tells his body to swing, which may be causing, or at least contributing to, the struggles in which Albies finds himself swamped.

Ozzie Albies didn’t suddenly turn into a pumpkin after a flare of greatness. He’s too good for that. But he does need to adapt to a league that’s already adapted to him. His next step forward could take realizing his limits.

Pitch charts from Baseball Savant. All other data from FanGraphs. Gif made with Giphy.


Paul Goldschmidt is Hitting Homers at Home Again

What a boring headline in any other season. “One of game’s top players does good thing at plate” isn’t intriguing in nearly any context. But there’s so much to consider here. 

The D-backs started the 2018 season off gangbusters, winning nine series in a row and going 20-8 through April. They held at least a five and a half game lead on the rest of their division. And that was without Jake Lamb for most of the time, or Steven Souza, and Paul Goldschmidt off to an utterly pedestrian start. But the team was winning.

Then May happened.The injuries kept coming: Robbie Ray, Taijuan Walker, AJ Pollock, Randall Delgado, and Steven Souza (again) all hit the DL. Goldschmidt went from pedestrian to abysmal; his batting average was flirting with the Mendoza line, he was piling up Ks, and he couldn’t make contact in the zone. Arizona finished the month at 28-27, a game and a half back of the Rockies.

And that’s just the team. The humidor installed at Chase Field in the offseason has been another beast all on its own. The data that’s available on its impact to this point isn’t necessarily reliable yet because the sample size is still relatively small. It sure seems to have made a pronounced — if not definitive — impression, though. Offense is down in the desert by about 20% across the board. Add that into the mix with a team that was probably playing over its head, and then sinking, and suddenly the waters are much choppier.

Some wondered if the humidor’s presence had snuck into the back of Goldschmidt’s mind and taken up residence. Every additional out he made seemed to sell the idea. He was pushing a 200 strikeout pace. There were at-bats where he simply looked lost, and it was fair to wonder whether he’d been occupied by a Pod Person.

But he started showing signs of hope: a couple multi-hit games, a couple extra base knocks. Even if those things happened on the road, every little bit helps for a player struggling as badly as Goldschmidt was. And then, on May 30, he did something he hadn’t done even once in 2018. He homered at home. He hit a long, humpback line drive down the right field line off Sal Romano that cleared the fence. Take a look.

Diamondbacks GIF-downsized_large

Do you notice Goldschmidt’s face? It’s almost like he couldn’t believe the ball finally went out. The relief was palpable.

He’s never taken more than six games to homer at Chase Field in any season. This year it took him 27. I’m not always a fan of referencing exit velo, but it’s relevant here. Just last year, pre-humidor, he hit a homer on April 23 at Chase that came off the bat at 97.3 mph and went 390 feet. His cue shot down the line for his first homer at home this season came off the bat at 102.1 mph and traveled 349 feet. 

And then just three days and three more games after that, Goldschmidt homered again on June 2. This time, it was a towering shot down the left field line that went 431 feet and left the bat at 109.9 mph. I’ve told you both of his dingers at home this year were down the line, making them extreme. Peeking at his career home run spray chart at Chase give us a sense of just how severe they really were.

GoldyDongs

The black boxes indicate Goldschmidt’s two homers at home so far entering last week. You’ll note that the one down the left field line doesn’t actually surround a red dot indicating a home run — that’s because Baseball Savant hasn’t yet updated Goldschmidt’s most recent shot. For reference, the dot immediately above the empty box traveled 438 feet. 

You may also note that both shots this year easily push the bounds of literally every other home run Goldschmidt has ever hit at Chase Field in his entire career. Maybe, just maybe, the humidor had taken residence in the back of Goldschmidt’s mind. Just look at that green circle in left-center, the one he hit at barely 97 mph. Imagine being able to flick that pitch nearly 400 feet on a regular basis, then clobber one this season at 102 and have it barely clear the shortest fence in the yard, and only after enduring 26 dinger-less games. 

Goldschmidt can go to any part of the field on any pitch. You probably wouldn’t expect him to get spooked by what essentially amounts to air conditioned baseballs. But if the humidor did punch a hole in his game, he may have found a way to patch it by opting to work the foul lines to get the fairest results.

Game data from FanGraphs. Home run exit velocity and spray chart from Baseball Savant. Gif made with Giphy.