Author Archive

Jacob deGrom is Leveling Up

So far this year, more than 170 starters have thrown at least 10 innings. Of those starters, Jacob deGrom has been the fifth best in all of Major League Baseball. In the prior three seasons he was 12th overall, then 28th, then 12th again. He’s already been worth more than two wins…in less than a third of a season. Last year, he was worth 4.4. John Edwards noted just how berserker his start has been:

johntweet1

Nine wins, y’all. DeGrom is on pace to be worth nine wins. The last pitcher to be that good was Randy Johnson in 2004. Being that deGrom is “only” the 5th best pitcher so far this season, that means four others — Max Scherzer, Justin Verlander, Gerrit Cole, and Luis Severino — have been even better, and that they’re on pace to break that nine WAR barrier, too. Given that less than a third of the season has passed, maybe none of them will, or maybe we’re in for a heck of a season from the mound despite a ball that favors hitters.

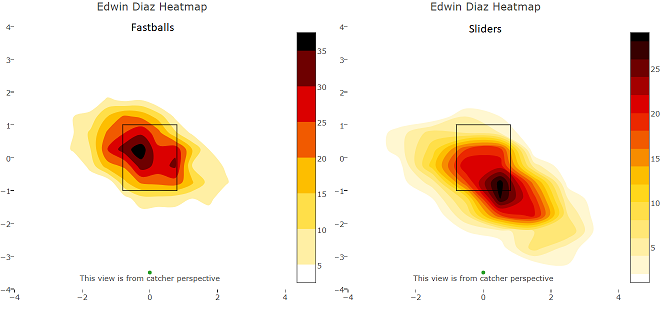
DeGrom might be of particular interest, though, because he’s showing us a completely different look this year than in the past. Just see for yourself.

Mets GIF-downsized_large

Those heat maps are all from the catcher’s perspective. DeGrom is combining his crazy high talent level with a whole new level of conviction. The result? Video game-like command that’s yielded a career-high 12.1 strikeouts per nine and a typical 2.45 walks per nine.

degromwhiffs

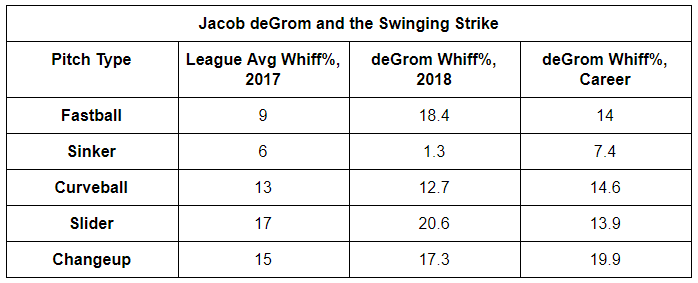
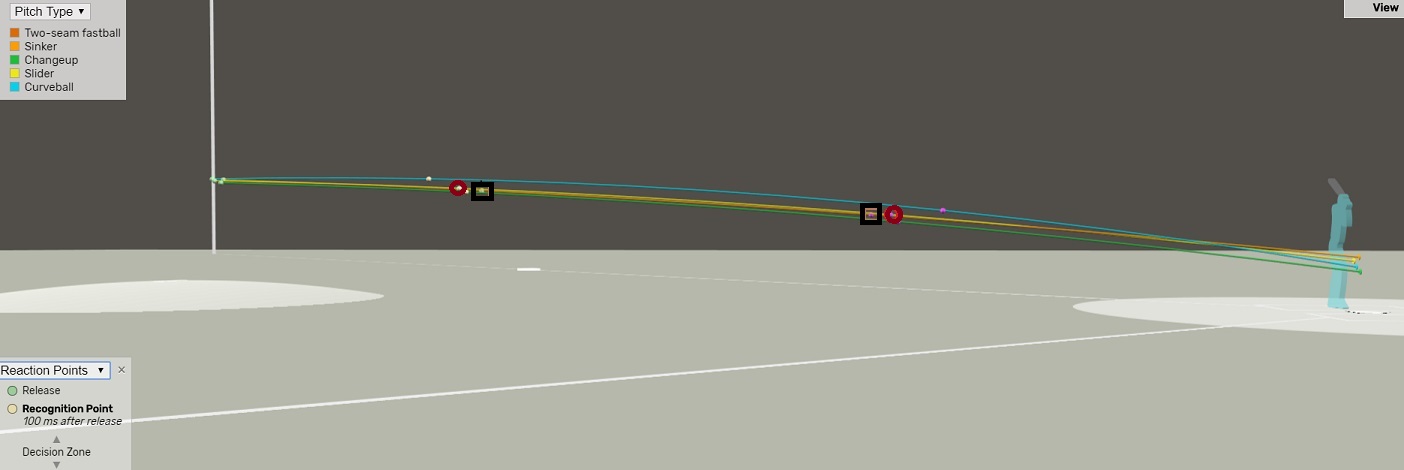
DeGrom is just baffling hitters. His four-seam fastball is generating whiffs at more than twice the average rate of the whole league. It’s always been above average but it’s off the charts this year. What’s interesting is it’s got less run right now, per Brooks, meaning it’s straighter. That isn’t fascinating on its own, but his changeup is straighter, too. Basically, the two pitches look more like each other for deGrom in 2018 than they ever have, but they’re working different parts of the zone. That means they’re creating a wrinkle for hitters that they’ll continue to have a difficult time ironing out moving forward.

All of his offerings have created pretty much league average swing-and-miss or better. There are two outliers: the slider and the sinker. Like the fastball and changeup, the slider appears tighter in its movement to the plate, with less drop but slightly more side-to-side break. I can’t discern if it’s playing up because of that, or because of his other stuff, or if he’s due for some regression on whiffs there. It’s something to keep an eye on, though.

Meanwhile, the curve is plowing away at the low, glove side corner. And the sinker isn’t a pitch anyone uses for whiffs very often, but deGrom’s has been about 80% worse than average this season. Instead of throwing it more arm side, though, he’s using the other side of the plate so it zings back to the edge of the zone to steal called strikes.

Let’s take a breath and recap. DeGrom’s generating a crazy amount of whiffs with his fastball up in the zone. He can mess with hitters’ eye level with his changeup low in the zone. The sinker can steal strikes on the edge. And then the curve and slider are breaking toward that same spot with pinpoint authority. Is this even fair?

Hitters will certainly say no, but that’s kind of the point. Bless their hearts, though; they’re trying. DeGrom’s improved command has coaxed them into 8% less hard contact against him so far this year compared to last year. That’s nice by itself, certainly. But it’s fueled almost the entirety of deGrom’s 8.6% increase in soft contact generated. He now leads the league by that measure at 29.9%. Hitters are hitting less against him, and when they do manage to put the bat on the ball, they’re making life easy for defenders.

The last pitcher to show this kind of jump — from really good to amazing — was Corey Kluber from 2013 to 2014. In 2013 he was worth 2.8 wins in 147.1 innings. A year later he was worth 7.4 wins in 235.2 innings. He generated more soft contact, too, but only half as much as deGrom has added this season, and it didn’t come directly from his hard contact allowed. He struck out about two more batters per nine than the year before. His stuff was in the zone but he didn’t quite command it like deGrom has.

There isn’t much precedent for what Jacob deGrom is doing this season. Time will tell if he maintains his new dominance, but for now he’s pacing nearly the entire league. He’s leveling up. 

League average whiff rates and WAR from FanGraphs. Heat maps and deGrom whiffs per pitch type from Baseball Savant. Gif made with Giphy.


Let’s Enjoy This Michael Brantley While we Can

It’s been a tough couple years for Michael Brantley. In 2016, he played in just 11 games. In 2017, he played in more than eight times as many…and still topped out at just 90 games. He registered a mere 418 plate appearances in that span because of injuries and was only worth 1.5 wins.

These injuries were the kind that start small, like inflammation or a sprain so often do, and cost a player a few games. Then news comes out about them being more serious than expected or about how the player has experienced a setback. And when those types of injuries start to pile up and happen in back-to-back years, it’s easy to wonder when, exactly, that player will be themselves again. Or if they ever will.

So far in 2018, though, Michael Brantley is showing us he’s back to being his vintage self.

brantley5

Alone, the numbers this season are impressive. But compared to 2014, they’re downright eerie. It’s as if he’s looking into a mirror and seeing the 2014 version of himself looking back. He was worth 6.5 wins that year. The biggest difference is that he’s traded in steals for more power — he had 23 stolen bags in ’14 and is on pace for about 5 this year — but that matches the direction of today’s game, anyway.

Everything else paints a special picture. The league’s average strikeout rate has hovered around 16.5% for the last five years. Its average isolated slugging is around .150, and the average weighted on-base average is about .325. Brantley has been 50% better than average at not whiffing, at least 20% better at driving the ball, and 60% better at creating offense. Those kinds of results put him in rarefied air.

If we look at the single season leaderboards, we can see just how rare. Here’s a list of qualified players since 2014, which was when Brantley was last healthy for a full season, who have struck out in less than 10% of their at-bats and had an ISO of .170 or better:

  • Michael Brantley, 2014
  • Victor Martinez, 2014
  • Michael Brantley, 2015
  • David Murphy, 2016

There were 537 qualifiers over that time period. It happened four times. Brantley did it twice. No one managed to do it in 2013 or 2017. While we’ll have to wait to see if they can keep it up, the only three players to do it so far in 2018 are Brantley, teammate Jose Ramirez, and Nick Markakis(?!).

In many ways, ISO and strikeout rate in tandem can inform us a great deal about who’s being productive and how. Brantley’s skill at deciding when to swing is truly unique.

But what really makes his start to the 2018 season special is that he’s 31. With evidence building over the last several years that players peak earlier than we ever thought, it was fair to wonder if the time he lost to injury meant we were all robbed of some of his best years. Aging curves consider as large a pool of players as possible, though, so getting to witness players who force exceptions is always a blast. His 15 game rolling wOBA and K% averages tell us we’re having a pretty good time.

brantley4

The bigger the gap between the red and blue lines, the better. We can see what he was like at his peak in 2014 and his valleys over the last couple years. As the space between the two lines grows in 2018, so does the one where we get to appreciate what he’s doing. We don’t know when the next injury will come or when Father Time will show up. We should enjoy this Michael Brantley while we can.

Data from FanGraphs.


Swing Speed: Exit Velocity’s More Impressive Cousin

This post was co-written by John Edwards. If you’re not already familiar with his work, you can (and should!) follow him here

Launch angle and exit velocity became a big deal when MLB released them through Statcast at the start of the 2016 season. They instantly told an old story in a new way. It wasn’t surprising to see Nelson Cruz, Giancarlo Stanton, or Miguel Cabrera at the top of the leaderboards. We knew they knocked the snot out of the ball. But now we knew that they knocked the snot out of the ball in excess of 110 mph or better, and at 34 degrees or better.

Two years later and the terms are nearly ubiquitous, even speckled through broadcasts. But they’re often provided without context as colorful notes in single instances. Do we really care how fast the ball went out in the moments we’re watching, or at what angle, as long as it went out? It doesn’t tell us how the dinger or double or snagged liner happened, just that it did; and we just saw it with our own eyes.

So, what about that how? What’s contributing to a player generating that record exit velo or optimal launch angle?

Swing speed.

Swing speed could help inform us of how well a player is tuned into their timing at the plate and where they’re making contact, both of which tell more of our old story in an exciting new way than launch angle or exit velo alone. But the problem with swing speed is we don’t have that data. It’s simply unavailable: while Baseball Savant used to feature bat speed it no longer does.

Fortunately, enough data exists that we have approximations to work with. David Marshall reverse-engineered the formula Baseball Savant used in calculating swing speed – and now we can play around with those numbers!

Let’s look at who the best hitters were by bat speed last season, with a minimum of 100 batted ball events.

swsp1

Since the formula for predicted bat speed is essentially average exit velocity (AEV) accounting for pitch speed, and AEV is the majority factor in the equation, the leaders in bat speed are also among the leaders in AEV. But there are still some differences, and they’re some very important differences! The speed at which a pitch comes in affects how fast it goes out, so players facing pitchers who throw harder might register lower average exit velocities than a player with comparable bat speed facing pitchers who throw slower.

But bat speed isn’t consistent from plate appearance to plate appearance. Sometimes you check your swing, other times you let loose. But there’s an important trade-off: many of the hitters with superb bat speed strike out frequently, and hitters with low bat speed (Mallex Smith, 50.0 MPH or Billy Hamilton, 51.0 MPH) make a lot of contact without striking out. Low bat speeds allow for more contact and fewer whiffs, but high bat speeds allow for better contact at the expense of greater whiffs. As a result, bat speed is loosely correlated to contact% (R^2 of 0.09), and better correlated to contact% than exit velocity (R^2 of 0.08).

swsp5

MLB hitters are aware of this loose correlation. Since 2015, they’ve swung .4 MPH slower than average with two strikes, collectively opting for more contact and foul balls so they can stay alive longer in at-bats. But the guys who are the best at managing this are among the best in the game at generating offense, and they don’t all necessarily slow down their swings at the same rate. However, each had a wOBA with two strikes roughly 15% better than overall league average in 2017.

swsp2

The leaders here show us multiple paths to success with two strikes in regard to players slowing down or speeding up their bats. Beyond that, we get a few bands of players worth noting. Anthony Rendon and Francisco Lindor were really in a class of their own last year when it came to generating offense. They’re the only two players who were about 80% better than the average player overall, and lost less than 60 percentage points of wOBA with two strikes. Rendon only swung .2 MPH slower in those instances while Lindor swung .9 MPH slower.

That’s not to say they were the best, though. Joey Votto (2.1 MPH slower), Austin Barnes (1.0), Mike Trout (.4), Bryce Harper (.4 faster), and Rhys Hoskins (.5 faster) generated the most offense with two strikes. Collectively, they were so much better than most of their peers that they were able to absorb a bigger drop in effectiveness with two strikes in the count and still pose a considerable threat.

Whether swinging slower or faster than average with two strikes, the way these players optimized their swing speed with two strikes informs us of their approach more than their launch angles or exit velos alone. But what about the guys at the other end of the spectrum?

Giancarlo Stanton and JD Martinez had the largest differences in offense created with two strikes of anyone in the league. You can see all the data here. Per John’s own Statcast database, they each had dips in wOBA of more than 160 points when their backs were up against the wall, implying that the way they sold out for power when they were down to their final strike really didn’t work in their favor. They both swung slower than the .4 MPH average drop in those instances, and a peak at their heat maps suggests they were way more willing to hack at offerings out of the zone, too.

A lot of their peers actually acted in a similar manner, too. It turns out that 40 of the 50 players who saw the biggest drop in wOBA with two strikes slowed down their bat in those counts. They’re even more diverse of a group of players than the ones who saw the least drop. There might not be another offensive context where you’ll see Carlos Correa ranked with Lonnie Chisenhall, or Jose Altuve with Michael A. Taylor, or Josh Donaldson with Patrick Kivlehan.

Examining players in this light provides a unique perspective to some of the game’s most critical moments. Despite the variance in the quality between these players, the 2017 approximations suggest that they didn’t exhibit much of a two strike approach at all. Slowing down your bat but expanding your strike zone to chase pitches that are inherently less hittable seems like a recipe for Ks. 

If swing speed can tell us who’s optimizing their approach at the plate — or who isn’t — can it also help us predict a outbreak? We compiled hitters with at least 100 batted ball events in 2016 and 2017 (using batted ball events since our predicted bat speed equation uses exit velocity), and saw which hitters saw the most improvement from 2016 to 2017. Unsurprisingly, swinging harder resulted in much better production at the plate.

swsp3

Conversely, most hitters who declined in bat speed declined in production (except for Delino DeShields, curiously enough).

swsp4

But having a slow bat speed isn’t necessarily a bad thing, nor should all players strive to increase their bat speed. We discussed previously how bat speed and contact% are inversely related — not swinging out of your shoes every at-bats means that you have better time to react to pitches and make contact.

For hitters like DeShields, Suzuki, and Gordon, they want as much contact as possible – their maximum bat-speed isn’t comparable to guys like Gallo and Judge, so there isn’t really a way to sell out for power here. Judge and Gallo can get away with striking out so much because the few balls that they put in play frequently go yard, but if someone like Gordon adopted that approach, the increase in power wouldn’t compensate for the increased strikeout rate.

Instead, Deshields, Suzuki, and Gordon produce by making as much contact as possible and relying on their speed to beat out hits on their weak contact. By relying on their speed and balls-in-play for production, it’s beneficial for these hitters to not swing out of their shoes.

Using bat speed to predict breakouts is similar to looking at exit velocity changes to predict breakouts, but has its trade-offs: it’s better in that it accounts for differences in pitch velocities faced, but it’s worse in that our bat speed predictions are only approximations.

They’re still something, though, and they give us more of a predictive look at what goes into making a great hitter than hearing about their launch angle or exit velo in isolated instances.


The Endless Possibilities of Franchy Cordero

At the end of April, Mike Petriello wrote on the most interesting rookie you need to know more about, Padres outfielder Franchy Cordero. The way Cordero hits the ball, paired with how he runs and can defend, make him more than intriguing. However, Petriello detailed that the margin of error within Cordero’s game could turn him into just about anything — be it Keon Broxton or Aaron Judge.

The two potential comps couldn’t possibly represent further opposite ends of the spectrum. Broxton was demoted to the minors last season and Judge was a Rookie of the Year winner and MVP candidate. So where will Cordero end up shading himself within that vast spectrum? Consider those three players in their first extended stint in the Majors.

Franchy1

Can you tell who’s who?

Players A and C are Judge and Broxton in 2016. The two had largely similar plate discipline. The biggest differences came in Broxton’s reluctance to chase out of the zone, which fueled a lower strikeout total and a high amount of walks. But in between them, as player B, is Cordero. He swung more, chased nearly as much as Judge, made the least contact in the zone by a big margin, and whiffed way more than any of the three. While these are just descriptive numbers — things we can look at after the fact — it’s easy to see how Cordero approaches the batter’s box similar as these two other guys whose difference in success could fill the Grand Canyon.

The real interesting part comes in looking at their plate discipline after their first extended stint in the Majors. It gives us a sense of how each player bought into their skill set, possibly based on the success they did or didn’t have in their debuts.

Franchy2

Notice anything? Broxton went one way in the season after his debut, while Judge and Cordero have gone the other, more productive way. Broxton simply did the things you don’t want a player to do. He reached out of the zone more, made less contact doing it, and created fewer free passes for himself. Judge reached out of the zone less, made more contact, and shrunk his K-BB rate to Rick Moranis levels. It’s funny how one decision can impact so many results.

Baseball GIF-downsized_large (3)

So far, Cordero’s second extended stint in the Majors has mimicked Judge’s. He’s trending in all the same ways and generating monster power while he’s at it. Petriello noted how he’s part of the roughly one percent of hitters in the entire league to have hit a ball 115+ mph in 2018. That single data point alone is enough to project a pretty positive profile. What he’s really doing to generate that kind of exit velocity, though, is optimizing his mechanics with his contact point. It’s even more impressive when you combine it with how he hits homers. Since Statcast went live in 2015, the greatest average home run distance from any single player is Carlos Gonzalez, at 421 feet. Giancarlo Stanton is second at 420 feet. Cordero has averaged 438 feet per bomb after six home runs so far in 2018.

The Padres seem to believe that Cordero isn’t a finished product just yet, but that he’s good enough to learn on the job. The biggest truth to that is probably most easily visible in his free swinging ways. When he came up last year, he struck out in more than 44% of his plate appearances while drawing a walk in only six percent. But this year, his improved discipline at the dish has resulted in a jump in walks of four percent and an 11% decrease in whiffs. He’s not quite stepping up to Aaron Judge levels, but he’s demonstrating that he’s learned two things. One is that he can let tempting pitches out of the zone go because the contact he does make is strong enough to wait for. The other is that just because a pitch is in the zone doesn’t mean he has to swing. In this sense, it’s like a pitcher sequencing his stuff. By letting pitches go that don’t necessarily play into his strengths, Cordero is giving himself more opportunities to meet the ones that do.

If you’ve been wondering about sample sizes for all the examples above, that’s fair. Most of them are relatively small, potentially opening them to scrutiny because they don’t provide us the stability we crave when evaluating players. But that doesn’t mean they’re useless. In this context, they act in two ways: as indicators of aggression in each of Judge, Broxton, and Cordero; and what they’ve each learned once they had a chance to stay up in the Majors.

Franchy Cordero has proven to be more than intriguing, and he’s found himself in a unique situation that many clubs wouldn’t likely provide a young player. But the Padres are in a unique spot, too, and Cordero, unheralded as he may be so far, may be critical in helping to elevate them in the standings as time moves on.

Plate discipline data from FanGraphs. Heat maps from Baseball Savant; gif made with Giphy. 


Yonny Chirinos Is Closing in on Being Awesome

Early season baseball is beautiful. It’s not that just that baseball is back. It’s that things get so weird so quickly. Take, for example, Mike Petriello pondering this:

petriello tweet

Lol, y’all. For the record, Owings is at .478 going into his game on Friday and Sanchez has worked his way to .088. So, yeah, just a few days later and things are still weird.

But some things…some things that seem weird may not be weird. Yonny Chirinos might be one of those things.

Chirinos has been on the fringe of interesting for some time. Last July, Carson Cistulli wrote about him at FanGraphs for three weeks in a row. The gist, from blurbs in those pieces, is that Chirinos tends to sit in the low 90s with his fastball but can amp it up to 96 mph. He can do it late in games, too. He also throws two offspeed pitches — a slider and a splitter — and is comfortable throwing them anytime. He’s a guy who’s gotten better as he’s faced better competition.  

And now, after injuries to Brent Honeywell and Jose De Leon and Nathan Eovaldi, Chirinos is getting the chance to face the best competition in the world. And he’s rising to the occasion again. He hasn’t allowed a run through 14.1 innings and he’s striking out six hitters to every walk. But there’s more.

Chirinos 1

Certainly, it’s early. While Chirinos is ranked here against last year’s qualifiers, he wouldn’t actually qualify yet for this year. No pitcher does, because it’s so early. Plate discipline numbers tend to stabilize quickly, though. After just his first couple games, the odds are good that hitters will continue to make contact at the same rate against Chirinos that they already have. After a couple more starts, we’ll be able to say with relative conviction if he’ll hit the zone the same way he has through his first three appearances. The same goes for the rate at which he’s coaxing swings out of the zone.

Things get a little foggier when it comes to Chirinos’s first pitch strike rate. He’s probably only a fifth of the way toward that crazy 71.7% number becoming reliable. But let’s consider how he’s done it to this point. Statcast has him at 18 called first pitch strikes, five whiffs, and eight foul balls. He’s throwing about three sinkers to every slider at the start of an at-bat, and occasionally gets funky by throwing something else. But it’s mostly a two pitch mix. And if you check the leaderboards so far, you’ll see he’s surrounded by loads of legitimate and other emerging talent.

Once he’s gotten ahead, Chirinos has done well by distributing his three primary pitches well, supporting the reports linked above from last season. His sinker runs one direction, his slider jumps the other, and his splitter acts like it’s fruit falling through the bottom of a grocery bag. In any given matchup, he can control three parts of the zone.

Chirinos 2

Just about the only way Chirinos could be making more of an impact right now is if he were going deeper into games. He’s averaged a shade over 60 pitches per appearance so far, and 64.5 per start. I don’t know if the Rays are stretching him out, or if they’re being super cautious against him facing batters a third time, or both. The team’s history may suggest they’ll eventually be willing to let him go further into games, though. The Rays rank tenth in MLB from 2015-17 in innings thrown by starters.  More than 22% of those innings can be attributed to Chris Archer alone, but it’s still worth keeping an eye on.

Either way, it’s probably fair to hedge a bet that Chirinos could continue producing really effective five inning outings and sprinkle in a few that are more than that.

Sometimes, what seems weird is actually just a new kind of awesome.

Plate discipline data from FanGraphs. Pitch mix data from Baseball Savant.


Cesar Hernandez Swings Less, Hits More

Getting talked up as a second baseman can be hard. Jose Altuve, Brian Dozier, Daniel Murphy, and Jonathan Schoop occupy a lot of that conversation. Other, older guys like Robinson Cano and Ian Kinsler are still kicking around. Whit Merrifield says hello from Nowhere, too. And then there’s Cesar Hernandez, who seems to get talked up most for how underrated he is.

He’s one of only two holdovers on the Phillies since he came up in 2013 — the other is Luis Garcia — so even after this offseason of the team shedding some of that sluggish rebuild weight and adding some bona fide muscle, they must see something in him. He’s not just an asset to turn. This is true even after signing Scott Kingery, whose primary position is the same as Hernandez’s, to a six-year extension before he’s even played a single game in the Majors.

Hernandez is remarkably consistent. He strikes out less than 20% of the time, walks more than 10%, will display occasional pop, and can handle the glove at the keystone. But even consistency needs to evolve sometimes in order to keep pace, and we may have seen the next step from Cesar Hernandez last year.

hernandez plate discipline

The change, in a word: discipline. Per Pitch Info, we can see how Hernandez apparently decided to just stop chasing pitches out of the zone. In the first half, he ranked 29th in MLB, directly ahead of Edwin Encarnacion, and fourth at his position. That’s already pretty good. But in the second half, he shot up to eighth in MLB and tied with now-teammate Carlos Santana, and second at his position.

It’s one thing to see a relatively sharp change in a stat and be able to acknowledge how a player’s performance improved or declined. It’s another to process how directly it possibly influenced his overall production. Consider that Hernandez swung at 5.2% less pitches in the second half. Nearly 80% of that decrease was the direct result of letting pitches outside the zone go. That’s four balls for every called strike.

The difference in Hernandez’s approach fueled a drastic increase in OBP and was a big reason he became 25% better than league average at creating runs. It’s no wonder he went from being worth less than a win before the All-Star break to 2.4 after it.

Check out the gifs below. They’re both of the switch-hitting Hernandez swinging from the left side at a pitch to the same outside third of the plate:

Baseball GIF-downsized_large (1)

Mlb GIF-downsized_large

The first is against a Yu Darvish fastball in May and resulted in a weak groundout to Elvis Andrus. It has a nice Fox Trax spot to show you how it was out of the zone. The second is against a Robert Gsellman fastball in September, around the same outside third of the plate, and was a double. This one doesn’t have a tracker showing you it was more over the plate, but, per Statcast, it was.

If you’ve heard of pitchers working the plate side to side, Hernandez does a little bit of the same with his swing, working horizontally. He pulls out his hips behind him and lets his bat drive through the zone on a similar plane. The small difference in pitch selection between the two gifs was the difference between a dribbler and an extra-base hit, and Hernandez made this a regular thing from mid-July and on.

It appears as though he didn’t make any mechanical change that allowed him to better cover the plate or access the ball when it got there. This is true whether he batted lefthanded or righthanded. His plate discipline, then, really does seem to be the result of simply choosing to swing at only what’s within the zone. Last August, I wrote about Rhys Hoskins being exciting in the context of the current Phillies, and how he offers a threat that the rest of the lineup doesn’t. If Hernandez’s plate discipline sticks in 2018 — the handful of games so far hasn’t allowed for a stable sample size yet — then he, too, will offer a skill that makes the lineup tougher and more of a threat.

It’s been a weird year for the Phillies already. Between Gabe Kapler and younger talent making a push for playing time, it could get much weirder. But an eye like Cesar Hernandez’s at the plate every day could help steady the ship.

Pitch Info Data from FanGraphs. Gifs made with Giphy. 


Jonathan Lucroy Might Not Be Done

Let’s start off with a guessing game. Below are two players. Try to tell who they are.

mysteryplayers

So, who are they?

Maybe the title of this post helped you figure it out. They’re both Jonathan Lucroy. Player A is Lucroy in 2016, when he was worth more than four wins. Player B is him in 2017 when he was barely worth one win. But these two lines represent the same player in name only. In 2016 Lucroy was the most valuable catcher in the game. And then last year, he was the fourth-worst.

Moving down the chart above, one could reasonably tell Lucroy’s story. Maybe the difference on balls in play is what drove him from about 40% above league average at the plate to about 10% below league average. But that wasn’t just bad luck; his contact numbers probably justify the drop. Driving the ball with less authority means hitting more playable dinkers. That creates lower BABIP and wOBA. It’s also not going to help if you hit an additional 16% grounders from one year to the next, which Lucroy did, because, those playable dinkers are the worst playable dinkers a hitter could generate.

In some sense, catchers aren’t supposed to be as good as Lucroy has been in the past. Expecting him to stay that good forever would be silly. But so would expecting him to fall off the edge of a flat earth into the same relative nothingness as Martin Maldonado. Jeff Sullivan broke down Lucroy when he was traded to the Rockies last season and found that in addition to his offensive stats cratering, so had his previously excellent framing numbers. He went from being one of the game’s very best at stealing strikes to being one of its very worst. So maybe Father Time had simply claimed eminent domain instead of moving next door. 

The numbers bear out Lucroy’s fall as much as numbers can. But the same thing that makes them so endearing — their blindness — sometimes means they still aren’t telling the whole story. Below are two gifs. On top is Lucroy as a Brewer in 2016, driving a JC Ramirez fastball up the middle. Below is Lucroy as a Rockie in 2017, pulling off of a Ross Stripling slider.

giphy2

giphy

Above, the Angels defense was presumably playing at double play depths, making a play up the middle more accessible, if still difficult. Thought it was a grounder from Lucroy, it was a screamer, coming off the bat at 100.7 mph (he averaged 87.6 in 2016). Below, Lucroy forced Corey Seager to make a bit of a play, but Seager was able to because the ball only came off Lucroy’s bat at 88.4 mph (he only averaged 85.1 last season). Both pitches were in the middle third of the plate. The swings are similar enough. But check out the stills below as the ball arrives at the plate.e.

Lucroy 2

In this picture, from when he was still a Brewer, Lucroy is very much in control. He’s square, and his body is getting ready to move together. All the MSPaint lines are moving in the same direction, showing that his kinetic chain is tuned up. That basically means his big muscles were ready to transfer power to his little muscles. The next frame shows it stayed that way. The swing is coming from his center of mass. Sure, he grounded out, but he was together. Groundouts happen.

Lucroy 1

But look at this still, from when Lucroy was a Rockie last year, and good grief. His body is moving in so many directions it looks like it’s in a traffic jam. His hands are going down and away, his hips are pulling in the other direction, and his legs are digging directly ahead. The kinetic chain is nowhere to be found, and Lucroy’s one body is effectively acting in three independent manners. Doing that on a regular basis would go a long way toward explaining his sudden inability to drive the ball, and how he lost 2.5 mph of exit velocity on average per batted ball. 

Lucroy’s legs being hurt, but not enough to sideline him to ensure they’re healed, could explain an inability to rely on his core to support his kinetic chain. However, per Statcast, his sprint times were nearly identical between 2016 and 2017. In fact, he was actually .2 seconds faster last year than the year before. But that’s only his legs. Maybe he had an issue with his core — a set of big muscles —  that kept his swing from staying in sync and glove from reacting as well when framing.

Baseball Savant only has so much video to examine. Lucroy’s broken kinetic chain in 2017 appears to be pretty consistent, though. And sure, these were different pitches, from different pitchers, with presumably different camera angles. I can’t tell you the ball was at the exact same distance from Lucroy in each instance. But a nagging injury influencing a mechanical flaw isn’t entirely implausible, even if speculative.

If Lucroy can smooth out his mechanics and is even half of what he used to be, that’s still twice as much as he was last year. Or maybe he did just fall off a cliff. But at one year and 6.5 million, it’s easy to understand why the A’s would want to find out. 

Mystery player data from FanGraphs. Gifs made with Giphy; videos from Statcast.


I See You, Jake Arrieta

In the last week Ichiro, Tim Lincecum, Carlos Gonzalez, Jonathan Lucroy, Mike Moustakas, and Lance Lynn have all signed. On Sunday, Jake Arrieta joined them, agreeing to a three-year, $75-million contract with the Phillies. That’s an average of a signing a day! Of major leaguers, to major league contracts! The dominoes are certainly falling. Finally.

Arrieta’s signing comes with curiosities. Or maybe more accurately, concerns. He has more than 1,100 professional innings on his arm. From 2014-16 he had a nasty-good run. Toward the end of it, and through 2017, his velo started to dip. Pitch Info tells us he lost two mph off his sinker between 2016 and 2017. His Ks have slightly gone down and his walks have slightly risen. At 32, he’s at an age where it’s fair to begin wondering how much further he could fall, and how quickly.

How does he adapt? Arrieta might be past his peak prime while with the Phillies, but what will he be? What can he be, and what adjustments might it take to get there? The way hitters manufactured production off him last year could help us find a path to that answer.

Arrieta wOBA

Half of his actual weighted on-base averages were higher than what Statcast tells us we should have expected. Arrieta arguably has a skill of inducing weak contact, so what this would seem to suggest is that sometimes, when hitters put the ball in the air against him, he just gets beat. The overall numbers were lower during his run of dominance between 2014 and 2016, but the actual production similarly beat what could’ve been predicted based on the launch angle and exit velocity of balls in play against him.

Beyond that, though, we see a notable split in performance against lefties and righties last year. A single year of batter splits can be dubious, but consider this the New Arrieta; one whose age is revealing diminished skill. Lefties really went to town against his sinker and slider last year. The two pitches break in opposite directions, which makes them excellent sequencing buddies from the same tunnel, but things didn’t play that way for Arrieta last year.

One reason why could be because of the break on Arrieta’s slider. Per Brooks Baseball, he lost .7 inches of horizontal break and .53 inches of vertical break on it. What does that look like? I’m glad you asked.

arrieta visualizer3

Thanks to Statcast’s incredible, fantastic, super fun new 3d pitch visualizer, we can see how that loss of break on Arrieta’s slider could have impacted its performance against left-handed hitters.

The slider is in red circles. His sinker is in black squares. The ones closer to the mound mark the point at which batters could first recognize the pitch. The ones closer to the plate tell us when batters would have needed to commit to swinging. In 2017, lefthanders saw Arrieta’s slider sooner and were able to decide on swinging against it later than his sinker. Less movement, plus less velo, plus the same tunnel means hitters faced a pitch with very little bite. And that’s how an absurd .509 wOBA happens.

From 2014-16, lefties only generated a .240 wOBA against Arrieta’s slider. Last year’s numbers are probably an outlier, but if the pitch continues to flatten out it could really threaten the viability of one of his weapons. He could consider turning the pitch into more of a true cutter to deliberately make it run further inside on lefties, or he could use it less in favor of the curveball. There’s also a chance he could take a little off the slider to widen the velocity gap with his fastball, but deliberately throwing slower in this context doesn’t seem ideal. 

Arrieta’s going to be an intriguing piece to watch on an increasingly intriguing team. The Phillies are showing they’re getting ready to contend, and his evolution as a pitcher could be key to making it happen.

Pitch mix and wOBA data from Statcast.


Power Relievers and a Third Pitch?

As spring hopes eternal so, too, do the annual Spring Training stories. Guys are in the best shape of their lives or feeling better than they have in years. Or futzing with new pitches. In fact, so many guys try new pitches that Jason Colette keeps an annual, running list of pitchers who are attempting to add to their arsenal. 

Edwin Diaz is among those attempting to do that this year by adding a changeup to his very fast fastball and exceptionally mean slider. Mariners General Manager Jerry DiPoto says that so far the changeup is “pretty firm.” He also adds that “it could be something in [Diaz’s] back pocket that he can introduce against an occasional lefty.” But does he even need it?

relievers

A glance at the top 10 relievers over the last three years tells us a few things. None of them threw any two pitches at a volume that would allow them to throw a third at a clip of 10% or more. Jansen’s and Britton’s numbers don’t even facilitate doing it for a second pitch! That 10% seems to be the tipping point at which an offering is actually useful to a pitcher. That’s when a hitter has to be accountable to it, or at least be aware of it in the back of his head. Less than that and they can take their chances focusing on what they know is coming more than 90% of the time.

The lone near-exception in this group is Roberto Osuna. After his fastball and slider, he’s thrown a cutter 9.4% of the time. He’s thrown a changeup slightly less than that (8.4) and a sinker slightly less than his change (7.4). While his repertoire might be an outlier compared to his peers, he still falls short of the 10%-per-offering threshold.

It’s important to acknowledge that each reliever’s primary and secondary pitch types aren’t listed above. They all throw different stuff. But what they use, they use similarly. In this sense, it’s kind of like taking different routes to the same destination, but each one takes the nearly same amount of time. Looking at each reliever’s individual splits shows us that almost all of them also faced a relatively even amount of right-handed and left-handed hitters. Only Miller, Chapman, and Britton had splits that tilted more distinctly one way, and that was against righties. None faced notably more lefties.

And that brings us back to Diaz. He, too, has faced more righties than lefties so far in his time in the bigs, about 14% more. Adding a pitch specifically to focus on hitters he’s seen less of, in anticipation that he might see them more, seems premature at best. Remember, the M’s moved Diaz to the bullpen because he couldn’t develop a third pitch to stick in the rotation. That’s how we get a lot of our power relief arms. As a starter, that third pitch is way more critical because of the volume of hitters per appearance. For relievers — especially the dominant ones, which Diaz is capable of being — the lack of volume is by design.

Odds are that Diaz stops fiddling with a changeup and just keeps throwing his fastball and slider as the season gets going. But nonetheless, the situation feels like trying to push a buoy underwater. It’ll just keep bobbing back up. And why the Mariners would advocate for it in this context, whether passively or actively, is very, very confusing to me.

In my day job, I’m an educator. For every lesson planned, there’s a constant inner monologue, a series of cascading questions. What’s the best way to approach the day’s goal? Does this lesson serve the unit? If not, does the lesson have enough value to still include or would it just be empty fun? What questions can I anticipate, and what answers could I have ready?

If I were the Mariners, I wouldn’t plan for Diaz to throw a changeup. If he asked to do it, I’d conference with him about why he thinks it would be effective. I’d speak to him, with evidence, about why it might be cool, but emphasize that it’s definitely not necessary to succeed. I’d map out why it makes sense for him to just throw that dang slider.

But alas, I’m not the M’s.

Data from Fangraphs.


Edwin Diaz, Throw That Slider

Pitchers are fickle beings. Relief pitchers are really fickle beings. Edwin Diaz, for example, burst onto the scene in 2016. Jeff Sullivan detailed how he generated comical whiffs with both a 98 mile-an-hour fastball and a fwippy, drops-off-the-table slider. He also worked in the zone while doing it, which is pretty much the best combo you could ask for from a pitcher.

But in 2017, Diaz essentially laid an egg. His Ks were down. His walks were up. He couldn’t stay in the zone nearly as much, so batters swung less. When they did bite, they hit him much harder than in 2016. His manager talked about how his mechanics had become wonky. He went from being the game’s 13th best reliever to being its 54th.

What’s curious about those wonky mechanics is that they appear to have only burdened his fastball. Not his slider.


diaz heatmaps.iii

Diaz throws his fastball nearly 70% of the time. More than just impacting what was in the zone and what was out of it in 2017, though, his wild tendencies with the heat also appeared to influence his pitches on the edges of the zone. Hitters were more willing to take their chances holding off on a pitch on the paint, as evidenced by a nearly two percent drop in whiffs on those offerings from 2016. With the slider, it seemed to induce more swings.

If Diaz is going to throw the fastball so much, then the obvious tweak he needs appears to be with that offering. But what if the Mariners looked at what Diaz has done best in his time in the Majors, and tried to amplify it?

diaz woba

Overall, Diaz’s fastball hasn’t been terrible. But it hasn’t been good, either. By wOBA, it ranks 137th out of 354 pitchers in the last two years. It was beaten up by righties in 2016 and then lefties in 2017. Even if the year-to-year stickiness of those numbers isn’t necessarily reliable, the real hammer has always been the slider. It’s yielded a meager .187 wOBA. By expected wOBA, Statcast actually says it’s even been 22% better than that. Diaz simply upping its usage would likely bring more whiffs for him. The pitch generates a greater percentage of swings and misses (33.8) than the fastball gets misses and called strikes together (30.4).

There’s also this: Diaz throws the slider 15% less to lefties than to righties, who have also hit his fastball harder and more consistently. He has room to use it more against opposite-handed hitters, and doing so seems like a natural progression.

Image result for edwin diaz slider gif

Beyond that, there might be two things Diaz could tinker with in regards to his breaking ball that could enhance his overall game. He primarily pounds the low, glove side corner of the zone with it. Commanding the pitch to additional parts of the zone — say, in the vein of Kenley Jansen’s cutter — would force hitters to attempt to be more accountable to it, while still being subjected to its devastating drop. This could pair really well with a more erratic fastball, too. If a batter has to be aware of the slider breaking in different portions of the plate, they could be coaxed to swinging at a wilder heater coming at them 10 mph faster.

While it would require more sophistication and time, Diaz could also adjust his arm slot for his slider depending on the handedness of a batter to give it a different look. This may come with more caveats than benefits at first. Max Scherzer has said this kind of approach takes years to master. Zack Greinke has suggested it provides one globby, less useful look more than two distinct ones. And of course, Diaz has already been cited as having control issues at times. But the fact of the matter is he’s young and immensely talented and finding ways to make his slider more of a weapon should be a priority. It could be what makes his potential dominance undeniable.

Data from Statcast; gif from PitcherList.