Author Archive

James Paxton Is Not the “Next Sonny Gray”

The Yankees kicked off their offseason by acquiring LHP James Paxton from the Seattle Mariners to bolster their starting rotation. You won’t find anybody willing to deny Paxton’s immense talent, but it’s natural for people to scrutinize big acquisitions, especially when the big acquisition is on his way to New York. This scrutiny is best exemplified by a conversation I had with my mother on the day the trade was made. My mom followed the Mets of the mid-to-late 1980s when she lived in Brooklyn, went years without watching baseball, and has watched the Yankees for the past decade by product of my fandom. This leads to the amusing circumstance that she is very familiar with current broadcasters Keith Hernandez and David Cone, all of the recent Yankees players, and almost nobody in between. Our conversation on the day of the Paxton trade went something like this:

Me: The Yankees picked up a hell of a pitcher named James Paxton. I think he’s going to do big things for the Yankees next year!

Mom: Yeah, sure. Isn’t that what you said about Sonny Gray?

Okay — she got me there.

Read the rest of this entry »


J.D. Martinez Will Be Productive in Six Years (And Maybe Seven)

While baseball fans wait for the free agent market to finally unthaw, J.D. Martinez waits for a contract offer enticing enough for him to sign. Early reports suggested that Martinez and his agent, Scott Boras, set an early asking price at seven years, $210 million. Clearly, nobody has taken the bait. Among Martinez’ likely suitors, many have moved onto other options; the Cardinals traded for Marcell Ozuna, and the Giants traded for Andrew McCutchen, seemingly leaving the Red Sox as Martinez’ lone serious suitor.

The latest report, from Buster Olney, is that Martinez has an offer on the table from the Red Sox worth five years, $100 million. Taking the reports at face value (although Boras himself has simply declared the report “inaccurate”), the offer obviously comes up short of Martinez’ demands, which is why this article is being written in late January to begin with. To that end, here’s an excerpt from Jeff Passan’s recent column at Yahoo Sports on baseball’s economic system:

Recently, one of the best free agents available this offseason met with a friend, and he admitted something shocking: He was preparing to sit out until the middle of the season. The market for his services this winter was so thin, the offers so incompatible with his production, that he worried he was going to need an external force to compel teams to pay him what his numbers say he’s worth. Maybe it would take a playoff race.”

Can we assume that the hitter in question is Martinez? Of course not, but considering the discrepancy between his asking price and the reported Red Sox offer, it wouldn’t be an outlandish guess. While I understand that the Red Sox have leverage in that they presumably don’t have anyone to bid against, I will argue that Martinez will be well worth a contract in excess of 5/$100M.

From 2014-2017, his Age 26 through  Age 29 seasons, Martinez posted an astounding 149 OPS+ (my apologies for not using wRC+ in this column!), with a low of 139 and a high of 166. To that end, I researched players from the DH era (circa 1973) that posted an OPS+ between 140 and 160 in their Age 26 through Age 29 seasons. Presumably, these players would make for suitable Martinez comps as we attempt to project his offensive production over the next five to seven years. Of course, some of these players are still active and haven’t played enough to give me complete data, such as Ryan Braun, so they have been eliminated from the dataset. I was left with 38 comparable players, which is a large enough sample for our purposes today.

In this chart, I condensed the sample into averages because 40 rows and 9 columns doesn’t embed so cleanly. These are Martinez’s comps for their age-26 through age-29 seasons, their offensive production for the next five years (through age-34, which is Martinez’ floor value at this point) and then their production in the sixth and seventh following years (ages 35 and 36, which represent Martinez’ ceiling value at this point).

J.D. Martinez Age 26-29 Comps Through Age 30-34, 35, and 36
Age Average OPS+ Average PA/Season Sample Size
26-30 147 637 38
30-34 134 559 38
35 124 512 36
36 117 447 33

The average player from my sample posted a 147 OPS+ in their age-26 through 29 seasons, which matches up neatly with Martinez’ 149 mark. You’ll first notice the drop off in production for these players in their age-30 through 34 seasons. There are several reasons for this. Yes, natural decline was at work, but the original search for Martinez comps included a 2000 plate appearance minimum; this means I was guaranteed to be given players both as good and as healthy as Martinez in their Age 26-29 seasons without the same guarantee they would be healthy in the years that followed. This also means players like Mark McGwire (146 OPS+ in 1913 PA) were excluded from the sample because he was injured, despite the 189 OPS+ he would put up in 3462 plate appearances through Age 36.

Nevertheless, it’s a reasonable regression one can expect for players entering their 30s, and the good news is that they were, on average, very productive (134 OPS+) and very healthy (559 PA). This is what the Red Sox believe to be worth 5/$100M, but I would argue that this data shows they should be willing to tack on a sixth year without blinking. Of the original 38 player sample, 36 players played their age-35 seasons; they were still very productive (Khris Davis has been producing along these lines the past two years) and healthy enough to play a full season.

The real question surrounding Martinez is – or at least should be, if the market weren’t so cold – whether he should be given a seventh year or not. From his comps, the sample size drops significantly for the first time down to 33, the average playing time falls below the league qualifying minimum for the first time, and the production drops below what you’d want from your DH (the reference point here would be Miguel Sano from the last couple of seasons).

At face value, I would absolutely give Martinez the sixth year, and absolutely not give him the seventh. At the same time, we should dive into our sample a little deeper and discover why some players did well and why others tanked in their 30s; perhaps there is something we can correlate with Martinez so we can get an even better projection. From the original sample, here are the twenty best performers in their age-36 seasons (based on a combination of plate appearances and OPS+).

Twenty Age-36 Producers
Rank Player OPS+ PA Rank Player OPS+ PA
1 Rafael Palmeiro 141 714 11 George Brett 123 528
2 Mike Schmidt 153 657 12 Robin Yount 102 629
3 Dave Winfield 159 631 13 Wade Boggs 142 434
4 Chipper Jones 176 534 14 George Foster 121 504
5 Carlos Delgado 128 686 15 Brian Giles 110 552
6 Jim Thome 150 536 16 Dave Parker 92 647
7 Bobby Abreu 118 667 17 Alex Rodriguez 111 529
8 Fred McGriff 110 664 18 Vladimir Guerrero 98 590
9 Eddie Murray 115 625 19 Ken Griffey 99 472
10 David Ortiz 173 383 20 Bernie Williams 85 546
Average 140 610   Average 107 543

The reason I picked the twenty best rather than the top and bottom ten is that the bottom ten would be littered with folks such as Cliff Floyd or Dale Murphy, who only came to the plate 17 and 63 times respectively during their age-36 seasons. Using the ten best players captures those who were magnificent offensive performers with full playing time. Using the next ten players captures those who were mediocre in full playing time. This looks good to me.

This would be the time for me to explain why I haven’t mentioned WAR in this piece: J.D. Martinez has been horrible on defense!

He was best suited as a DH years ago, but being on a roster with Victor Martinez and then being traded to the National League forced him to play right field, which depressed his value. If Boston signs him, he’ll see absolutely no time in an outfield that will be covered by Jackie Bradley, Mookie Betts, and Andrew Benintendi for the foreseeable future. As a DH for the rest of his career, Martinez will be solely judged by his offensive production and ability to stay on the field.

Again, our question is whether Martinez receiving a seventh year is justified. More specifically, this boils down to “In seven years, will Martinez be in the left column or the right column?” Both sides of the list contain incredible players, but there’s a way to make a reasonable projection. Here’s the same list, but instead of rank, you’ll see the positions these players spent significant time. Those who had significant time at 1B/DH are highlighted in gold.

Twenty Age-36 Producers (By Age)
Position Player OPS+ PA Position Player OPS+ PA
1B/DH Rafael Palmeiro 141 714 1B George Brett 123 528
3B/1B Mike Schmidt 153 657 CF Robin Yount 102 629
RF Dave Winfield 159 631 3B Wade Boggs 142 434
3B Chipper Jones 176 534 LF George Foster 121 504
1B Carlos Delgado 128 686 RF Brian Giles 110 552
DH Jim Thome 150 536 RF Dave Parker 92 647
RF/LF/DH Bobby Abreu 118 667 3B/DH Alex Rodriguez 111 529
1B Fred McGriff 110 664 DH Vladimir Guerrero 98 590
1B Eddie Murray 115 625 CF Ken Griffey 99 472
DH David Ortiz 173 383 CF/DH Bernie Williams 85 546
Average 140 610   Average 107 543

In this exercise, let’s consider 1B/DH to be significantly less stressful positions than the others. After all, there is a significant correlation between time spent in the field and sustaining an injury that leads to decline. While players like Brian Giles, Dave Parker, and Ken Griffey Jr. saw injuries and offensive decline catch up to them after years chasing down balls in the outfield, players like Rafael Palmeiro, Carlos Delgado, and Jim Thome aged extremely well by not exerting the same stress in the field.

Martinez is almost certain to spend no time in the field at Age 36. Hell, he might not spend much time in the field ever again. So I consider him a slam dunk to be placed in the group on the left. Referring to the averages from the first chart in this article, I’ll the over on Martinez when the time comes. To be clear, I donJD’t necessarily think he should be given the seventh year outright – an option would probably be most appropriate – but I think this data solidifies my comfort in giving him a sixth guaranteed year.

In a winter in which the market is changing in ways we have never seen before, it’s difficult to predict what  Martinez will earn. It’s important to remember that dollars are a construct; we can’t assume Martinez will get $150 million from the Red Sox because Adrian Gonzalez did after amassing similar numbers. Teams like the Red Sox are wary of contracts like the one given to Gonzalez, who will earn $21.5M from that deal this year. In this market (or lack thereof), it’s impossible for me to put dollars or years on Martinez, but I do know this: Martinez is a special hitter, and he’ll age especially well.

He will be a productive hitter for the next six or seven years, and there’s no dollar amount that can change that.


Alex Cobb Will Be One of the Gems of This Free Agent Class

Of the pitchers hitting the free-agent market this winter, Alex Cobb is not likely to receive the most fanfare.

Aces Yu Darvish and Jake Arrieta will command contracts north of $100 million. Closers Wade Davis and Greg Holland will do their best to secure four-year deals with big price tags. The whole world is watching every development in the Shohei Ohtani saga. Hell, among midmarket starting pitchers, MLB Trade Rumors predicts Lance Lynn to receive a more lucrative contract than Alex Cobb.

Cobb, who broke in as a full-time starter with Tampa Bay in 2012, has historically shown great promise and good-but-not-great results. He averaged 2.5 fWAR from 2012-2014, lost the next two seasons to Tommy John surgery, then came back with a 2.4 fWAR season in 2017. Cobb has never started 30 games in a season, nor has he ever thrown 200 innings. These facts are concerning to some, but I would argue that he is one of the wisest investments one can make this offseason.

Alex Cobb has evolved as a pitcher through pitch selection. Cobb has a great curveball. You either already know that, or you’re about to find out. He also mixes in a four-seam fastball, a splitter, and a sinker. Right now, curveballs are all the rage in baseball, resulting in tremendous success for pitchers like Rich Hill, Trevor Bauer, and Lance McCullers. They throw their curveballs so often that we can consider the breaking ball, not the fastball, to be their primary pitch. Like Hill, Bauer, and McCullers, Cobb has a quality breaking ball, so it stands to reason he should throw it more often and perhaps eschew his mediocre offerings. With Brooks Baseball, we can track the usage rate on each of his pitches throughout the season.

Look at the first couple data points for the usage rates on his pitches, and then compare them to his points at the end of the season. It’s clear that Cobb began to realize he works best by using the fastball and the curveball exclusively, so he increased his usage rate on those pitches and gradually phased out the splitter and sinker.

The question for Cobb is whether this was a good idea. In Cobb’s career, he’s only posted a strikeout-to-walk percentage (K-BB%) above 15% twice, and only ever so slightly so. He’s not bad in that regard, but it’s not where he makes his bread and butter. Fortunately for Cobb, he is one of the better pitchers in the league at inducing ground balls, which we know is favorable contact. The more grounders Cobb induces, the better he gets, and his curveball is a ground-ball machine. Consider the correlation between the rate at which Cobb increased his curveball usage and his ground-ball rate (GB%) throughout the season:

That’s a pretty strong correlation. It seems that Cobb is ready to join the Hills, Bauers, and McCullerses of the world and ride a high breaking-ball-usage rate to breakout success. Of course, it’s never going to be that easy for Cobb or anybody, but let’s go through one of his starts and parse what we can from the good and bad.

On September 4, Cobb pitched against a red-hot Minnesota Twins lineup and had one of his better starts of the season. His first batter of the game was second-half monster and fly-ball connoisseur Brian Dozier, and he managed to get him out on the first pitch.

It’s been proven that batters from the “fly-ball revolution” can be neutralized if you throw them high fastballs. These hitters are swinging up to lift the ball, but it’s difficult to put much lift on a high pitch coming in fast.

We’re going to focus on the curveball throughout this piece, but here is a fun fact about his fastball. Cobb’s heater sits at 92 MPH and had a spin rate of 2101 RPM this season, which seems pretty pedestrian. However, among starting pitchers with at least 100 batted-ball events involving fastballs, Alex Cobb’s has the 31st lowest exit velocity (87.1 MPH). To put this in perspective, that’s a better mark than James Paxton, Chris Sale, Max Scherzer, Jon Gray, Justin Verlander, and Luis Severino.

Cobb was smart to bait Dozier here, and he reaped the benefits with a first-pitch out to begin the ballgame.

In the second inning, we see Cobb pitching out of the stretch and unleashing a curveball that Ehire Adrianza buries into the ground. This will be the common theme today.

I mentioned earlier that Cobb doesn’t have the K-BB% of Chris Sale or Corey Kluber, so every once in awhile he walks batters. The common thought is that Cobb, who throws so many breaking balls, might end up behind in the count thanks to misplaced curves. Then, to get back in the count, he throws his 93 MPH fastball in the zone, which gets crushed by every hitter expecting it.

This would be a bad habit for Cobb to fall into, but he certainly didn’t in 2017. Consider the list of pitchers who threw the most curveballs while behind in the count this season (via Baseball Savant):There’s Cobb, in fifth place, not far behind Rich Hill himself. All five of these guys have great curveballs, so it makes sense for them to Trust the Process and continue dropping the hammer rather than submitting to doom and throwing a predictable fastball in the zone.

After walking the leadoff batter to start the third inning, Cobb knew Joe Mauer could make him pay. So rather than giving Mauer the fastball he wanted, Cobb began the at-bat by dropping a curveball for a strike that even froze the great Mauer.

This changed the whole at-bat, because now Mauer didn’t know whether Cobb would be coming at him with the curve or the fastball. Cobb took advantage of his opportunity, used the fastball to get him in an ideal 1-2 count, and then he went back the curveball and got Mauer to ground into a double play.

Cobb is comfortable throwing the curveball both behind in the count and with runners on base, so he can reap the rewards and induce quite a few double plays. That is an asset. Additionally, Cobb is comfortable throwing his curve from both the stretch (as we saw against Adrianza and Mauer) and from his big windup, as you can see here.

Eddie Rosario is a good hitter who made great strides late in the season, but even he found himself to be another ground-ball victim of Cobb’s curveball.

By the fifth inning, Cobb was almost through his second time against the Twins’ batting order. At this point, they weren’t sure whether to expect the curveball or the fastball, so Cobb was often ahead in the count. Here, he has Eduardo Escobar in a 1-2 count and throws a high fastball that Escobar swings right through.

Everyone in the park was expecting Cobb to throw the curveball to finish Escobar off. From a look at Escobar’s swing, it’s safe to say he was expecting a curveball himself. Cobb’s fastball isn’t necessarily anything special, but the way he uses it to pitch off the curveball can be.

With two outs in the inning, Cobb faced his 18th batter (which would complete his second time through against the opposing batting order). He quickly got Ehire Adrianza into an 0-2 count and then unleashed his best curveball of the night, which Adrianza pounded into the ground for another easy out.

At this point, Cobb had gone through the opposing order twice, pitched five innings, and only given up one run. Teams around the league are beginning to realize that most of their starters simply shouldn’t go out for the third time through the order, even if they are rolling. The Houston Astros just rode using Lance McCullers, Brad Peacock, and Charlie Morton in tandems all the way to the World Series. Those three guys are valuable pieces, and if Cobb is utilized liked this, so is he.

Unfortunately for Cobb, his pitch count was at 85, so his manager decided to bring him out for another inning. The Twins got their third look at Cobb, and I don’t need to cite the statistics to you about what happens at this point. Hitters are smart, so they can pick up on the tendencies of a pitcher if they see him so many times. Alex Cobb, as great at he was through five innings and two times through the order, is no exception to this rule.

Here is Joe Mauer taking an 0-2 curveball from Cobb and driving it into the gap in center for a double.

The important question here is, “was that Cobb’s fault or just a good piece of hitting from Joe Mauer?” Of course, the answer in baseball is always going to be both, but you can see in the embedded GIF that Cobb doesn’t necessarily leave the pitch up. In fact, if you compare it to the curveball that Cobb threw earlier in the game to get Mauer to ground into a double play, it doesn’t look much different — maybe an inch or two higher, at worst. The bigger change is Mauer, who swings like a guy fighting to stay alive in the first GIF, then like he knew exactly what was coming and how to handle it in the second.

This is the “third time through the order” effect in a microcosm. Pitches that fool batters earlier in the game become cookies, so the key is to relieve your pitcher while his pitches still fool the batters. Cobb should not be penalized by us for giving up a double to Mauer there; in 2018, analytical teams will be bringing in a new pitcher in these situations.

In this sense, Cobb is the first free-agent test case for the newest pitching trend in the industry — the tandem starter — one who pitches twice through the order, hopefully gets 15-18 outs, and then gives way to someone else. The Mets, who hired progressive Indians pitching coach Mickey Callaway to be their new manager, have made it clear that all starters not named deGrom or Syndergaard will be shielded from facing lineups more than twice in a game. Baseball has never experienced a shortage of five-inning pitchers in its history, but these changes in pitcher usage are leading to new premiums for these specialists.

It’s as simple as this: every team wants to stock their pitching staff with Alex Cobbs. To be clear, every team wants a Justin Verlander, but there is only one Justin Verlander; even horses Chris Sale and Corey Kluber showed significant wear and tear in October. To combat this dilemma, the Houston Astros deployed Lance McCullers, Brad Peacock, and Charlie Morton in five-inning tandems and rode them all the way to the last out of Game 7.

I expect Alex Cobb will fit into this role quite nicely for whichever team he signs with.


It’s Time to Revisit Eric Thames, Human Cyborg

Note: This article was originally published at The Unbalanced, with minor alterations

One of the best early stories of this season was that of Milwaukee Brewers first baseman Eric Thames. Thames, a former prospect who never developed into anything more than a journeyman (he was once traded for Steve Delabar, which is a rite of passage for all middling players bouncing around the league), decided to take his talents to the NC Dinos of the Korea Baseball Organization. The legend of Eric Thames begins there. He hit .345 in the Pacific, with 145 home runs in three years. After three years of doing his best Barry Bonds impression, he sought to return to Major League Baseball as a conquering hero this year. Based on what he did in April, that return went exactly as he intended.

Thames became the talk of baseball by that point, and universally praised by the online community. FanGraphs ran four articles and a podcast about him in one week, Baseball Prospectus declared that pitchers are as careful with him as they are Bryce Harper, and even our own Quinn Allen profiled the role his confidence plays in his game. April was a great comeback for Thames, but he has not been as hot since the calendar turned to May:

Everything that made Thames’ April so special dried up to his previous journeyman levels in May. His batting average dropped from “Barry Bonds” to “Mario Mendoza.” He only hit four home runs, three of which came in May. His on-base plus slugging (OPS), which measures how well a hitter can reach base, hit for average, and hit for power, was so low that it rivaled his .727 mark in the majors before leaving for Korea. Additionally, his Batting Average on Balls in Play (BABIP), which measures the role defense and luck plays in a batter’s success, went as south as one can go. This suggests that Thames was the recipient of luck in April, or that something went horribly wrong in May; for Thames, it was the latter.

In May, Thames dealt with a hamstring issue and a bout of strep throat. The hamstring is probably the injury to focus on, because it affected the physical approach Thames took at the plate. I believe that Thames, whom I consider something of an equal to Edwin Encarnacion, is not the player we saw in May and that he will return to his mashing ways after fully recovering from injury.

Normally, I would never bother writing an article in support of a struggling player by citing his injuries, but Thames is a special case because our data sample on him is so small. The idea that a journeyman in the MLB can come back from South Korea and hit like he did in April has drawn many skeptics. Reportedly, Thames has been drug tested five times already this season, and it’s easy to compare his May production to his early career production before going overseas. I want to point out some of the consequences Thames’ hamstring injury has had on his batted ball rates, and then point to the positives:

As you can see, Thames suffered drops in line-drive rate, pull-percentage, and hard-hit percentage; all of these are tell tale signs of a hamstring injury. Fellow writer Quinn Allen, who played college ball at Douglas College, talked to me about the direct causes and effects between the hamstring injury and those rate changes:

“A hamstring injury in Thames’ left leg, the loading leg, can inhibit his ability to pull the ball with power because he generates a lot of his power from the lower half — it’s the back leg in his stance, after all.”

He continues:

“Even though Thames has a very simple swing with minimal movement, not being able to fully use his lower half has affected his ability to turn on pitches for a high exit velocity on a consistent basis.”

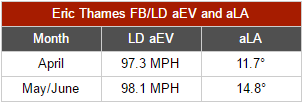
Indeed, Thames has struggled to hit fastballs with the hamstring injury. In April, Thames posted a 90.8 MPH Average Exit Velocity (aEV) on fastballs, six of which accounted for his 11 home runs. Since May, that number has decreased all the way down to 86.2 MPH. While we can draw a direct line between Thames’ injury struggles and his struggles at the plate, there are more reasons to be optimistic that he will be back in form soon. There are some positives in Thames’ batted ball rates that I found very interesting:

Despite being limited by his hamstring troubles, Thames avoided rolling pitches over and hitting more ground-balls; in fact, it seems that he made a conscious effort to avoid just that. While decreasing his ground-ball rate, he posted a big uptick in fly-ball rate, all while continuing to avoid pop-ups. Additionally, his soft contact rate only increased minimally; this means that the drop in hard contact we saw earlier was distributed to his medium contact rate. In other words, Thames’ results may have been less productive, but he was never quite weak. There are more encouraging signs that Thames is maintaining the same solid approach that is conducive to generating power:

Thames may be getting less juice on his fly-balls, but he is certainly still hitting the snot out of his line drives. As Quinn alluded to, once the hamstring is fully healed, Thames will be able to transfer the power he is putting into his line-drives back to his fly-balls. David Cameron of FanGraphs noted in April that Thames produced a stellar 97.2 MPH FB/LD aEV. By combining the two batted ball types together, Cameron was able to point out that Thames hammers both fly-balls and line-drives. Even though he isn’t hammering his fly-balls with the hamstring injury, maintaining the damage on line-drives indicates that he will return to hitting fly-balls with authority.

We noted earlier that Thames is hitting fewer line-drives since May; conventional wisdom would conclude that he would probably have had better success while injured by not trying to hit as many soft fly-balls and instead concentrating on hard line-drives. This is an approach that Red Sox shortstop Xander Bogaerts took to deal with the cold weather in April:

“I mean in April it’s not easy to hit home runs,” Bogaerts said to WEEI. “You’re playing in Boston. I know the wall is right there but it’s pretty hard to hit in the cold in general. We’ll hit some home runs, especially when it starts warming up. Looking forward to a lot of home runs from a lot of guys.”

He continues:

“I mean the cold is good and bad for me,” he said. “The good part is that it helps me do a little bit less. My effort level goes down because it’s kind of cold. But when it warms up I start swinging a bit bigger. You feel stronger because of the sun and whatever. The cold is good because I just try to do more contact, don’t want to get jammed or off the end for my hands to feel pretty bad.”

Thames, as we can see in our chart above, is not taking that line-drive approach. His Average Launch Angle (aLA) has only increased (as has his fly-ball rate), which was par for the course for him, but not a player with a bad hamstring. While it’s easy to criticize Thames for not adjusting accordingly, it’s probable that keeping consistency is better for him in the long run. When the hamstring heals and the power returns, Thames will not have to adjust back to his April tendencies, because his swing plane is already where it needs to be. To me, that is a good sign that he will be back with a vengeance soon.


Luis Severino, a Changeup, and a Little Bit of Luck

Luis Severino had a great 2015 in his two-month debut, and was supposed to take a big step forward in 2016. Luis Severino took a big step backward in 2016. He was sent back to Triple-A in May, and when he came back late in the season, he was almost exclusively used as a reliever (albeit with incredible results). The reason for his struggles is pretty clear, even on the back of his baseball card – a 1.39 HR/9 rate. So clearly, the homer problem is what we’ll be looking into today, but what if I showed you this?

Severino 1

*as SP

You’ll see that I only used his numbers as a starting pitcher; they would be skewed in his favor if I included his dominant innings as a reliever. Even so, the number of fly balls were extremely low, he wasn’t being hit very hard…in fact, he was generating a lot of infield pop-ups and a lot of soft contact in general. This is the opposite of what one would expect from a pitcher with a homer problem. It gets even weirder.

Severino 2

His issue in 2016 was homers, but in the roughly one-third of his innings as a starter in the first time against an opposing batting order, he beat the league average and his own 2015 mark, which had actually been below league average. And for good measure, in the other roughly one-third of his innings that he was a relief pitcher, he gave up zero home runs. That’s befuddling. But there is a silver lining to this; we now know where the problem is. Clearly, Severino’s problems lie in the second and third time through the opposing order. We can finally find the glaring problems there.

Severino 3
Severino’s problems can be summed up in this table. While his groundball rate was still healthy and even above league average, there was still a significant decrease from the 51.9% mark he posted in 2015 in the same circumstances. When his groundball rate dropped, his line-drive rate rose to the point that would tie Mike Fiers for the league lead (and that isn’t a good thing). So the increased line drives were part of the problem, and as the saying goes, increased line-drive rate equals higher BABIP. In Severino’s case, “higher” means .394, which is, by the nature of the statistic, absolutely unsustainable. Additionally, the 3.0 HR/9 is extremely ugly (as expected, since this is where we deduced the homer problem to be), and yet the HR/FB rate can expect positive regression as well.

Now, before we pin all of Severino’s troubles on luck, let’s remember that he is responsible for turning those ground balls he was getting in 2015 into line drives. Severino went from throwing his changeup 12.8% of the time in 2015 to only 8.9% in 2016, essentially becoming a fastball/slider only pitcher. Without an offspeed pitch or even a third offering of any sort, Severino naturally became rather predictable as the game went on. I am not sure exactly why Severino scrapped his changeup, and this Eno Sarris chart you’re about to see will only puzzle us further.

eno sarris changeup

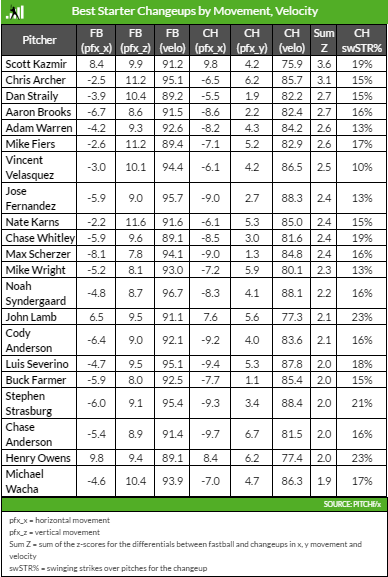
The entire article deserves a full read for context, but by Sarris’ metric, Luis Severino had the 16th-best changeup among starters in 2015. Maybe there are some imperfections with PITCHf/x, maybe the sample size was too small, but batters only hit .222/.323/.259 against it, so the results back up the metric. That kind of effectiveness would have gone a long way for Severino in 2016. To the Yankees’ credit, the only instructions they gave Severino when he was sent back to the minors were to work on his changeup. Later in the season, after the Yankees called him back up to New York, Severino was deployed as a relief pitcher, allowing him to continue his two-pitch ways.

Clearly, there are two factors we were able to pin down that derailed Luis Severino. Some of the problem for him was terrible luck, as the .394 BABIP and 31.0% HR/FB are likely to come back down to earth. Some of the problem was self-inflicted, like the abandoning of his changeup, which at 57.9% in 2015 was a groundball machine, leading to more line drives in 2016. The recipe for success is there for Severino, both in his right arm and in the wishes of the Yankee management. Take spring-training stories for what you feel they are worth, but it sounds like Severino is working on reincorporating that 2015 changeup back into his repertoire. If it is indeed back, beginning with his first start scheduled for April 7, expect Severino to take the step forward in 2017 that he was supposed to take in 2016.

All stats via FanGraphs


Mark Trumbo and Fitting a Square Peg in a Round Hole

A long, slow dance in free agency for Mark Trumbo culminated with a three-year pact worth $37.5M to return to his 2016 team, the Baltimore Orioles. Trumbo, a classic slugger, reportedly hoped for an extra year and a total value of $75-80M on the heels of a season in which he led Major League Baseball with 47 home runs. Those who favor traditional statistics would point to Trumbo’s home-run totals and argue that he is one of the premier sluggers in the game, but in a baseball landscape run by the sabermetric crowd, Trumbo is seen as a one-dimensional player. In this chart, we will look at statistics that paint the picture that Trumbo is a one-dimensional player.

Mark Trumbo and His Contemporaries (2016)

Player 1st Half BA 2nd Half BA UZR/150 Baserunning Runs fWAR
Mark Trumbo .288 .214 -9.9 -2.0 2.2
Mark Reynolds .283 0.1
Chris Carter .213 0.9
Jose Bautista -9.3 1.4
Joe Mauer -2.2 1

It is argued that Trumbo’s year was inflated by an unsustainable .288 batting average in the first half, comparing him to Mark Reynolds, a cautionary tale of a player who peaked with a rather one-dimensional 44-homer season of his own. This is only accentuated by the fact that Trumbo’s batting average collapsed to .214 in the second half; this is nearly identical to fellow 40-homer masher, Chris Carter, who was non-tendered for being one-dimensional himself. Incidentally, Carter has been mentioned as a cheaper and nearly as valuable alternative for teams unwilling to make the splurge this offseason on Trumbo. On the field, Trumbo has been worth just about -10 runs per 150 games, which is more negative value than Jose Bautista, who was ravaged by injuries this season. On the bases, he provided enough negative value to compare to Joe Mauer, a former catcher.

There are several issues with this argument, though. The first is that Trumbo’s 2.2 fWAR is significantly higher than the one-dimensional sluggers (and others) he is being labeled alongside. Another is that he was stuck in the outfield by Baltimore in 2016 despite having no business being there. In fact, in his career, Trumbo grades out as an above-average first baseman. On the basepaths, Trumbo’s value is 105/146 of all qualified players, which isn’t as much of a tanker as one would think. As for his fluctuating halves, there is a tale behind that, too.

Mark Trumbo, Above Average First Baseman

Player BABIP wRC+ UZR/150
Mark Trumbo (1st Half) .327 143
Mark Trumbo (2nd Half) .216 98
Mark Trumbo (Career) .288 111 6.3 (1B)
2016 1B AVG .307 120 .3


Batting Average on Balls in Play (BABIP)
assesses whether a player is going through a lucky (or unlucky) streak based on deviation from their normalized rate. The average BABIP is .290, and Trumbo is no different, checking in at .288 for his career. His first half was above the average rate, while his second half was at an extreme (and unsustainable) low. As you can see in the chart, his wRC+ is in line with the offensive-minded first basemen of the league, and there is room for some uptick. His defense at first base, even if 6.3 is too optimistic, can make him a $75M man. A lot of Trumbo’s depressed value comes from spending too much time in right field; this chart will break down the calculation behind Trumbo’s 2016 fWAR and estimate what he can provide if played at his true position (and some time at DH).

Mark Trumbo as Full Time 1B (2016, 2017 Projection)

Player Mark Trumbo
Batting Runs 18.7
Baserunning Runs -2
Fielding Runs* 5.7
Positional Adjustment* -12
League Adjustment 2.6
Replacement Runs 20.1
fWAR* 3.4

fWAR calculation: (BR+BsR+FR+Positional Adjustment+League Adjustment+Replacement Runs)/(R/W)

*Assumes a 6.3 UZR/150, 135 games played as 1B, 15 games played as DH

This is an aggressive projection, but Trumbo proves that he is not a one-dimensional player. A 3.4-win player is extremely valuable, and if he produces to that level over the next three years, he will provide a significant amount of surplus value.

Mark Trumbo Projected Surplus Value, 2017-2019

Year fWAR $/WAR Value Produced Salary Surplus/Deficit
2017 3.4 8M 27.2M 11M +16.2M
2018 2.9 8.4M 24.4M 11M +13.4M
2019 2.4 8.8M 21.1M 11M +10.1M
Totals 8.7 72.7M 37.5M* +35.2M*

*Assumed aging curve via FanGraphs: +0.25 WAR/yr (18-27), 0 WAR/yr (28-30),-0.5 WAR/yr (31-37),-0.75 WAR/yr (> 37, assumes a 5% inflation/year in $/WAR

*$4.5M of Mark Trumbo’s contract is deferred and to be paid in $1.5M increments from 2020-2022; that amount was subtracted from the overall surplus.

This chart shows the full potential of Mark Trumbo, quality first baseman. As calculated in the “Value Produced” column, he is rather close to the $75M man he marketed himself as. Because of the stigma surrounding his 2016 season, his market did not develop, and clearly overcorrected. Contending teams with needs at first base went elsewhere – the Red Sox signed Mitch Moreland, the Indians signed Edwin Encarnacion, and the Blue Jays signed Kendrys Morales. Even the Colorado Rockies signed SS/CF Ian Desmond for $70M (plus the 11th overall pick in the draft) to learn yet another new position. Unfortunately for Mark Trumbo, the team he signed with, the Baltimore Orioles, already employs a first baseman in Chris Davis. This redundancy will force Trumbo to again be a square peg in a round hole; part-time DH, part-time right fielder. This has been an unfortunate circumstance for him throughout his career, playing for teams that already had Albert Pujols and Paul Goldschmidt. What might have been to see Trumbo realize his full value, on a contract he deserves, and hitting moonshots out of Coors Field or Fenway Park.


Zack Greinke and the Future of Pitching Contracts

Spending money is an interesting avenue to build a pitching staff. Many of the deals are conventional; a superstar pitcher around 30 years old gets a contract in the neighborhood of at least 7/$175M. But something unconventional is the nature of the contract that Zack Greinke signed with Arizona; 6/$206M. We have seen pitching contracts at or exceeding $175M several times in recent years; they have all been at least seven years in length. Never before has a contract in Major League Baseball history paid so much money in so little time. In fact, Greinke’s $34.5M take-home in 2016 was the highest single-season pay in Major League Baseball history. Now, with stricter luxury taxes in place, the higher average annual value (AAV) is certainly a unique burden on Arizona, but what about the burden of the seventh, eighth, or even ninth year of a deal for every other team? Arizona’s braintrust decided that, rather than having Greinke hamstring their payroll for seven or eight years, he will only do so for six, albeit at a slightly higher rate. I think they are onto something.

Here’s a look at every major pitching contract signed from the 2000-2011 seasons worth at least five years. Compare the values produced in the first four years of those deals to the value of the whole contract, and look at the following years as well.

Pitching Contracts and Subsequent Performance in $, 2000-2011 Seasons

Player Contract Value in Yrs 1-4 Value in Yr 5 Value in Yr 6 Value in Yr 7 Value in Yr 8 Value in Yr 9
Mike Hampton 8/121M 28M 4.6M 2.3M 5.3M .7M
Mike Mussina 6/87M 84M 12.2M 24.9M
Roy Oswalt 5/73M 99.5M 20.5M
Daisuke Matsuzaka 6/52M 46.2M .6M -2.2M
Chris Carpenter 5/63.5M 58M 36.5M
Barry Zito 7/126M 41.1M -4.1M 5.8M -3.4M
Carlos Zambrano 5/91.5M 57.6M 3.1M
Johan Santana 6/137.5M 74.4M 10.7M INJ
A.J. Burnett 5/82.5M 54.4M 31M
C.C. Sabathia 9/211M 147.4M 18.9M .9M 9.5M 21.2M N/A**
John Lackey 5/82.5M 44.7M 17.9M
Cliff Lee 5/120M 138.8M INJ
Jered Weaver 5/85M 53.1M -1.2M
C.J. Wilson 5/77.5M 54.4M INJ
John Danks 5/65M 20M -.8M
Gio Gonzalez 5/42M 109.8M 22.9M
Yu Darvish 6/60M 91.1M 21.6M N/A**

*all contract data via Baseball Reference, all valuations via FanGraphs by conversion of (fWar)($/fWAR)

** these seasons will be played out in 2017

Of course, there are some contracts in here that went south from the start. Mike Hampton, Barry Zito, and John Danks are the culprits here. You probably notice that in most cases, years one through four go completely according to plan! Some of the exceptions are due to injury, and those are Johan Santana and John Lackey. But even other injury victims, such as Yu Darvish and Chris Carpenter, were so valuable in two or three years that they held up their end of the bargain.

However, the second thing you’ll notice is how quickly values go down on this list after year four. Of the 17 samples we have here, there are only seven success stories in year five (Oswalt, Carpenter, Burnett, Sabathia, Lackey, Gonzalez, and Darvish). Two of those cases are unique, as A.J. Burnett experienced a career revitalization in Pittsburgh under Ray Searage, and Darvish was a young international free agent. Overall, the success rate isn’t encouraging. The real black marks are the years following that. We have 11 samples on hand, and aside from modest renaissances from Mike Mussina and C.C. Sabathia, you get some really ugly numbers.

With this chart now in context, it brings us to wonder why any pitcher is even offered a deal in excess of four years. It is just not worth having so much dead payroll for one to five years. In fact, looking at how successful the first four years are, the values already come pretty close to the original contract anyways. Did the Phillies or Cliff Lee ever consider a four-year contract in that same $120M range? Probably not, but Lee would have taken it, and the Phillies would have been better off. I’m sure C.C. Sabathia never received a 4/$120M offer from the Yankees, but it would have let him hit the market again to potentially cash in one more time, and New York would have still recouped 75% of the value they ultimately got from him in nine years.

Thinking in present times, here’s a chart in a similar vein, but examining pitching contracts in the length of at least more than four years signed from just the 2012 season alone. Remember, these players have pitched the first four years of these contracts…

Pitching Contracts and Subsequent Performance in $, 2012-Present Seasons

Player Contract Value in Yrs 1-4 Value in Yr 5 Value in Yr 6 Value in Yr 7 Value in Yr 8
Matt Cain 5/112.5M 7M N/A N/A
Cole Hamels 6/144M 122.7M N/A
Hyun-Jin Ryu 6/36M 55.5M N/A N/A
Anibal Sanchez 5/80M 82.7M N/A
Matt Harrison 5/55M -1.1M INJ
Felix Hernandez 7/175M 120M N/A N/A N/A
Adam Wainwright 5/97.5M 116.7M N/A
Justin Verlander 5/140M 122.5M N/A N/A N/A N/A

*all contract data via Baseball Reference, all valuations via FanGraphs by conversion of (fWar)($/fWAR)

…and we see more of the same. Year five for these eight pitchers is 2017, and how many are a good bet to produce? Verlander, Hamels, most likely Hernandez, and…possibly Wainwright? Matt Harrison’s career is already over due to injury. Lengthy DL stints have ruined Ryu and Cain. Wainwright and Hernandez have also dealt with injury woes. Anibal Sanchez hasn’t been an effective pitcher since 2014. And yet, years one through four look beautiful for everybody but our two outliers.  

The same unorthodox contracts could apply to these guys. Anibal Sanchez is on the 2017 payroll for $16.8M, but what if Detroit had signed him for 4/$80M? Equal value would have been produced, and he wouldn’t be an albatross in 2017. 4/$100M for Adam Wainwright? That is similar to our previous Cliff Lee scenario. If Seattle had offered King Felix 4/$120M, he would have taken it in the hopes of cashing in one more time, and the Mariners would have received good value, similar to the Yankees and Sabathia.

Let’s condense all of the data from both charts and see what averages we get.

Sample Size Average Length Average Value Average Value (Yrs 1-4) Average Annual Value (AAV) Average Annual Value (AAV) – 4/73.14M
25 5.68 Yrs 96.68M 73.14M 17.02M 18.29M


Examining the averages, what if the average pitching contract shifted from nearly 6/$96.68M to 4/$73.14? The players would lose $23.54M on average over the length of the contract, but gain close to two free-agency years. Presumably, two free-agent years would be worth more than that, making for a worthy trade-off. As for the teams, they would pay $1.27M more per year in AAV, but eliminate two years of dead payroll (for those of you calculating that at home, that’s [17.02×1.68] – [1.27×4] for an average gain of $23.51M). That is a worthy trade-off for them as well. In other words, teams save millions, and players make more millions.

These condensed contracts have virtually no true precedent, but the 6/$206M deal that Greinke signed is closer to them than the current industry standard. Of course, pitching deals signed around the same time as Greinke are completely in tradition with this century (Max Scherzer, Jordan Zimmermann, David Price, Jeff Samardzija, Johnny Cueto, Mike Leake, Wei-Yin Chen, Ian Kennedy, and Stephen Strasburg), but that makes this one contract so potentially revolutionary among its contemporaries.

If you are thinking of the player and team who may follow these footsteps, I would imagine the perfect test case to be Matt Harvey. The Mets pitcher proved that he is an All-Star-level hurler in his comeback 2015 season from Tommy John surgery, but was hampered again in 2016 and diagnosed with thoracic outlet syndrome. All of this speculation is for naught if Harvey’s career is going to fizzle out or if he will need to be relegated to the bullpen, but let’s say the next two years are a comeback for him in the mold of 2015. After 2018, he would hit free agency going into his age-29 season. He would theoretically be in line for a five- to seven-year deal, but I don’t think someone with “Tommy John surgery” and “thoracic outlet syndrome” on his resume is a wise investment for that long. What if instead of something in the 6/$150M range, it’s a deal for 3/$100M? 4/$130M? If his production is equal to that type of contract, he would still hit free agency at age 33 or 34 and be in demand; it’s quid pro quo.             

Only time will tell if front offices of the future will adopt this strategy, and the harsher luxury-tax penalties surely dampen the idea. However, a team with cash to spend is always a team in need of pitching; perhaps we will see their contracts truly begin to condense.


Sigh of Relief Aside, Expect a Big Year From David Price

No matter what team you root for, we are all baseball fans, and as baseball fans, the game is better when David Price comes out of a visit with Dr. James Andrews in one piece. Red Sox fans held their collective breath after the (since-updated) report was released that Price was being sent to Dr. Andrews following a troubling MRI scan. Even Boston’s brass was expecting to lose Price for the year to Tommy John surgery. Of course, it is not known exactly what Price was diagnosed with, and being shut down for seven to ten days is still troubling, but while the spirits are up, let’s consider something else: David Price will be back in serious Cy Young contention this season.

To be clear, David Price was an excellent pitcher in 2016. Any team would sign up for a 4.5 fWAR pitcher, and that production alone is All-Star worthy. However, in the context of David Price’s career, 2016 qualified as an “off year.” His previous two seasons saw him post totals of 6 fWAR and 6.4 fWAR, respectively. Looking at traditional stats, his 3.99 ERA was his highest since his 128-inning rookie season. So while Price was worth every penny in 2016, it wasn’t the rosiest year of his career.

If we want to find out what was different for David Price in 2016, we won’t have to look very far.

What Went Wrong For David Price in 2016

Year HR/9 FB% HR/FB% Pull% Hard Hit%
2010 0.65 39.6% 6.5% 30.1% 25.5%
2011 0.88 36.9% 9.7% 34.4% 24.7%
2012 0.68 27.0% 10.5% 35.3% 25.6%
2013 0.77 33.4% 8.6% 34.7% 28.6%
2014 0.91 38.1% 9.7% 36.4% 28.3%
2015 0.69 36.4% 7.8% 33.3% 28.2%
2016 1.17 33.9% 13.5% 44.1% 34.8%

*all stats via FanGraphs

Starting in column two, we can see a clear-cut spike in the number of home runs he allowed. Your first thought may be that this can be explained by his having to pitch in the notoriously hitter-friendly Fenway Park, but Price has pitched nearly his entire career in the confines of the American League East and hasn’t had a homer problem until this point. So we move to column two, with the hopes that an increased fly-ball percentage would be the answer to our question. However, his fly-ball percentage was actually his third-lowest recorded since 2010, which makes his spiked home-run-per-fly-ball percentage in column four even more puzzling. With the mystery unsolved, we move to the next column, which measures the percentage of balls in play that were pulled by opposing batters. This rate increased dramatically in 2016, and it coincides with the escalated hard-hit rate in column six.

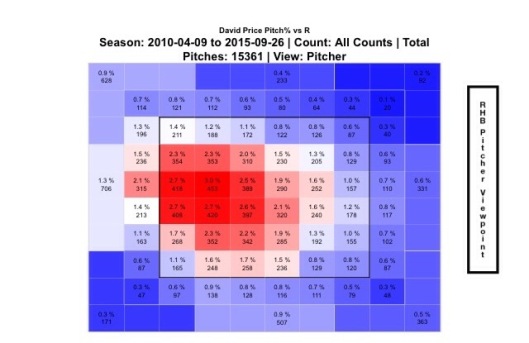
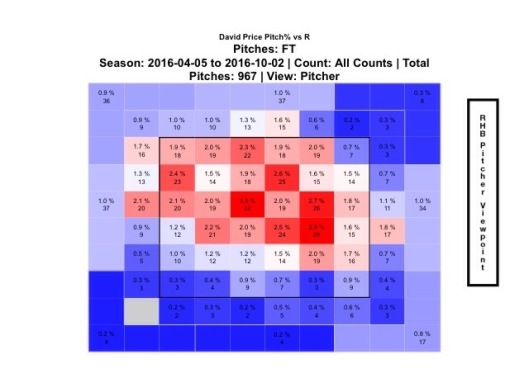
If opposing batters (generally righties) are squaring up on the ball and pulling it more than ever (generally to the Green Monster) on Price, it stands to reason that he is giving them pitches to pull hard. Let’s first examine a heatmap from Price’s pitch locations to right-handed batters over the same six-year sample size we have been using.

fullsizerender-7

*via FanGraphs

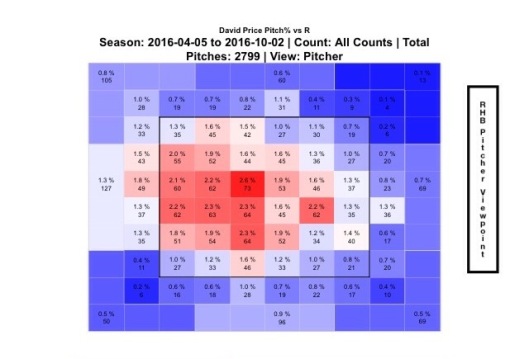
This looks pretty good! It’s no wonder why Price has been so adept at avoiding the longball; he really pounds the outside corner on those right-handed batters. So let’s look at 2016 and see if anything has changed.

fullsizerender-9

*via FanGraphs

Yeah, that will change your fortunes. Much less of that outside corner action, much more of that “meatball right down the middle” action. I decided to dig a little deeper and look at which of his four pitches (fastball, cutter, changeup, and curve) was most responsible, or if multiple pitches were culprits. I’ll save you the trouble and get to the one culprit.

fullsizerender-8

*via FanGraphs

We’ve got a match, and you probably guessed it – it’s the fastball. I can’t explain to you why Price was missing his spots, but you and I know that this is a game of inches, and his fastball was responsible for 16 of the 30 homers he gave up. While this is purely speculation, it’s possible that Price was getting acclimated to his new environment and $217M contract. Whatever the case may be, this is the only adjustment that he really has to make in 2017 to return to his previous levels of Cy Young stardom.

Pitching is an unforgiving occupation, and pitchers often spend years refining their craft, but I am willing to go out on a limb and bet that someone of David Price’s caliber can make this one readjustment. He is no longer the new big-ticket addition in Boston (that would be Chris Sale), nor is he the defending Cy Young (that would be another teammate, Rick Porcello), which should lessen the pressure somewhat. With the hopes that Price is in good health, you can expect a huge bounce-back year from him in 2017.


Kiermaier Takes Guaranteed Cash, Rays Upgrade Asset

Center fielder/sabermetric superstar Kevin Kiermaier signed an extension with the Tampa Bay Rays for 6/$53.5M this week. Dave Cameron of FanGraphs notes that he will receive roughly $30M for three arbitration seasons and $12M per year for three free-agency seasons. There will also likely be a $12M team option. Cameron’s article, while rightfully criticizing Major League Baseball’s flawed arbitration system, will run counter to my argument. Kiermaier is an excellent player, no doubt – a defensive whiz, a great base runner, and a league-average bat to boot. One thing that is not on his side is age. Kiermaier will be 27 this season, would have been 30 in free agency, and will be 33 or 34 when his contract is over. Much of Kiermaier’s value is derived from his defensive prowess; he has recorded a 44 UZR for his work in center field in his career. While this is impressive, the precedent for Kiermaier to continue this excellence through his free-agent years is unlikely. Let’s consider the center fielders of the UZR era who have signed significant free-agent contracts.

Major Free Agent Center Fielders’ UZR

Player FA Age Contract CF UZR (Pre-Contract) CF UZR (Post-Contract)
Carlos Beltran 28 7/119M 16.1 15.1
Juan Pierre 29 5/44M 32.6 -0.8
Gary Matthews Jr. 32 5/50M 12.4 -24.4
Torii Hunter 32 5/90M 11.9 -17.7
Aaron Rowand 30 5/60M 46.2 7
Melvin Upton Jr. 28 5/75.25M 18.6 1.6
Angel Pagan 31 4/40M -1.5 -25.6
Michael Bourn 30 4/48M 51.6 -14.2
Jacoby Ellsbury 30 7/153M 28.9 -2

*data via FanGraphs

Here we see a list of center fielders with (mostly) fantastic defensive records before signing a free-agent contract around the age of 30. With the exception of Carlos Beltran, the youngest player on this list, every single one of these players’ defensive values in center cratered. All of them were or will be rendered unplayable in center before the expiration of their contracts. Kevin Kiermaier is a fantastic center fielder, but even he is no immortal among these men. With the stench of the Jacoby Ellsbury deal still fresh in the air, it is likely that most executives around the game will prefer developing defense rather than buying it.

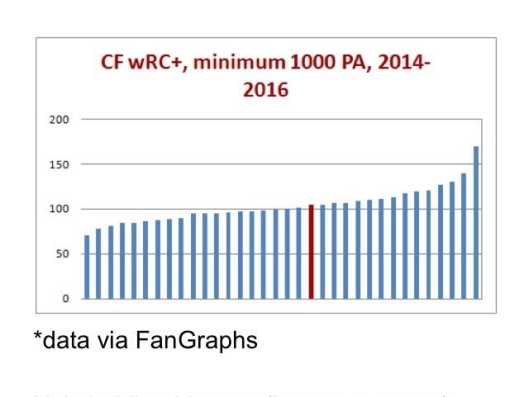
The Rays get to pay Kiermaier $24-36M for 3-4 free-agent seasons in exchange for the guaranteed money during his arbitration years, but if Kiermaier the hypothetical free agent isn’t going to be paid for his defense, is his bat really going to be worth 3/$24M or 4/$36M? Looking at Kiermaier’s place among center fielders with at least 1000 plate appearances in the previous three seasons, his wRC+ made him this red mark on the graph.

wRC+ chart

He’s holding his own (league average), and this is around where he has been for his whole career, but this is also supposed to be his prime. If this is the offensive peak (plateau?) of Kevin Kiermaier, it’s hard to imagine him creating $24-36M worth of value if the plateau crumbles around the age-30 mark.

While Kevin Kiermaier is a bona fide stud, it’s likely he will only be one until he reaches what would have been his free-agent years. By signing this extension, I believe Kiermaier increased his career earnings, while taking that money guaranteed. However, don’t presume that Tampa was reckless about the $24-36M they will allocate to Kiermaier over those last three or four years; precedents can be broken, and he is an awesome player. It’s also important to consider the new asset that Tampa upgraded to, a nice Adam Eaton-esque carrot to dangle in front of interested teams – seven years of control of Kevin Kiermaier.