Author Archive

An Alternate Look at Ground Ball “Luckiness”

Earlier this season, Baseball Savant unveiled expected wOBA, which, around these parts of the Internet, has made some real waves. For those unfamiliar, expected wOBA, or xwOBA, predicts a batter’s wOBA from the launch angles and exit velocities of his in-play contact. Because certain speeds and angles are more conducive to hits — for instance, most consider an launch angle to be around 25 degrees — xwOBA is often interpreted as a rough measure of luck. In particular, the difference between a player’s expected and actual wOBA (referred to as xwOBA-wOBA) is often cited in discussions of just how “lucky” that player has been. If a hitter’s xwOBA is significantly higher than his actual wOBA, for example, one can deduce that he’s hit the ball far better than his actual results imply.

A few months ago, Craig Edwards wrote an excellent piece on the new statistic, and discussed the interaction between xwOBA-wOBA and player speed. He noted that most of the “luckiest” batters — those with negative xwOBA-wOBA figures — were generally some of the faster players in the league, and the least lucky batters were among the slowest. Intuitively, this makes sense, as faster players are more likely to beat out infield hits and take extra bases when given the opportunity.

Edwards also charted players’ xwOBA-wOBA against their BsR scores, producing a linear-looking graph (with an R-squared of 0.27) which confirmed at least a moderate link between the two statistics. He noted that because there was no “perfect metric” for player speed at the time, he chose to use BsR as a proxy. While BsR serves this purpose well enough, I do find it problematic that the statistic, by definition, includes runners “taking the extra base,” as this information is also reflected in the wOBA element of xwOBA-wOBA (i.e. when a batter stretches a would-be single into a double, his wOBA is that of a double, while his xwOBA remains at a single). I’d be more comfortable, therefore, comparing xwOBA-wOBA against a more “pure” form of player speed.

It’s fortunate, then, that in the time since Edwards’ piece, Baseball Savant has also released sprint speed, which captures a player’s feet traveled per second on a “maximum effort” play. Using a list of batters with at least 200 at-bats on the season, I’ve re-created the scatterplot used in Edwards’s article, replacing BsR with sprint speed:

all_chart

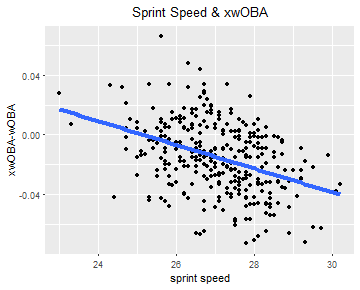
As it turns out, the results are fairly similar — there is a link, albeit not an incredibly strong one, between a hitter’s speed and his xwOBA-wOBA. The trend is downward-sloping, meaning that faster batters are luckier, but there’s still a lot of scatter around the line of best fit. The highest point on the graph, belonging to Tigers slugger Miguel Cabrera, is particularly far from the trend line, as his 66-point xwOBA-wOBA is far above the expected difference of around zero.

I should also note that the above scatterplot, with an R-squared of 0.16, has a notably weaker correlation coefficient than did Edwards’s chart. The plot did get me wondering, however, how much stronger or weaker the correlation would be for different hit types. Common sense suggests that batter speed, as it relates to xwOBA-wOBA, plays a much more significant role on ground balls than on balls hit in the air. After all, a lazy fly ball to left field will be caught whether hit by Byron Buxton (tied for the fastest batter in the league) or Albert Pujols (the slowest), but Buxton will reach far more on a weak ground ball to the pitcher:

buxton_gif

Again using the all-powerful Baseball Savant search tool, I gathered separate xwOBA-wOBA figures for fly balls, line drives, and grounders. Now, let’s see how the interaction between player speed and xwOBA-wOBA changes based on hit category:

hit_type_chart

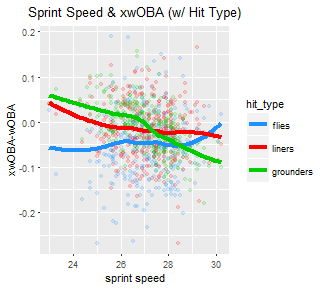
There’s virtually no relationship at all for either fly balls or line drives — indeed, neither’s simple linear regression R-squared is significantly above zero — but ground balls are a different story. Not only is the smoothed line for grounders much steeper than for either of the other two hit types, but the R-squared was nearly 0.31. While this is by no means a high correlation coefficient, it does confirm a link between ground ball “luckiness” and player speed.

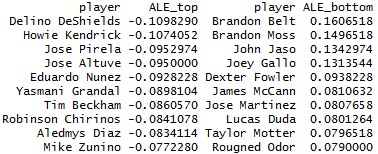
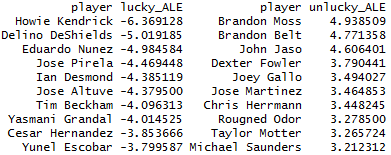
Because we now know that we should expect faster players to outperform their respective xwOBAs on ground balls (and vice versa), it may also be appropriate to adjust batters’ xwOBA-wOBA figures accordingly. Using the results of the simple linear regression for ground balls, I’ve calculated the difference between each major-league batter’s actual xwOBA-wOBA and his expected xwOBA-wOBA as per the regression. I’ve called the stat “Actual Less Expected xwOBA-wOBA” (It’s a mouthful, I know; let’s just agree to call it ALE xwOBA-wOBA), and while it’s a pretty rough measure, it provides us with a speed-neutral valuation of batters’ ground-ball “luckiness.” A high ALE xwOBA-wOBA indicates misfortune; Brandon Belt, for instance, has an actual xwOBA-wOBA 161 points higher than his sprint speed would suggest. Full lists of batters with the highest and lowest ALE xwOBA-wOBAs are as follows:

ALE_luck2

Finally, I multiplied each batter’s ALE xwOBA-wOBA figure by his ground-ball rate, as per FanGraphs (multiplied by 100 for aesthetic purposes). This should show us which batters have been the most and least lucky in the context of their own respective batted-ball profiles. As shown below, there are a lot of familiar names in these weighted ALE xwOBA-wOBA lists, but there are also a few differences:

ALE_weighted

As mentioned above, an R-squared of 0.31 isn’t big enough to draw any major conclusions. Even so, there’s value in controlling for player speed in any discussion of players outperforming or underperforming their expected wOBAs. By accounting for batters’ sprint speeds, we can get a purer look at which players have actually been the beneficiaries of good luck, and which batters’ negative xwOBA-wOBA on ground balls have resulted from their foot speed. Further, it helps to highlight players who actually have been unlucky; if a player has a ground-ball ALE xwOBA-wOBA close to zero, but a high overall xwOBA-wOBA, they’ve been hitting much higher-quality fly balls and line drives — neither of which are significantly impacted by player speed — than their results indicate. Miguel Cabrera, for instance, falls into that category; while his ground-ball ALE xwOBA-wOBA is relatively close to zero (indicating that he hasn’t benefited from any speed-neutral luck or unluck on grounders) his fly-ball xwOBA-wOBA is a whopping 0.166. So, even though Miggy isn’t one of the faster baserunners in the league, he’s still got a legitimate gripe against Lady Luck — and now, we can see which other batters do, too.


Reds Pitchers Are Setting Records in Fastball Futility

Entering the 2017 season, projections were not particularly friendly to the Cincinnati Reds. FiveThirtyEight projected a 70-win season for the team, and FanGraphs was even more pessimistic, predicting just 68 wins and the league’s second-worst run differential. They also projected the Reds to allow 5.02 runs per game — trailing only the Coors Field-dwelling Colorado Rockies — so it’s fair to conclude that expectations for the Reds’ pitching staff were low coming into the season.

And, really, why wouldn’t expectations have been low? Last season, the Reds’ pitching staff really struggled; as Dan Szymborski noted in his pre-season ZiPS preview, Reds starting pitchers produced the lowest WAR among all major-league rotations, and their relief corps owned the second-worst bullpen WAR since 2000. After trading Dan Straily to the Marlins over the offseason, the outlook for this year wasn’t much better — of all Reds starting pitchers, ZiPS expected only Anthony DeSclafani and Brandon Finnegan (both currently on the 60-day disabled list) to accumulate a WAR over 1.0. The remaining three members of their Opening Day rotation – Homer Bailey, Scott Feldman, and Robert Stephenson — were all projected a WAR of somewhere between -0.3 and 0.6.

The winter projections hadn’t set a very high bar for the Reds to clear, but so far, they haven’t been able to do so. As it happens, Cincinnati’s 2017 starting rotation has been even worse than advertised. Consider these facts, all current as of August 12:

  • Reds starting pitchers have a collective ERA of 5.98. If this number was to stand, it’d be the worst since the 2005 Royals.
  • The team’s starters have also combined for a FIP of 5.75, which would be the highest since the 2000 Angels.
  • Cincinnati starters have accumulated a WAR of 0.1. If this number holds steady for the last six weeks of the season, it would be the lowest WAR figure – by far – of any starting rotation ever. The 2007 Nationals’ starters, currently the worst in that field, still managed to put up nearly one win above replacement.

That’s not all, though — on the x-axis of the following chart, we see each team since 2002 ordered by fastball runs per pitch (wFB). The dark blue dots in the back represent each team’s total wFB, and the lighter blue dots show each team’s standardized wFB (known as wFB/C). Note that for the purposes of showing both sets of values on the same scale, I standardized both teams’ wFB and their wFB/C using R’s scale() function. For the purposes of the following chart, then, wFB/C can be interpreted as the standardized standardized runs per pitch.

As illustrated below, the correlation between wFB/C and wFB begins to moderately weaken about halfway through the ranked order, but in general, the relationship between the two is strong:

fastballs_scaled (442x351)

There is, however, a notable outlier. Draw your attention to the lower-right corner of the graph, and you’ll see the 2017 Cincinnati Reds’ wFB/C, highlighted (appropriately enough) in red. The point’s position along the x-axis illustrates just how unsuccessful the Reds’ fastballs have been this year. Out of the 480 individual team seasons since 2002, the Reds’ starters currently rank 470th in wFB. Even worse, there are still six weeks left in the season, so Cincinnati is likely to eventually overtake the 2002 Rangers’ -118.4 wFB for worst in recorded history.

Further, the Reds’ wFB/C, as shown on the y-axis, is historically low; no other team — including the ten teams with lower wFB figures — comes anywhere close to the 2017 Reds’ vertical position in the graph. For additional context, the White Sox currently own the second-lowest wFB/C in the league at -0.80; Reds starters’ wFB/C is -1.72. There’s also an enormous discrepancy between Cincinnati’s 2017 wFB/C (the red point) and wFB (the corresponding dark blue point). As illustrated above, no team’s rotation in the last 15 years has ever had a season with such a large difference. Interestingly, deviations like this are far more present in sliders and slightly more so in changeups, but standardized wFB and wFB/C are generally very close to each other.

For the 2017 Reds, this means that although they’ve thrown far fewer fastballs than teams whose statistics comprise a full 162-game season, their average fastball’s run expectancy has been detrimental enough to already give them the tenth-worst wFB since 2002. I should note that pitches’ linear weights are descriptive rather than predictive, as explained on FanGraphs’ Linear Weights page, An awful pitch value doesn’t necessarily mean that the pitch itself is equally bad, so Cincinnati starters’ historically terrible collective wFB/C isn’t evidence that each of them throws a similarly terrible fastball. And to be fair, the Reds’ rotation hasn’t been helped out much by Tucker Barnhart and Devin Mesoraco’s -2.9 and -3.0 FRAA figures, which are ranked 67th and 68th, respectively, out of 90. But it’d be hard to argue that the Reds rotation’s historically low wFB figure isn’t meaningful.

I didn’t notice anything particularly unusual about the usage, velocities, or movements of the Reds’ fastballs themselves, which fits with the “descriptive, not predictive” note above. The team’s starters have thrown the 20th-highest percentage of fastballs in the league, and their fastballs’ average velocity ranks similarly. Instead, I interpret their horrific wFB/C as more of a general indication of the state of the Reds’ rotation, which (as their ERA and FIP also suggest) leaves much to be desired.


Even Without Brad, the Padres’ Pen Will Be in Good Hands

As with most rebuilding teams, the San Diego Padres aren’t in any particular need of a strong bullpen, and they’ve handled this season’s trade deadline accordingly. As of July 30, they’ve already traded away Ryan Buchter and first-half closer Brandon Maurer, and relief ace Brad Hand is expected to follow this offseason. The rest of San Diego’s bullpen is, for the most part, unexceptional; not including Hand, the most-used relievers still on the team are Craig Stammen and Jose Torres, neither of whom have a positive WAR or a FIP under 4.50.

It’s fortunate for San Diego, then, that Kirby Yates has quickly become their most reliable non-Hand option in relief. The team plucked Yates, a relatively unknown 30-year-old Hawaiian right-hander, from the waiver wire in late April, prior to which he’d spent time as a Ray, a Yankee, and, for one inning in 2017, an Angel. Minus a disastrous 2015 season, due in part to a HR/FB ratio of over 30%, both Yates’s FIP and xFIP have consistently been below 4.00. He’s also demonstrated an impressive strikeout ability over the past few years; his K rates in ’14 and ’16 were both approximately 27%, and in 2015, his worst season, he still managed to strike out nearly 23% of batters faced.

Since his move down the California coast in April, though, Yates has emerged into the Padres reliever perhaps most likely to take over the closer role — assuming Hand is dealt as expected (ed. note: oh well) — and has been one of the more unexpectedly impressive relievers of 2017. In prior years, Yates’s terrific strikeout rate was often coupled with a walk rate that was passable at best (7.6% in 2015) and dreadful at worst (10.3% last season). This season has seen progress in both areas — his BB% is down to 6.3%, and he’s struck out over 38% of the batters he’s faced. Yates’s improvements in strikeout and walk percentage have been sufficient to land him among the league leaders in both K%, where he ranks seventh among qualified relievers, and K-BB%, where he ranks fifth, at 31.9%. For reference, Andrew Miller ranks sixth at 31.0%, and other members of the top five are comprised of arguably the best relievers in the game, including Craig Kimbrel and Kenley Jansen.

Of course, it’s a bit premature to tout Yates as a Kimbrel-quality option out of the Padres’ bullpen. He doesn’t have the same electric stuff, or anything near the track record, of his peers on the league leaderboards, and he’s been the beneficiary of a strand rate of almost 91%. At 3.09 and 3.01, his FIP and xFIP, respectively, are also significantly higher than his 2.23 ERA, so there’s a fair bit of evidence to suggest that Yates isn’t as good as his basic stats indicate. With that being said, though, there’s a lot to like about Yates’s performance this year. There’s nothing fluky about a 38% strikeout rate, and his SIERA score, at 2.24, has been far more bullish on Yates than have his FIP and xFIP. So while Yates isn’t necessarily becoming the next great San Diego closer, his improvements this year are far too drastic to be chalked up entirely to luck.

Instead, I believe there are a couple interrelated reasons for Yates’s recent success. In June, Jeff Sullivan wrote about Brewers starter Chase Anderson’s 2017 breakout, noting that Anderson had started shifting his location on the rubber. Against right-handed hitters, Anderson began his wind-up from the far right side of the rubber; this was, as Sullivan explained, about “playing the angles,” adding that Anderson could get his pitches “sweeping away” from these batters.

Yates, it appears, has followed the same line of thinking. Compare the starting point of Yates’s delivery between the past two seasons:

rubber

We can also see how much his pitches’ respective routes to home, as illustrated by PITCHf/x, have changed since last season:

pitchpaths

Compared with a .283/.372/.457 slash line in 2016,  righties are hitting just .171/.227/.305 against him this year, with a .227 wOBA and .224 xwOBA. With Yates’s new starting point on the rubber, his pitches have been able to more effectively “sweep away” from right-handed batters, since they start significantly farther to the right, and he’s seen excellent results against righties in particular. This effect, I believe, has been a significant contributor to Yates’s success. As the above graph indicates, his fastball and slider travel most toward the outer section of the plate, which may be giving right-handed hitters more difficulty in the batter’s box.

However, that’s not the only interesting development regarding Yates’s slider. According to PITCHf/x, he’s throwing roughly four percent more sliders against right-handers, and his fastball usage has declined by roughly the same amount. His slider hasn’t spun the same this year as it has in the past, either: according to PITCHf/x, the pitch’s spin rate has risen from 594 to 1,962 RPM this season. (I should note that Baseball Savant sees a negligible difference in the average spin rate of Yates’s slider, so there may be an error in the data.) Regardless, it’s hard to deny that the pitch’s movement has changed:

sliders14-17

As evidenced by the wide spread in 2017, Yates’s slider still seems like a work in progress, but it’s clear that the pitch has taken on some new movement. FanGraphs, through PITCHf/x, scores his slider’s xMov as having shifted from 1.4 to -2.2, indicating that the pitch has actually begun moving toward right-handed batters. This doesn’t invalidate the merits of Yates’s shift on the mound, though — the new angle might still be affecting how righties pick up his pitches, and the majority of his sliders do tend toward the outer half of the plate, thus still “sweeping away” from the batters.

Yates briefly spoke on his slider in a May interview with Jeff Sanders of the San Diego Union Tribune, saying the pitch was “getting back to where it used to be.” I found this a curious phrase for Yates to use, seeing as how the pitch has done anything but revert back to its old movement. His next sentence, however, may answer this question. Yates says he’s “incorporated a splitter that [he] feels pretty confident in,” and later mentions that over the offseason, he developed the pitch as a sort of contingency plan against an occasionally less-than-trustworthy slider.

I’m not very familiar with the inner workings of PITCHf/x, but it seems possible that the system could be classifying some of Yates’s new splitters as sliders. Not only would this account for the change in his slider’s horizontal movement, but it’d also explain Yates’s description of the pitch. Overall, though, I believe Yates’s newfound success can largely be attributed to the above adjustments he made over the offseason. He may not become the next Trevor Hoffman, but Yates has shown the Padres more than enough to feel a bit more comfortable with their bullpen, even after Brad Hand is dealt this winter.


Do Sluggers Really Swing More on 3-0?

According to Baseball Prospectus’s set of Run Expectations matrices, when Evan Gattis stepped up to the plate in the fifth inning of Houston’s June 27 game against Oakland, the Astros were expected to score an average of 2.26 runs (taking the three-year mean from 2014-2016). The bases were loaded for Houston, which was down 1-0, and in over four innings of work thus far, opposing pitcher Sean Manaea had already walked a trio of batters, including the previous hitter. Against Gattis, Manaea had gotten himself into even more trouble, with the first three pitches missing outside. On the fourth pitch, the Astros’ mighty slugger, evidently with the green light to swing, did exactly that, with the following result:

gattis_gif

By the time Houston’s next batter, Brian McCann, stepped to the plate with two outs and a runner on third, the Astros were only projected to add an average of 0.352 runs to the one that had already crossed home plate. As it turns out, McCann grounded out to shortstop, and the ‘Stros ended up scoring only one total run from a bases loaded, no-out situation. As calculated by Baseball Reference’s wWPA metric, Gattis’s run-scoring double play actually decreased the team’s chances of winning by ten whole percentage points, and they’d eventually drop the game to Oakland, 6-4.

To an innocent MLB.TV subscriber who happened to see the preceding events play out, it seemed an odd scenario for Gattis to get a 3-0 green light. After all, Manaea had been relatively wild up to that point in the game, and he’d even walked the previous batter, Carlos Correa. It got me thinking about league-wide trends on 3-0 swings, and thanks to Baseball Savant, there’s a wealth of 3-0 count-related data to pore through.

First, there are some interesting trends involving the overall league frequency of 3-0 pitches and swings. Using R’s ggplot data visualization package, I graphed the frequency of pitches in a 3-0 count, relative to pitches in other counts, as well as the swing rates on those pitches:

totalandswingpct

Batters are swinging more and more at 3-0 pitches, even though those pitches are steadily becoming less common. In a league that’s been increasingly prioritizing power, it’s possible that batters are responding accordingly to the fact that they know, with a high degree of accuracy, what pitch they’re about to see. Of the 4,721 3-0 pitches through the 2017 All-Star break, nearly 87% of them were categorized as some type of fastball, as categorized by Baseball Savant.

But which batters are most frequently given the go-ahead to swing away in a 3-0 count? Common perception is that the more powerful the batter, the more likely he is to be given a green light from his manager; this would certainly fit the Gattis anecdote above, and a 2014 Beyond the Box Score article noted that “the guys who swing 3-0 are sluggers,” citing Albert Pujols and Ryan Howard’s high swing numbers as evidence.

I graphed the number of each batter’s 2016 3-0 swings against his 2015 SLG, limiting the data set to batters who saw at least ten 3-0 pitches to avoid outliers (among these outliers: pitchers Jose Fernandez, Jake Arrieta, and Madison Bumgarner, each of whom swung at at least one 3-0 pitch). If powerful hitters really do swing more often on a 3-0 count, we’d expect to see a positive relationship in the data. Of course, this analysis does come with the caveat that batters, once given the freedom to swing, still can choose not to, and pitchers are likely less inclined to groove a 3-0 fastball to hitters they know are more likely to punish them for doing so.

As it turns out, the five batters with the highest number of swings were all notable sluggers — Joey Votto (17), David Ortiz (14), Mike Napoli (14), Giancarlo Stanton (14), and Josh Donaldson (12). Take a look at the below graph:

batter_SLG_2015_swings

Evidently, there is some sort of relationship between the number of 3-0 swings a batter takes, and that batter’s power. It might, however, make more sense to look at the rate of 3-0 pitches a batter swings at, rather than the absolute amount. After all, one might expect a batter with a high slugging percentage to have (a) more at-bats that reach 3-0, as the pitcher would be more likely to pitch around him; and (b) more at-bats total, as his high slugging percentage would warrant more frequent appearances in the starting lineup.

As illustrated below, I charted each batter’s 2016 3-0 swing rate against his 2015 SLG:

batter_SLG_2015

Interestingly, there doesn’t seem to be much of a correlation between a batter’s prior-year slugging percentage and his current-year 3-0 swing rate, although we should acknowledge the small sample sizes of the pitches driving each individual batter’s swing rate. (For what it’s worth, I performed the same analysis using ISO, rather than SLG, and limiting the data to batters who saw at least twenty 3-0 pitches, rather than ten, and got very similar results.) A list of the top batters by swing rate, again including only those batters facing at least ten 3-0 pitches, doesn’t exactly comprise an All-Star team, either — while Stanton and Pujols are numbers four and five, respectively, the swing leaders also include Rickie Weeks Jr. (1), Wilson Ramos (2), and Hernan Perez (7).

There’s also not much reason to believe that the batters who do swing most often at 3-0 pitches tend to make any better contact than those who don’t. The following chart compares batters’ 3-0 swing rates with their 3-0 swings’ expected wOBA, and, as the R^2 indicates, their relationship is nonexistent:

results_swingVSxwOBA

Finally, let’s observe the relationship, if there is one, between 3-0 swing rates and player age. Sam Miller, now an ESPN writer, penned an excellent 2014 article for Baseball Prospectus in which he listed a few managers’ respective 3-0 strategies. Ned Yost, for example, did only grant the green light to the most powerful members of his lineup — but only with one out, and only in certain game situations. On the other hand, Davey Johnson, then in charge of Washington, was far more liberal. My hunch, though, is that managers are generally most inclined to let their veteran players swing away. What follows is a plot of 2016 3-0 swing rates against player age:

swingVSage2

As it turns out, there’s not much of a reason to suspect a relationship here, either. But again, each analysis comes with the caveat that batters don’t have to swing when given a 3-0 green light, and some batters may not even need an explicit green light signal to know that they’re allowed to swing.

Even so, we can conclude the following: although 3-0 counts are occurring less often, relative to other counts, batters are swinging at a steadily increasing rate — perhaps to take advantage of the grooved fastball they’re virtually guaranteed to see. Pitchers, therefore, shouldn’t necessarily take for granted that the hitter won’t swing at their 3-0 pitch, and shouldn’t necessarily expect younger and/or less powerful hitters to refrain from swinging. And while batters’ wOBA on 3-0 is significantly higher than on any other pitch, in a stark contrast to common perception, it surprisingly doesn’t appear that powerful batters make any better contact than weaker hitters. I may eventually replicate this analysis with a focus on different game scenarios — for example, whether sluggers behave differently in blowouts, or in high-leverage situations — but for now, I’ll definitely be paying extra attention next time I see a power hitter or veteran up with a 3-0 count.


LoMo: A Tale of Actualization

On April 17, David Laurila posted the transcript of an excellent Q&A with Tampa Bay Rays first baseman Logan Morrison. At that point, the season was exactly two weeks old, and Morrison, then sporting a 136 wRC+ and .302/.348/.535 slash line, had been a pleasant surprise for the Rays. Prior to 2017, most thought of Morrison as a talented but inconsistent hitter; strong 2010 and 2011 campaigns were followed up by a number of uninspiring and injury-plagued seasons, and while Morrison was bound for an occasional hot streak (May 2016 jumps to mind most quickly), he’d been unable to establish himself as much more than a replacement-level first baseman. His rolling wOBA reflects this inconsistency, as the following chart demonstrates some significant oscillation over the last few years:

rolling_wOBA

For that reason, it’s been an even more pleasant surprise for the Rays that their first baseman has been able to sustain his success so thoroughly over the first three months of 2017. In fact, he’s been one of the best power hitters in the league, and unexpectedly so; The Ringer’s Michael Baumann recently ranked him as the third-most shocking name on the home run leaderboards, trailing only Yonder Alonso and Justin Smoak. Through June 24, Morrison’s 22 home runs and .332 ISO are bested only by MVP frontrunner Aaron Judge, and he currently sports the third-highest WAR among all first basemen in the majors. Morrison’s also been barreling up the ball at a far higher rate in 2017; even with over a hundred fewer plate appearances this year than in 2016, LoMo’s already had seven more barrels than last year, and his barrel percentage per batted-ball event has more than doubled, from 7.5% to 15.1%.

Interestingly, Morrison’s average exit velocity has actually seen a moderate decline, from 90.3 to 89.2 miles per hour, but his raised launch angle is enough to warrant a significant increase in expected wOBA, which has risen to .382 from .340. Morrison discussed this aspect of his game with Laurila, saying that he’s benefited from valuing “launch angle and all that stuff,” and that his new approach, at its core, consists of trying to hit fly balls “up the middle.”

He’s stuck to that approach pretty rigidly during the first few months of 2017; as shown below, he’s been able to eliminate almost all of his batted balls with launch angles of below 10°, instead shifting the majority of his contact to somewhere between 15° and 40°:LA_16 and 17.png
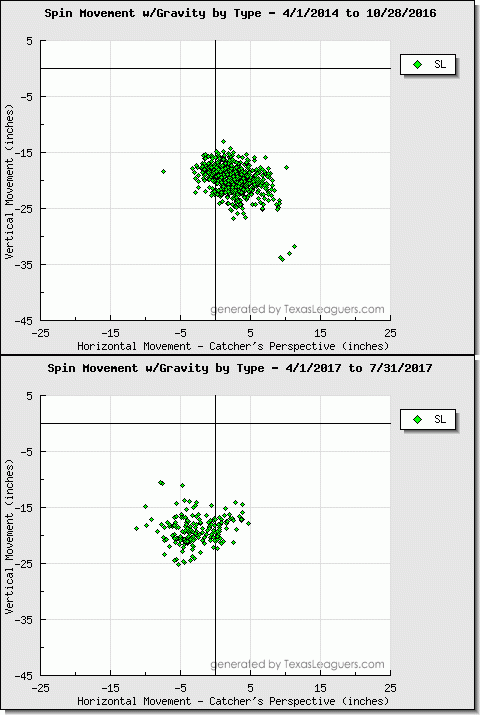
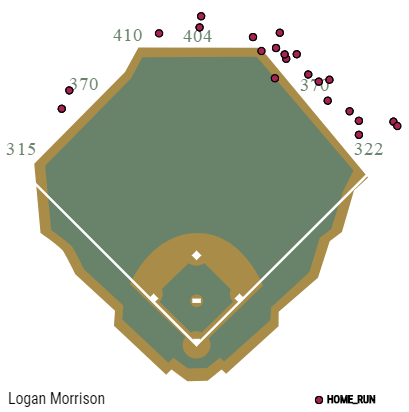
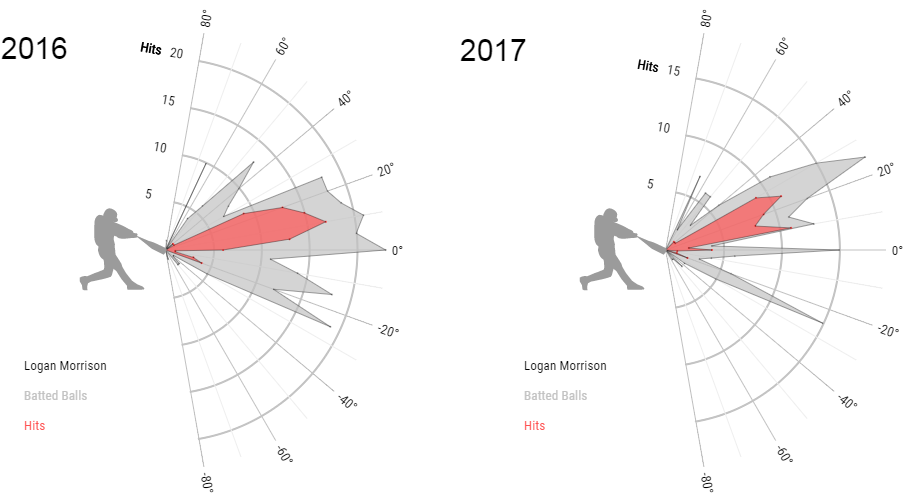
Further, look at how much his spray chart has shifted towards the middle of the field:

spray_16 and 17

Overall, Morrison’s average launch angle has increased from 12° to nearly 17° — placing him in the same neighborhood as Miguel Sano and Justin Upton — and his fly-ball rate has skyrocketed. Morrison’s fly-ball rate of 48.1% is miles above last year’s 34.7%, and is just two percent behind that of fellow fly-ball devotee (and reigning Most Shocking Home Run Leader) Yonder Alonso.

So, we know that Morrison’s been living by at least one of the concepts he discussed with Laurila, but I believe we can also attribute LoMo’s 2017 success to another item he mentioned. In Morrison’s words, “A lot of [hitting] is just getting the best pitch you can to hit … If [the pitcher] is a guy who can do everything, I’m just trying to get a fastball middle until two strikes.”

Through June, Morrison’s done an exceptional job of putting these words into action. Compare his swing heat maps over the past two years’:

swings_16 and 17

Last season, Morrison’s swings were concentrated around two zones – one in the middle-in section of the strike zone, and one on the outside corner. This year, though, he’s been splitting the difference, looking instead for pitches almost exactly between his two favorite areas of 2016. We can see that so far, Morrison’s avoided chasing pitches on that outside corner, thus sticking to his philosophy of focusing solely on the best pitches to hit. And when we dilute the sample to swings in non-two strike counts, we can see a similarly stark contrast:

pre-two strike swings_16 and 17

Just as Morrison said back in April, he’s been swinging almost exclusively at pitches in the middle of the zone with less than two strikes. From the above heatmap, it’s pretty evident that this wasn’t the case in 2016, as his swings comprised a far greater area of the strike zone, and even a section outside of it. According to FanGraphs, Morrison’s O-Swing% has fallen 29.3% to 25.9%, reflecting his increased patience. I should note that PitchFX, on the other hand, actually marks his O-Swing% as slightly higher this season. In conjunction, though, I’m interpreting these contradictory statistics as an indicator that Morrison’s laid off of the borderline pitches, presumably on the outside corner, about which the two pitch trackers disagree.

This approach, combined with his increase in launch angle, has notably improved the first baseman’s quality of contact early in the count. In pre-two strike situations, Morrison’s xwOBA has risen from .396 last year to .498 in 2017, which, to provide context, is roughly equal to Alonso (.499), Justin Bour (.498), Edwin Encarnacion (.498), and Carlos Correa (.495).

With such an inconsistent track record, we shouldn’t necessarily expect Morrison to continue hitting at such a high clip. However, while Morrison’s never run a particularly high average on balls in play — his BABIP hasn’t exceeded .290 since 2010 — in this case, it’d be fair to expect some positive regression on his .248 BABIP, especially considering Morrison’s altered batted-ball profile. And true, his 25.3% HR/FB rate is much higher than it’s been for any full season in his career, but it’s not unreasonably high for a top power hitter, especially one with a newly-increased launch angle. It’s not like his 22 home runs have been flukes, either — among all 104 batters with at least ten home runs, the average distance of Morrison’s shots has been an estimated 403 feet, which ranks almost exactly in the middle of the pack. Plotted against a backdrop of Tropicana Field, Morrison’s home park (and whose park factor for left-handed home runs was recently scored as perfectly average), it’s evident that the vast majority of Morrison’s four-baggers have cleared the fence by a comfortable margin.

hr_spray

By actualizing on the topics he discussed with David Laurila, LoMo’s been able to emerge as one of the season’s most unexpected members of the league leaderboards, and has been instrumental in keeping the 40-37 Rays in the AL Wild Card picture. There’s no guarantee that he’ll be able to sustain this performance through 2017 and beyond, but if Morrison can continue with the adjustments that have made the first half of the season such a success, there are genuine reasons to believe that his spot on the leaderboards might last longer than most saw coming. If the second half of Morrison’s 2017 is as productive as the first, he’ll be finding himself much closer to #20 than #1 on next year’s edition of the Most Shocking Home Run Hitters list.


The Julio Teheran Delivery Mystery

It’s hard, sometimes, to believe that Atlanta Braves pitcher Julio Teheran is only 26. After being signed out of Colombia in 2007, Teheran got his first sniff of the majors as a 20(!) year-old four years later, then ranked as the second-best pitching prospect in the league. As a mid-rotation starter in 2013, Teheran more than justified that ranking, putting up a 3.69 FIP, 22 K%, 2.5 WAR season for a 98-win Braves team that would ultimately fall to the Dodgers in the NLDS.

That Braves team was still an exceptional one; the next few Braves teams (winning 79, 67, and 68 games) less so. For that reason, when Teheran has been mentioned recently, it’s often been in reference to his status as a potential trade chip. It’s no secret that the Braves are in full-fledged rebuilding mode, and a good, young pitcher with over three years left of reasonably-priced team control ($6.3M this year, followed by $8M, $11M, and $12M) could fetch an enticing package of prospects to add to their growing collection.

There’s just one problem – Teheran’s currently in the middle of the worst year of his career, and, even worse, he’s the not-so-proud owner of some of the least favorable pitching statistics in the majors. His 5.67 FIP, far higher than his 3.69 figure last season, is seventh-worst among qualified starters, and his -0.3 WAR ranks fifth from the bottom. As you might assume from the preceding figures, Teheran’s rate statistics have been similarly ugly. In fact, as the following chart illustrates, the sum of Teheran’s decline in K% and increase in BB% from 2016 to 2017 (9.5%) is the fourth-highest among all pitchers who qualified in both years.

Pitcher
Dec. in K%
Inc. in BB%
Total
Kevin Gausman 8.8% 4.0% 12.8%
Justin Verlander 7.4% 5.3% 12.7%
Jeremy Hellickson 9.8% 1.1% 10.9%
Julio Teheran 5.7% 3.8% 9.5%
Zach Davies 4.2% 2.4% 6.6%
R.A. Dickey 4.1% 1.1% 5.2%
Wade Miley -0.4% 5.3% 4.9%
Jaime Garcia 2.8% 1.4% 4.2%
Jerad Eickhoff 0.9% 3.2% 4.1%
Ervin Santana 1.5% 2.1% 3.6%
Jason Hammel 3.6% -0.2% 3.4%

Overall, Teheran’s K% has fallen from 22% to 16.3%, his BB% has ballooned from 5.4% to 9.2%, and while his fly-ball rate isn’t significantly higher (although it is the fifteenth-highest in the majors), his HR/FB rate is up nearly five percentage points. In some circumstances, such an increase in HR/FB% might lead one to believe that, to an extent, the pitcher in question has simply been unlucky. But Teheran’s HR/FB rate, at a shade over 15%, isn’t unreasonably high; it’s in approximately the 63rd percentile in the league. And it’d be hard to chalk up such a dramatic shift in both strikeout and walk percentages solely to random misfortune.

There doesn’t appear to be a significant difference in any of Teheran’s pitches this year, either in velocity or movement, that would explain his sudden loss of effectiveness. Additionally, none of his pitches’ spin rates have declined this year (although his slider’s spin rate has actually increased by over 200 RPM). There has, however, been an interesting development this season in regard to Teheran’s mechanics. Look at the dramatic change in his horizontal release point:

h_release

It’s evident that Teheran consciously changed his delivery during the offseason, at least with respect to his horizontal release point (his vertical release point didn’t change nearly as dramatically). And this isn’t the first time he’s switched up his mechanics; when we expand the x-axis even farther, we can see just how much Teheran has tinkered with his horizontal release throughout his career.

h_release_career

We can see that, compared to today, Teheran had a similar horizontal release point between August 2015 and May 2016. His results during that time span were excellent – a 2.86 ERA (although his FIP was a full run higher), a 21.4 K%, and a 7.4 BB%. But Teheran’s abrupt midseason change in horizontal release point last season didn’t seem to negatively impact his performance afterwards. From June to October 2016, his FIP and BB% were both lower, and his K% was slightly higher, than they were before he altered his delivery.

This naturally raises the question: if Teheran was so successful during the second half of 2016, why did he change his delivery so radically over the offseason? It’s probably premature to say that Teheran’s change in delivery is necessarily the cause of his struggles this year, but there could, at least theoretically, be some secondary consequence of his new mechanics that’d explain his lackluster performance. A potential clue might lie in Teheran’s swinging strike rate, which has declined from around 10.5% – where it’s consistently been throughout his career – to 8.4% this season, despite him throwing a similar percentage of his pitches for strikes in 2017 as in years prior. To me, this could suggest that something in Teheran’s delivery is leading batters to more easily pick up on his pitches’ trajectory. It’s also possible that the mechanical change has affected his control. Although Teheran’s thrown about five percent more fastballs this year, these pitches have been far more spread out across the strike zone in 2017, as the following graph illustrates (see here for 2016):

fastball_17_FG

I’m not particularly privy to the Braves’ everyday clubhouse conversations, but it’d be hard to believe that an adjustment this large didn’t come from Atlanta’s coaching staff. I can think of a few possible explanations behind the change: (1) the belief that Teheran’s old delivery would increase injury risk, (2) the belief that Teheran’s velocity, movement, or command would improve with an altered delivery; or (3) a combination of the two. We can’t know for sure – and we can’t definitively confirm a link between Teheran’s new mechanics and his depressed performance – but I’d say this is a situation worth keeping an eye on, especially as the trading deadline approaches. It’ll be interesting to see if Teheran and the Braves coaching staff continue to tinker with the young right-hander’s delivery, especially if he continues to struggle so much over the coming weeks.


Tommy Joseph Learns the Value of Patience

While Phillies first-base prospect Rhys Hoskins spent April on the Triple-A leaderboards, his big-league counterpart, Tommy Joseph, was among the least productive everyday players in the majors. Through the first month of the season, Joseph hit for a dreadful .179/.222/.254 slash line, along with a .211 wOBA and 25 wRC+. While a BABIP of .234 didn’t do him any favors, Joseph’s 27.8 K% and 5.6 BB% suggested that the 26-year old was simply being outmatched at the plate. All in all, despite passable defense at first base, Joseph’s lack of offensive output was enough for him to accumulate -0.7 WAR, tied for the third-lowest in the league.

It didn’t take long for the local media to start calling for Joseph’s spot in the starting lineup. Hoskins, who Eric Longenhagen rated in February as the Phillies’ ninth-best prospect, ended the month with six home runs and a .338 batting average — numbers that look even better when compared to Joseph’s disappointing output. By the last week of April, some Phillies writers were suggesting promoting Hoskins to the big-league starting lineup in favor of Joseph. Even the sports section of the city’s largest newspaper demanded the team make the switch. As longtime Philadelphia Inquirer columnist Bob Brookover wrote in the first week of May, Hoskins “[c]utting into Joseph’s playing time when he’s hitting below the Mendoza Line would not cause nearly as much turmoil as [Joseph cutting into Ryan Howard’s playing time] did a year ago.

Since the beginning of May, though, the cries to replace Joseph in the lineup have, for the most part, been quieting down. This trend can be attributed to the fact that, surprisingly enough, Tommy Joseph has been one of Major League Baseball’s best hitters this month. Since the beginning of May, Joseph’s 185 wRC+, .459 wOBA, and .344 ISO rank eighth, eighth, and twelfth, respectively, among nearly two hundred qualifying batters. Take a look at how drastically his rolling wOBA has shifted throughout the first two months of the season:

rollingwOBA

Among qualifying batters, Joseph’s improvement in wOBA from April to May was the largest such increase in the league. Such a change seems unlikely to organically occur, although luck certainly can play a part (I would be remiss not to mention Joseph’s .390 May BABIP). I expect, however, that there’s a more concrete explanation for Joseph’s recent success. It doesn’t take a very long look at Joseph’s numbers to get an idea of how he altered his approach. Put simply, Joseph stopped swinging at everything in and around the strike zone. Compare the following two heat maps, one from April and one from May:

swing pct - april

swing pct - may

On April 30, Tommy Joseph had an O-Swing%, Z-Swing%, and overall Swing% of 38.8, 78.8, and 56.2, respectively. If those percentages sound high, it’s because they are; they ranked eighth, fifteenth, and eighth highest in the majors. May, on the other hand, has been a different story. While Joseph has still been chasing up-and-away pitches, he’s become far more adept at laying off of pitches on the inner half of the plate (even though he’s seen ten percent fewer fastballs), and has cut down his swinging rate in virtually every other section of the strike zone. With a May O-Swing% of 27.2, Z-Swing% of 63.9, and Swing% of 41.9, one of the majors’ most free-swinging hitters has been playing like one who, while not exactly Joey Votto, is far less extreme, relative to the rest of the league, than he was in April.

Interestingly, Joseph’s contact rates haven’t significantly changed since he started taking a more patient approach at the plate. We would, however, expect an improvement in the quality of his contact. His hard- and soft-hit percentages have trended in opposite directions since the beginning of the month, as have his line drive and ground ball rates:

rolling HardSoft - Copy

rolling GB-LD

While Joseph’s improvements must be encouraging for a Phillies team that has struggled mightily as of late, it’s still hard to imagine Tommy Joseph being a key contributor on the next contending Phillies team. As mentioned earlier, Joseph has had a .390 BABIP this month, and, even with his more refined approach at the dish, his 22.5 K% and 9.9 BB% in May shouldn’t exactly reassure anyone that he’s anything more than a solid placeholder while the team rebuilds. If Joseph can continue exhibiting patience at the plate, though, he might just put up numbers impressive enough to curb the antsiness of the more impatient members of the Philadelphia fandom. Phillies supporters shouldn’t necessarily give up on the idea that Rhys Hoskins, if he keeps mashing in Triple-A, could reach the majors this year — especially if Joseph gets injured — but as a rebuilding team, the Phillies have no need to rush any of their promising young prospects to Philadelphia. And if Joseph’s discipline changes are for real, they might find themselves with a better placeholder at first base than they may have been expecting.


Jason Vargas’ Changeup Has Been the Key to His Resurgence

If you predicted that Chris Sale and Max Scherzer would rank among the top five pitchers in WAR through mid-May, you aren’t likely to receive much more than a perfunctory pat on the back from your peers. If James Paxton was among your predictions to join Sale and Scherzer in that group, you might just be Jeff Sullivan. But if you foretold that 34-year-old Kansas City Royals southpaw Jason Vargas would rank among the league leaders over a month into the season? Well, my friend, come join me in line for Powerball tickets…

Not many pitchers “find themselves” so late into their careers, and, as a pitcher who hadn’t exceeded ten starts in a season since 2014, Vargas wasn’t exactly on the top of anyone’s spring training Comeback Player of the Year Award list. With that being said, Vargas had never been a bad starter as a Mariner, Angel, or pre-2017 Royal. Between 2011 and 2015 (Vargas only made three major-league starts in 2016 due to Tommy John surgery), his FIP fluctuated between 3.84 and 4.30, and although his xFIP indicated a slightly worse underlying performance, Vargas demonstrated value as a solid back-of-the-rotation starter. This year, of course, he has been anything but mediocre; posting a 1.01 ERA and 1.6 WAR through May 16, Vargas has been one of the few bright spots in an otherwise uninspiring start to the Royals’ season.

What’s most interesting to me about Vargas’s recent ascendance onto the league leaderboard is that his pure “stuff” doesn’t appear to have changed much, if at all. Again, pitchers in their mid-thirties rarely “find themselves” — let alone pitchers who recently underwent Tommy John surgery — and with over 1,200 big-league innings on his arm, Vargas isn’t going to find an extra five miles per hour on his fastball anytime soon. None of his pitches’ horizontal or vertical movement has significantly changed this year, nor have their velocities.

velocitymovement_horizontalmovement_vertical

What has been different this year, however, is the effectiveness of his changeup. Throughout his twelve-year career, Vargas’s changeup has consistently been his best pitch, but so far in 2017, the pitch has been far better than at any point prior. Opposing batters have achieved a slash line of just .109/.149/.125 and have struck out at nearly a 33% rate against the pitch. With a standardized linear weight of 4.63, Vargas’s changeup ranks third among all changeups in the majors, and with an unstandardized linear weight of 9.4, Vargas has been the owner of the most valuable changeup in the league.

As noted earlier, none of Vargas’s pitches, including his changeup, significantly differ this season in either movement or velocity. Further, according to PitchFX, the movement on Vargas’s changeup ranks favorably relative to other pitchers’ changeups, but not incredibly so; this season, Vargas’s changeup has the 14th-highest H-movement in the league, and has the 28th-highest V-movement. Therefore, while the pitch’s “stuff” is impressive, it doesn’t quite tell the whole story.

Instead, the secret to Vargas’s changeup transformation appears to be how finely he’s been able to command the pitch this year:

changeup_2017

Compare that to his changeup in 2014, which had a much wider spread around the lower right-hand corner of the strike zone:

changeup_2014

While batters haven’t swung at Vargas’ changeups any more in 2017 than they did in the past, they, put simply, haven’t been able to make consistent contact against it. When the pitch has been in the strike zone, batters have made contact only 55.7% of the time — even lower than their contact rates on Vargas’s out-of-zone changeups (57.5%). Combine this with the fact that Vargas has been throwing a higher percentage of his pitches for strikes (50.5%) than any season since 2007 — also five percentage points higher than the current league average — and perhaps the explanation for his success is simpler than expected. One should also note how Vargas’s delivery has changed within the last few years, which may also be contributing to his newfound success:

release_horizontal

release_vertical

As many readers are already aware, Vargas probably isn’t going to continue pitching at such a high level throughout the season. As a pitcher without an elite strikeout rate, Vargas won’t be able to maintain anything resembling an 88.7 LOB%. Also, even in the vast expanses of Kauffman Stadium (the third-worst stadium for home runs), Vargas’s 2.0 HR/FB% is all but guaranteed to rise, especially considering that his 2017 FB% is actually in the upper third percentile of qualifying pitchers. As a result, xFIP offers a far more modest view of Vargas’s 2017 performance than does FIP (3.72 vs. 2.17).

All things considered, it’s not unreasonable to expect Vargas to keep posting strong numbers this season. While those who expect him to end the year with a sub-1.10 ERA will be disappointed, Vargas hasn’t shown signs of losing any of his command thus far, issuing a total of just six walks in his last three starts. If his changeup continues generating swinging strikes at such high rates, it’s not implausible that the Royals will possess one of the most surprising (and valuable) trade chips come July.


How Aaron Judge Can Turn the Corner

Yankees right fielder Aaron Judge is, to say the least, an imposing figure in the batter’s box. Judge is one of only three position players in baseball history with a height and weight of at least 6’7” and 255 pounds, respectively – the other two, for those curious, being 1960s power hitter Frank Howard and current Tigers minor league Steven Moya – and with his enormous size comes enormous strength. According to Statcast, 59.5% of Judge’s batted balls last season left the bat with an exit velocity of at least 95 miles per hour, a mark that trailed only those of the Brewers’ Domingo Santana and the Mariners’ Nelson Cruz. Further, Judge’s average exit velocity ranked second among the entire league, with only Cruz ahead of him. However, the player comparison that most swiftly comes to mind is the Marlins’ Giancarlo Stanton, who, incidentally, finished third in average exit velocity last season. When Judge truly barrels up the ball, as exemplified here, his raw power tends to elicit the type of awe usually reserved for Stanton.

Unfortunately for the Yankees, Judge was largely unable to capitalize on this strength in 2016. Although he only saw 95 plate appearances, he batted an uninspiring .179 with an astronomical 44.2% strikeout rate. Even his ISO, above average at .167, was still disappointing for a player claiming raw power as his most prominent attribute.

The Yankees, of course, were fully aware that their right fielder’s approach at the plate needed an adjustment. Said Yankees assistant hitting coach Marcus Thames during spring training:

I thought [Judge] started expanding a little too much… At the big-league level, the game’s a little bit more physical, it’s a little bit faster and I thought it sped up on him a little bit and he started expanding.

A cursory look at Judge’s 2016 batting statistics plate surprisingly suggests that plate discipline may not be as big a problem as one would expect based on Thames’ comments. Among 451 position players with at least ninety plate appearances in 2016, Judge’s O-Swing percentage was tied for 119th at 33.6% (27th percentile), and his Z-Swing percentage of 63.5% ranked nearly identically, at 112th (68th percentile).  Judge, surprisingly, rated fairly well in both measures: he chased far fewer balls than the average hitter, and he swung at a healthy percentage of strikes.

His contact rates, on the other hand, did not inspire quite the same sanguinity. Last season, Judge ranked dead last in overall contact percentage, as well as on pitches outside the strike zone. On pitches inside the strike zone, his contact percentage saw a slight improvement relative to his peers, but still ranked 42nd from the bottom. BaseballSavant’s pitch heatmaps suggest that Judge seemed to have the most difficulty with low and away pitches, both in and out of the strike zone. The following graph displays the locations of Judge’s swinging strikes from 2016 (not including foul balls):
2-Judge[A-SwingingStrikes]

As the preceding heatmap illustrates, the crux of Judge’s contact problems occurs in the low-and-away portions in and around the strike zone. However, a heatmap of Judge’s hardest-hit balls (exit velocity >= 100) shows that Judge’s best contact occurs on pitches that aren’t located anywhere near the low and away sections of the zone. In fact, the pitches Judge hits best are on the inside half of the plate:

2-Judge[B-100MPH]

Now, let’s see where Judge’s weaker contact (exit velocity <= 99) falls in the strike zone.

2-Judge[B-99MPH]

So, low and away pitches not only induce a league-leading whiff rate for Judge, but even when he does manage to connect, he connects with his weakest exit velocity. Marcus Thames’ comments, therefore, may require a slight adjustment: Judge didn’t necessarily expand the zone in 2016, but he certainly didn’t make the most efficient use of it. Courtesy of Brooks Baseball, the following graph illustrates Judge’s 2016 whiff rate by zone:

2-Judge[C-WhiffRateX]

From these charts, we can observe Judge’s whiff rate slowly rising from left to right (inside to outside) across the strike zone. To cut down on his high swinging-strike rate, which was the third-highest in the league among those 451 batters, Judge should reduce his swing rate on low and outside pitches – at least, until the count or game situation demands a more aggressive approach. Ahead in the count, however, Judge should look primarily for the middle-in pitches that have produced better and more frequent contact. He shouldn’t even consider swinging at anything on the outer sections of the plate, as he did last season while ahead in the count (heatmap from FanGraphs):

2-Judge[E-AheadInCount]-FanGraphs


As of Tax Day afternoon, the Yankees are only 11 games into the season, so it’s admittedly a bit early to draw any major conclusions. Even so, we should note that Judge has shown signs of legitimate improvement over last year’s campaign. In 33 at-bats, Judge is slashing .276/.364/.621, and although a 175 wRC+, .345 ISO, and 50% HR/FB rate are all but guaranteed to decline, there’s still reason to believe that Judge has made significant strides in his approach at the plate. Last year, Judge saw the 18th lowest percentage of fastballs in the league at 49.8%, a percentage that this season has dipped even further, to 45.5%. Pitchers, expecting Judge to flail as in 2016, have fed him a steady diet of low and away breaking balls. The following chart reflects all off-speed pitches Judge has faced to date in 2017:

2-Judge[D-17Offspeed]

Even with this steady diet of low and away breaking balls, Judge has managed to cut his O-Swing% from 34.9% to 23.9%, and his swinging-strike percentage has fallen from 18.1% to 12.0%. This is especially impressive considering that, like last year, pitchers have thrown him a fairly low percentage of strikes (about 41%).

The Yankees have lots of reason for optimism regarding their young slugger. As the starting right fielder in Yankee Stadium’s less-than-spacious right field, Judge’s value to his team will derive mostly from his batting output. If Judge can consistently lay off of the low and away pitches that gave him problems last year, he’ll have more opportunity to mash the balls that find the inner half of the plate – like this beauty from last Wednesday. If his early 2017 performance is any indication, Judge’s offseason adjustments have the potential to transform him into a Giancarlo Stanton-caliber power hitter.