An Alternate Look at Ground Ball “Luckiness”
Earlier this season, Baseball Savant unveiled expected wOBA, which, around these parts of the Internet, has made some real waves. For those unfamiliar, expected wOBA, or xwOBA, predicts a batter’s wOBA from the launch angles and exit velocities of his in-play contact. Because certain speeds and angles are more conducive to hits — for instance, most consider an launch angle to be around 25 degrees — xwOBA is often interpreted as a rough measure of luck. In particular, the difference between a player’s expected and actual wOBA (referred to as xwOBA-wOBA) is often cited in discussions of just how “lucky” that player has been. If a hitter’s xwOBA is significantly higher than his actual wOBA, for example, one can deduce that he’s hit the ball far better than his actual results imply.
A few months ago, Craig Edwards wrote an excellent piece on the new statistic, and discussed the interaction between xwOBA-wOBA and player speed. He noted that most of the “luckiest” batters — those with negative xwOBA-wOBA figures — were generally some of the faster players in the league, and the least lucky batters were among the slowest. Intuitively, this makes sense, as faster players are more likely to beat out infield hits and take extra bases when given the opportunity.
Edwards also charted players’ xwOBA-wOBA against their BsR scores, producing a linear-looking graph (with an R-squared of 0.27) which confirmed at least a moderate link between the two statistics. He noted that because there was no “perfect metric” for player speed at the time, he chose to use BsR as a proxy. While BsR serves this purpose well enough, I do find it problematic that the statistic, by definition, includes runners “taking the extra base,” as this information is also reflected in the wOBA element of xwOBA-wOBA (i.e. when a batter stretches a would-be single into a double, his wOBA is that of a double, while his xwOBA remains at a single). I’d be more comfortable, therefore, comparing xwOBA-wOBA against a more “pure” form of player speed.
It’s fortunate, then, that in the time since Edwards’ piece, Baseball Savant has also released sprint speed, which captures a player’s feet traveled per second on a “maximum effort” play. Using a list of batters with at least 200 at-bats on the season, I’ve re-created the scatterplot used in Edwards’s article, replacing BsR with sprint speed:
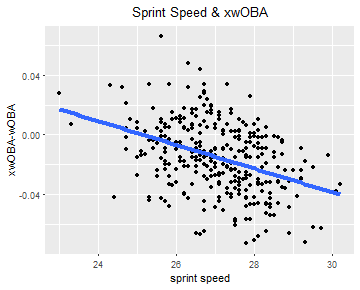
As it turns out, the results are fairly similar — there is a link, albeit not an incredibly strong one, between a hitter’s speed and his xwOBA-wOBA. The trend is downward-sloping, meaning that faster batters are luckier, but there’s still a lot of scatter around the line of best fit. The highest point on the graph, belonging to Tigers slugger Miguel Cabrera, is particularly far from the trend line, as his 66-point xwOBA-wOBA is far above the expected difference of around zero.
I should also note that the above scatterplot, with an R-squared of 0.16, has a notably weaker correlation coefficient than did Edwards’s chart. The plot did get me wondering, however, how much stronger or weaker the correlation would be for different hit types. Common sense suggests that batter speed, as it relates to xwOBA-wOBA, plays a much more significant role on ground balls than on balls hit in the air. After all, a lazy fly ball to left field will be caught whether hit by Byron Buxton (tied for the fastest batter in the league) or Albert Pujols (the slowest), but Buxton will reach far more on a weak ground ball to the pitcher:
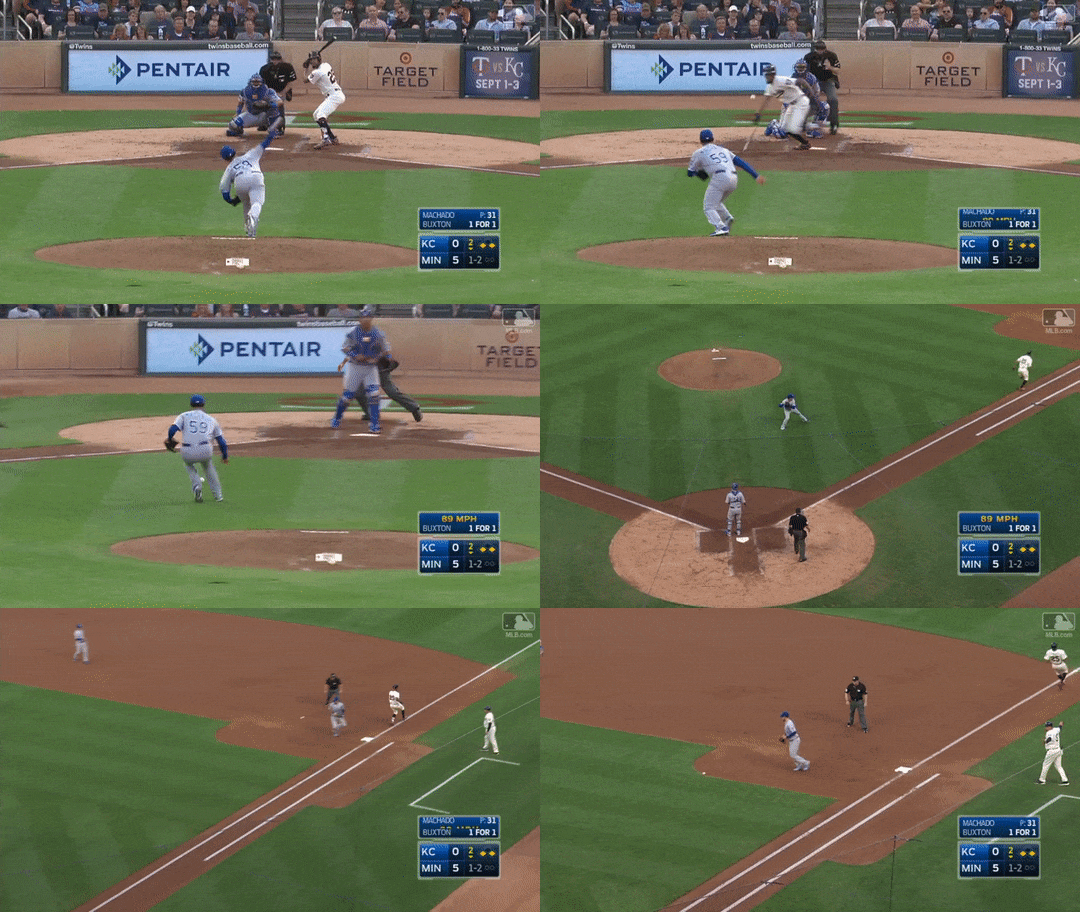
Again using the all-powerful Baseball Savant search tool, I gathered separate xwOBA-wOBA figures for fly balls, line drives, and grounders. Now, let’s see how the interaction between player speed and xwOBA-wOBA changes based on hit category:
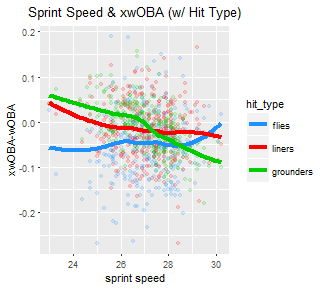
There’s virtually no relationship at all for either fly balls or line drives — indeed, neither’s simple linear regression R-squared is significantly above zero — but ground balls are a different story. Not only is the smoothed line for grounders much steeper than for either of the other two hit types, but the R-squared was nearly 0.31. While this is by no means a high correlation coefficient, it does confirm a link between ground ball “luckiness” and player speed.
Because we now know that we should expect faster players to outperform their respective xwOBAs on ground balls (and vice versa), it may also be appropriate to adjust batters’ xwOBA-wOBA figures accordingly. Using the results of the simple linear regression for ground balls, I’ve calculated the difference between each major-league batter’s actual xwOBA-wOBA and his expected xwOBA-wOBA as per the regression. I’ve called the stat “Actual Less Expected xwOBA-wOBA” (It’s a mouthful, I know; let’s just agree to call it ALE xwOBA-wOBA), and while it’s a pretty rough measure, it provides us with a speed-neutral valuation of batters’ ground-ball “luckiness.” A high ALE xwOBA-wOBA indicates misfortune; Brandon Belt, for instance, has an actual xwOBA-wOBA 161 points higher than his sprint speed would suggest. Full lists of batters with the highest and lowest ALE xwOBA-wOBAs are as follows:
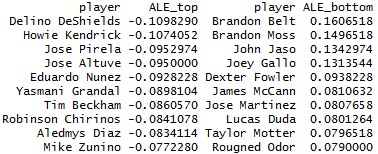
Finally, I multiplied each batter’s ALE xwOBA-wOBA figure by his ground-ball rate, as per FanGraphs (multiplied by 100 for aesthetic purposes). This should show us which batters have been the most and least lucky in the context of their own respective batted-ball profiles. As shown below, there are a lot of familiar names in these weighted ALE xwOBA-wOBA lists, but there are also a few differences:
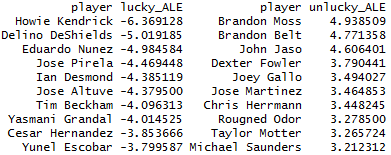
As mentioned above, an R-squared of 0.31 isn’t big enough to draw any major conclusions. Even so, there’s value in controlling for player speed in any discussion of players outperforming or underperforming their expected wOBAs. By accounting for batters’ sprint speeds, we can get a purer look at which players have actually been the beneficiaries of good luck, and which batters’ negative xwOBA-wOBA on ground balls have resulted from their foot speed. Further, it helps to highlight players who actually have been unlucky; if a player has a ground-ball ALE xwOBA-wOBA close to zero, but a high overall xwOBA-wOBA, they’ve been hitting much higher-quality fly balls and line drives — neither of which are significantly impacted by player speed — than their results indicate. Miguel Cabrera, for instance, falls into that category; while his ground-ball ALE xwOBA-wOBA is relatively close to zero (indicating that he hasn’t benefited from any speed-neutral luck or unluck on grounders) his fly-ball xwOBA-wOBA is a whopping 0.166. So, even though Miggy isn’t one of the faster baserunners in the league, he’s still got a legitimate gripe against Lady Luck — and now, we can see which other batters do, too.
good article. shouldn’t horizontal Launch angle also be considered? grounders are always pulled more than fly balls but I would assume a guy with an extremely polarized grounder pull Profile get punished in BABIP even if they hit it rather hard because you get shifted a lot.
the low BABIP grounder guys like Pujols or schwarber are slow but they are also extremely pull heavy on grounders and opponents defense is shifting accordingly.
could you look into grounder pull rate vs BABIP?
I think that is the only downside of the extreme flyball/pull Approach that many of the smaller power hitters use. they won’t hit a lot of grounders but still like 35% are grounders and if you top the ball with the Uppercut swing it is always pulled (rolled over).
the prototype of that is jose bautista. I call that another type of three true outcomes, he didn’t strike out but it was always Homer, flyout/pulled ground out or walk. Brian dozier is also like that, lots of pulling, lots of fly balls but low BABIP.
since more hitters now try to use that Approach to find their power (and the ball rewards that) I think we will see more of those low-ish BABIP type hitters (not judging that – 50 more Points of ISO can be worth losing 25 Points on BABIP and OBP).
I still think trying to elevate and pull the right pitches makes a lot of sense for many hitters but for BABIP it can make sense to have a more conservative LA Profile (say low 40s grounders rather than 35% and more of an all field Approach.
BTW I’m not discounting the Speed compnent, it certainly does Play a role but I think we should also look more into the horizontal LAs (Overall and on the different batted ball types – like grounder pull rate vs FB pull rate as the latter is generally quite good and the former is bad but usually there is a relationship between the two).
Does the R^2 produce any better results when accounting for batter handiness on ground balls?
Good question – adding a dummy variable for batter handedness caused the adjusted R-squared on grounders to rise from 0.31 to 0.34. There weren’t any notable changes for either fly balls or line drives.
As it turns out, being a right-handed batter actually gives you a slight edge when it comes to outperforming your ground ball xwOBA, probably a result of righties pulling the ball farther from first base.
If you’re curious, here’s the scatterplot split by batter handedness and hit type:
Do you have something for BABIP on grounders related to Pull% of grounders? I actually have an article in the Pipeline about pulling and elevating but I couldn’t really find anything on hit type in conjunction with the spray angle/pull rate.
I don’t recall seeing a data set with those explicit factors, but you could do a bit of creative querying with the BaseballSavant search tool to get what you need. Maybe you could filter the data on batted ball type and location, and then sort by BABIP, launch angle, etc.