Author Archive

There Is Hope for Kevin Siegrist

To say that Kevin Siegrist has really struggled in 2017 would be an understatement. After allowing 15 earned runs in 31 appearances through June 22, he was placed on the DL with a cervical spine sprain. With an ERA near 5, Cardinals fans have been left wondering what happened to the player who led the league in appearances (81) and finished third in holds (28) in 2015.

At first glance, Siegrist has an obvious issue — a very clear and very serious velocity problem. Take a look at this graph.

HdTlDcq.0.png

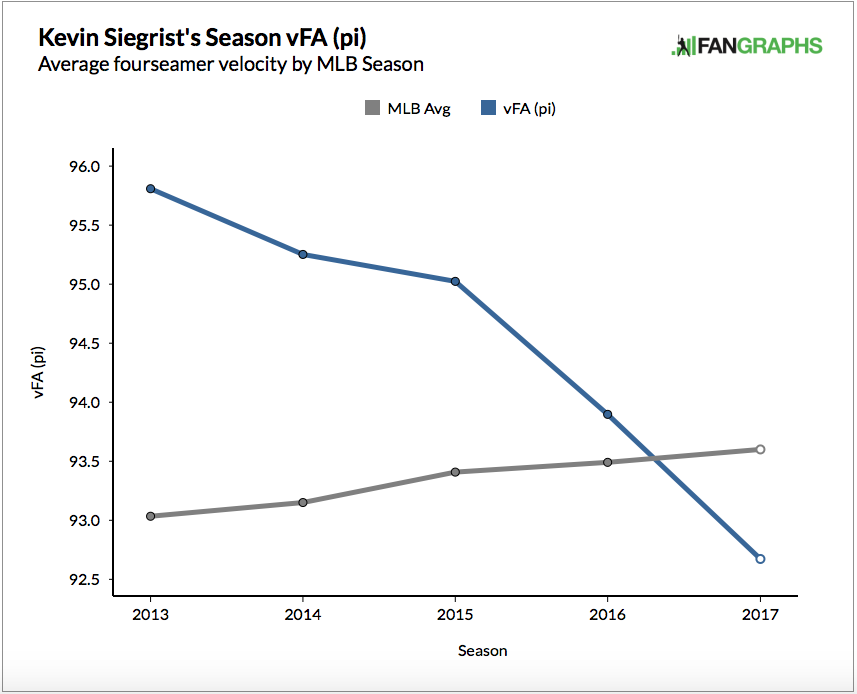
The velocity of his fastball has decreased every year since 2013. It hovered around 95.8 mph at one point, but more recently it’s dropped well below 93 mph. That’s a significant decrease, as the steep slope indicates. And for the first time, Siegrist, who is a reliever, has a fastball velocity well below a league average that includes starting pitchers.

If you have ever looked at aging curves, for hitters or pitchers, then you know that skills decline with age. Certainly, pitching velocity is no exception to this rule. Still, Siegrist is an extreme case.

cdohu0v.0.png

Velocity very clearly declines with age and Siegrist has fallen right in line with this trend. For the first two or three years of his career, his changes in velocity pretty closely matched the aging curve. However, for the last two years, there has been a marked decrease.

In case you haven’t gotten the point, here’s one more graphic that shows Siegrist’s velocity problem.

dFMO5Fj.0.png

This slope looks more like something I would ski down than data you want to see from a pitcher’s velocity. Clearly, Siegrist had an excellent stretch in 2015 and he produced the numbers to back that up. Other than that, we see a pretty consistent decline.

So, is that it for Kevin Siegrist? A slow decline into oblivion? I don’t think so. I actually expect him to far surpass expectations in the second half of the year.

What if I told you, Siegrist has actually improved this year? He’s not telegraphing his pitches. He has improved his tunneling. (For extra reading, here are primers on tunneling from The Hardball TimesBaseball Prospectus, and FanGraphs.)

Essentially, tunneling is the ability of a pitcher to repeat his delivery with similar, if not identical, release points. If a pitcher is able to do this, a batter has less time to recognize the pitch and a lower chance of getting a hit. If a pitcher’s release points are completely different, say for his fastball and changeup, a hitter can more easily distinguish between the two and put a better swing on the ball.

KacwLaW.0.png

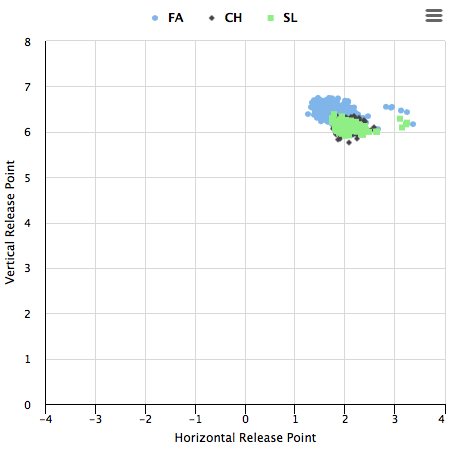
These are Siegrist’s release points from 2015 (his most successful year).

XKPHtpM.0.png

And here are the release points from the first half of 2017.

Let’s keep in mind we’re talking about inches here, not feet. Still, the differences between these two years are significant. The release points from 2015 are more spread out than the data from 2017. Siegrist has improved his ability to replicate pitch deliveries. Unfortunately, due to his decreased velocity, this hasn’t resulted in any type of noticeable success.

In 2015, the changeup and the slider release points overlapped nicely, but the fastball release points stick out like a sore thumb. In 2017, with the addition of a cutter, there is much more overlap among the pitches. If he can keep this up, it should translate to long-term success.

Moving away from release points, pitch virtualization data confirms the same hypothesis: that Kevin Siegrist has improved his ability to replicate his delivery.

ntGolVd.0.png

This is the data from 2015. To the average viewer, and even probably to you and me, this doesn’t look too bad. At the 55-foot mark, the pitches have pretty similar locations. Even at the 30-foot mark, it’s probably pretty difficult to distinguish between five of his six pitches.

If we compare it to the 2017 data, we see a considerable difference.

Hc7PwQP.0.png

It’s pretty clear, right? At 55 feet, the release points aren’t “pretty similar,” to use my own wording, they’re practically identical. And the trajectories remain extremely close to one another until about the 20-foot mark, when they break. 20 feet at 93 miles per hour (an all-time low velocity for Siegrist) gives the batter about a tenth of a second to decide what to do.

There is no denying that Kevin Siegrist has a velocity problem that he would do well to fix. And if the first half of 2017 is any indication, it needs to happen fast. It is unfortunate that he has not been able to reap the benefits of an improved delivery. The consistency in release points that Siegrist has shown during an abysmal 2017 is encouraging and should provide a source of hope going into the second half of the season.


Joey Gallo Is an Absurd Outlier

If you follow baseball, you’ve heard of Joey Gallo. However, he’s on track to be a member of a list of players that includes Rob Deer, Ivan DeJesus, and Tom Tresh.

Who are these guys? My point exactly.

That list is of qualified players who have hit under .200 for a season in the last 50 years. It’s quite an exclusive club. Over the course of half a century, only 13 players have managed to accomplish such a feat. In fact, there are more players who have hit above .368 for a full season than under .200.

Still, Gallo provides above-average, albeit inconsistent, value. He boasts an above-average wRC+ of 108, which is extremely impressive considering his .194 batting average. His wOBA, at .342, is more than barely above average and he is among the league leaders in home runs — certainly a primary source of his value.

Of course, followers of the game know his tendencies and understand that he’s pretty much a strikeout-or-homer kind of guy. Although there is a growing camp of believers who trust he could actually develop into a great player if given the time, I’ll leave that discussion for another day and probably for another person.

Still, it is worth examining just how far outside the standard bell curve Gallo’s performance has placed him. One only has to look at his Brooks Baseball landing page to see the kind of player the young Ranger has become. Against every type of pitch, Gallo’s result is “a disastrously high likelihood to swing and miss.” Again, this is no surprise; we know what kind of player he is at the moment, but this shows just how absurd it is that he actually provides decent value.

Uj3uizu.0.png

This graph is one representation of Gallo’s performance (the glowing dot). Despite placing in the bottom three in batting average, he is well above the 50th percentile in wRC+. This really is incredible. No other player with an average within 20 points of Gallo’s has a wRC+ above 77. That’s 30+ runs below the power hitter.

As a previous article noted, Gallo made his way to the majors via the three true outcomes — walking, striking out, and hitting home runs.

Surprisingly, Gallo walks at a well-above-average rate. And he has for his entire, although short, career.

OjHsUkf.0.png

Aside from the HRs, this is a clear source of his value. However, his strikeout rate is more than 3x his walk percentage.

qy72hmv.0.png

This is another graphic that is just absurd. Gallo strikes out more than any other player, but still manages to accrue statistics that show his positive value. Imagine if he lowered his K% and hit a few more doubles, or even singles for that matter. His value would skyrocket.

The last of the true outcomes is the HR. We know Gallo can hit, but here is a graphic that connects a few of the factors already discussed.

wzhmU7d.0.png

As you might have guessed, Gallo is the player leading the league in whiffs. This graphic details the relationship between whiffs and HRs with overlaid colors showing batting average. I expected there would be more darker blue dots (lower averages) around Gallo and toward the right half of this graphic. For the most part, however, the dots around Gallo are red, or at least grey. It’s a nice image that confirms what we already suspected: Joey Gallo essentially whiffs or hits a HR.

Some might look at his sub-.200 average and write him off, while others could look to the future with hope for a player who has produced solid value, going yard with the best of them and walking at a solid rate. Joey Gallo is a player with a tremendous ceiling, but for now, we know exactly what kind of player he is. To use any other word but strange to describe the value he provides would be inaccurate. He certainly has a certain value, even now at 23, that no other player in the game has replicated. And the Rangers will take it.


Does Speed Kill?

Speed kills. At least, that’s what people say.

Speed is certainly a good tool to have. All else equal, any manager would pick the faster guy. Of course, speed is a huge asset in the field, especially for outfielders. Good speed increases range, providing a sort of buffer zone for players who don’t get a good jump on the ball or who don’t read the ball well off the bat. No one in their right mind, when given the choice, would pick the player with less range (again, all else equal). And so we can all agree that speed very clearly increases a player’s value in the field.

Whether or not speed increases a player’s value at the plate is a different story. The faster guy may leg out an infield hit every now and then or stretch a single into a double or a double into a triple, but this won’t significantly increase a player’s value outside of a small uptick in average.

Luckily, Baseball Savant’s sprint-speed leaderboard gives us some interesting data to examine (you can find the interactive tool here).

wSkcbNu.0.png

Here, we can see that the league average sprint speed is 27 ft/s. Catchers, first basemen, and designated hitters are typically below league average. And it comes as no surprise that outfielders, especially center fielders, are typically above league average.

If we look at the fastest player at each position for 2017, we can come to a better understanding of the value of speed.

scWVCyU.0.png

Notably, of the nine players on this list, only four of them have a wRC+ above 100 — league average. Is this significant? Probably not as a stand-alone statistic. But it is safe to say that speed does not directly correlate to value. And it certainly doesn’t correlate to value at the plate. Even when examining the WAR column, you won’t be blown away. Dickerson and Bryant are having great years, but for the most part these players represent a pretty average group.

As mentioned previously, only four of these players are above average in terms of creating runs (highlighted in red and orange). The players with wRC+ values in red have not had success because of their speed. They all have ISOs that are at least 50 points above league average. Basically, their success can be attributed to power, not speed.

However, JT Realmuto’s ISO is essentially league average. Did speed boost his value that much? (NOTE: speed is not taken into account when calculating wRC+; still, the value of each outcome, which is considered in the calculation, can be affected by speed) Realmuto’s speed puts additional pressure on opposing defenses, especially relative to other catchers, but I would be very hesitant to say that speed alone created a difference of 9 wRC+ between him and the average player.

Billy Hamilton is the fastest player in the league. And while most would call him a plus defender, very few would call him a good all-around player. His wRC+ value of 57 is seventh-worst out of all qualified players (highlighted in blue). Although he leads the league in stolen bases, even that wasn’t enough to raise his WAR above a dismal 0.5. We can safely say that speed does not correlate to success.

What about specific teams? Do teams compiled of speedsters at every position win more games?

w9geMYB.0.png

Here is the same image as above with only Marlins players highlighted. Miami has a player with above-average speed at every single position, save for Justin Bour at 1B who has been a top-20 player in the MLB based on offensive production this year. Without question, the Marlins have a lot of speed, but still, they are six games under .500 and 10.5 games out of the wild-card race in the National League.

HXJEqCo.0.png

Here is the same image with San Diego players. The Padres are a speedy team. They have not one, but two players above league average at three different positions. Even their catcher, Austin Hedges, is only slightly below league average while still significantly faster than the average catcher. Despite having one of the fastest teams in the MLB, the Padres are 14 games below .500 and 19 games out of first place in the NL West.

Speed isn’t a stand-alone tool. It is a great complement to someone who makes contact at high rates (see: Ichiro) and it can put pressure on a defense, forcing fielders to rush to make a play. Furthermore, it is a crucial tool in the field, increasing range for all players, most significantly for outfielders. However, speed in and of itself is by no means an indicator of overall value. In baseball, speed doesn’t kill.


The Value of Hitting the Ball Hard

There is value in the fly ball. That statement isn’t something that will surprise any fan. Even someone who knows very little about baseball could piece together the logic behind it. The most valuable individual outcome is a home run. How do you hit a home run? Hit a fly ball. As Travis Sawchik found for 2016, fly balls produced a wRC+ of 139, while ground balls put up a mark of 27 wRC+.

Of course, the sabermetrically inclined will quickly point out that it’s not that simple. Judging the value of a hit based on whether it is a fly ball or a ground ball is a futile exercise. You have to consider batted ball distance, launch angle, and exit velocity. Much has been made about the recent “fly ball revolution” occurring throughout the league. And while some believe hitting more fly balls really does increase the value of a player, data suggests that the fly ball revolution is hurting as many batters as it’s helped.

It’s possible that there are benefits to hitting more fly balls, but that doesn’t seem to correlate to an increased value.

2LMPbub.0.png

There really is no correlation between fly ball % and wRC+. So, it seems that value is added not by hitting the ball higher, but by hitting the ball harder.

Ll87TiG.0.png

Now this is a pretty clear correlation. Hit the ball harder and a better outcome is more likely. A soft liner toward the second baseman will probably be an out. But, a laser to right-center field could be a triple.

This trend is not a new development or a new discovery. As far back as 2002, when batted-ball data became available, there has always been a positive correlation between Hard% and wRC+. In fact, the average correlation (R-squared value) between these two variables over the last 15 years is .475.

Hard% also has predictive value. Take a look at the data for 2017 thus far.

yKhUSON.0.png

Although the correlation from past years isn’t there, it doesn’t need to be. We should no more expect the data to already have an R-squared value above .4 than we would expect an MVP to have a WAR higher than 6 at this point of the season. Because there are quite a few outliers that will come back to the mean, Hard%, based on its historical data, has considerable predictive value.

Ignoring the one point above the 200 wRC+ line (Mike Trout, whose entire career is an outlier), let’s examine a couple outliers. First, the point on the far right toward the bottom. Nick Castellanos is hitting the ball harder than Aaron Judge, who just set a Statcast record for hardest home run ever hit, but only has a wRC+ of 82 — well below average. Towards the top of the chart at the 175 wRC+ mark, we see that Zack Cozart is making hard contact only 32% of the time.

It is reasonable to expect, based on this chart, that Castellanos’s numbers will start to improve and Cozart’s will regress. As it turns out, Andrew Perpetua found the same outliers by looking at exit velocity and xOBA in a RotoGraphs article last week. These statistics all point toward the same thing — Castellanos has been very unlucky and Cozart has been just the opposite. The takeaway here is that Hard% can be used as a predictor for value even over a smaller sample size.

If Hard% is such a good indicator of success, what is the actual value of hitting the ball hard? Hitting the ball hard has been a hallmark of both HR leaders and batting champions. Over the last five years, the HR champion has an average Hard% of 40.12 and the batting champion has one of 35.16%. Although the almost five-point spread is a lot, a Hard% above 35% is nothing to laugh at — it’s still in the upper half of all players.

For the last full season (2016), increasing Hard% by even just 5% added 13 points to the wRC+ value. That is pretty significant. For context, 13 wRC+ is the difference between Aaron Judge and Yonder Alonso so far this year. But has it always been this way? Not exactly. In 2002, a 5% increase in Hard% increased a player’s wRC+ by 20 points. This points toward an interesting trend.

J3hjnZi.0.png

For the last 15 years, the correlation between Hard% and wRC+ has decreased. In other words, hitting the ball hard is not as valuable as it once was. My initial thought was that players aren’t hitting as many HRs as they did in 2002. But that is simply not true. 14.2% of flies result in HRs — the highest rate ever recorded. Perhaps this trend is a result of defenses shifting. Are batters hitting the ball harder than ever, but fielders are now better positioned? The shift is certainly a powerful tool — it kept Ryan Howard out of the Hall of Fame. Still, I’m not convinced the shift is solely responsible for this eerie trend.

Hitting a ball hard is much more important than hitting it high, that is, if you can’t have it both ways. However, the value of hitting the ball hard has decreased for more than a decade. Looking at the data, is it possible that in 10 years we’ll see a sort of “v” shape, indicating a return to the value of hitting the ball hard? Maybe. But for now, this is an interesting trend with no clear indicator.


The Reinvention of a Yankee You Aren’t Hearing About

gary-sanchez-aaron-judge-14.0.jpg

“Funny things happen in baseball” was what one former major-league GM had to say regarding the Yankees’ unexpected success thus far. 2017 was supposed to be a rebuilding year for this club, but after winning 30 games before the end of May, the Bronx Bombers have established themselves as one of the best teams in baseball. As Henry Druschel writes, the Yankees are not only good, but fun!

Baseball is a team game, so it’s impossible to give credit to one or even a few players. But in a season that was supposed to be focused on the development of prospects — Judge, Bird, and Sanchez — it has become impossible to ignore the surprising production from some of the established veterans on the team. Starlin Castro is having the best season of his career. Jacoby Ellsbury is having more success in a Yankee uniform than ever before. And Matt Holliday is on pace to produce the highest power numbers of his career since he played 81 games a year at hitter-friendly Coors Field.

All of these players deserve credit for the early success of this team. But one player who has not received enough praise, especially after reinventing himself, is Brett Gardner.

For years, Gardner was nothing more than a slap hitter. He would get on base at a decent clip, where he was a real threat, stealing almost 100 bases between 2010 and 2011. He was never, by any stretch of the imagination, a power hitter — in the first five years of his career, his ISO never topped .110. And that was okay. By many accounts, he was a good player. Not great, but good enough to average almost 5 WAR from 2010-2014.

Flash-forward to 2017 and Brett Gardner is a different hitter. Aaron Judge, the heir-apparent to Jeter’s throne in New York, commented on the 33 year-old leadoff hitter’s changed approach: “He’s a little ball of muscle. I’m just glad he’s finally using it now.” He sure is. There are clear trends in Gardner’s “medium” and “hard” contact numbers.

Hlp9BwD.0.png

Gardner is hitting with hard speed at a rate of 34.8%, markedly higher than his career average of 23.6%. His medium-speed percentage is 10 points lower than it has been at almost any point in the last three years. And his soft-speed percentage is also below his career average. His approach has changed.

Notably, Gardner is not clenching his teeth and swinging for the fences a la Chris Davis or Chris Carter. His walk rate and strikeout rate are both in line with his career averages. He’s not chasing balls out of the zone, either.

uupSxGq.0.png

Almost a third of the way through the season, Gardner is more disciplined now than in the past. His O-Swing% is in the top 10 with players like Joey Votto (who has stopped striking out) and Matt Carpenter, who is tied for first in non-intentional walks drawn.

With this new approach, Gardner is hitting for more power than ever before.

TYVPd1h.0.png

As you can see, his average has remained relatively constant. In other words, his slugging percentage didn’t skyrocket because he started to hit a bunch of singles. Gardner really is driving the ball, leading to more extra-base hits. As a result, his isolated power numbers have risen dramatically. Isolated power (ISO) shows how often a player hits for extra bases.

7EcLSdx.0.png

For just the second time in his career, Gardner’s ISO has risen above the league average. And in 2017, his numbers put him in the same ballpark as Kris Bryant and Giancarlo Stanton.

During a period where the Yankees have gone from rebuilding to contending, Brett Gardner has evolved from a slap hitter into someone who drives the ball remarkably well. Aaron Judge is having a tremendous season, and with Trout’s injury he may well be the AL MVP.

But Gardner’s transformation shouldn’t go unnoticed. His ISO won’t stay at .259 all year. In fact, with only 200 plate appearances, this number doesn’t have much predictive value on its own. It’s clear, however, that Gardner has changed his approach. He is no longer the speedy, slap-hitting leadoff guy expected to steal 30 bases. Although Girardi still pencils him in at the top of the lineup, Gardner has reinvented himself to hit for power.


The Case for Kolten Wong to Lead Off

Up until Wednesday’s game, the Cardinals offense had been struggling, or as Bernie Miklasz described it: “snoring.” As a result, the Cardinals went 1-5 over six games despite a rotation ERA of 1.28. In the same article, Bernie highlights some of the reasons this team has a “mediocre” record with the best starting pitching in baseball (3.06 ERA). Namely, a low on-base percentage from the leadoff hitter. How low you might ask? It’s at .302, which is good for 26th in the league.

Dexter Fowler

Mike Matheny has used only three different players in the top spot of the order: Dexter Fowler (35 games), Kolten Wong (7 games), and Greg Garcia (1 game). Without question, when Dexter Fowler is playing well, he should lead off. After all, that’s what he was signed to do (in one of the biggest FA deals of the offseason). Not only did he play a key role in leading a Cubs team that combined for well over 200 wins in 2015 and 2016, but he also had an OBP of .393 last year — second only to Mike Trout (who might end up being better than Mickey Mantle). This year, Fowler’s OBP has dropped to .305 and his wRC+ has fallen from 129 in 2016 to 89 (For those unfamiliar with wRC+, 100 is average).

I’m not the only one thinking it might be time for a change; Matheny has hinted at it too. But he’s not ready to make a decision just yet. Here’s why he should be.

Kolten Wong is quietly putting together a solid campaign. In one of the early surprises of the season, with a slash line of .281/.376/.422, Kolten has provided more value than Fowler thus far. If we look at a recent, albeit smaller sample size, the results are even more shocking.

UVizuk4.0.png

These results paint a clear picture: Wong has been the better player for the entire month of May. Although not an enormous difference, Wong’s 15 wRC+ advantage over Fowler is significant. As the splits become smaller, the difference only increases. This illuminates Kolten’s recent success and Dexter’s struggles.

While some may say Fowler is a natural leadoff hitter and Kolten is not, these two players have very similar plate-discipline profiles for 2017. Both players swing at about 26% of pitches out of the strike zone. To give these values some context, Matt Carpenter swings at 17% of pitches outside the strike zone, while Randal Grichuk swings at 35% of pitches outside the zone (plate-discipline profiles can be found here).

These next two tables show two things: the consistency with which Fowler has struggled, and the consistency with which Wong has excelled.

pzlogR3.0.png

Fowler has been an average hitter against the four-seam fastball. Against all other pitches, he isn’t hitting above the Mendoza line. When we examine the same data for Wong, we see a different kind of consistency.

QmNm3AI.0.png

Kolten has excelled against most pitches. This is the profile of a complete major-league hitter. Of course, this isn’t the largest sample size. But a quarter of the way through the season, I’m sure many of you are as surprised as I was to see how consistent Kolten has been. Sure, he’s struggled with the sinker and doesn’t hit for much power, but I would argue that the Cardinals only need their leadoff hitter to get on base. In fact, Fowler’s pop would be a welcome addition with runners on base lower in the lineup.

The Cardinals have a few options for the leadoff position. The three players that have been used thus far (Fowler, Wong, Garcia), as well as Matt Carpenter. Because his power is needed in the 3-spot, Carpenter isn’t an option with this roster. Garcia isn’t an everyday player, so that option is not realistic either. And when it comes down to Fowler and Wong, the outfielder’s struggles have opened the door for the young infielder. It’s up to Matheny now.


What Happened to Adam Wainwright?

At 24 years old, Adam Wainwright burst onto the scene, closing out the 2006 World Series and bringing the Cardinals their first championship in almost 25 years. Over the next 10 years, he was the opening day starter five times and racked up the 7th-most wins of any pitcher despite missing the entire 2011 season and most of the 2015 campaign. If you prefer to measure a pitcher’s performance in Wins Above Replacement as opposed to wins, Wainwright was still a top-10 pitcher from 2007-2016.

Adam Wainwright

If you’re still not convinced, he finished in the top three of Cy Young voting four times and received MVP votes in 2009, ’10, ’13, and ’14. By all accounts, Adam Wainwright was an elite player for the better part of a decade, even after recovering from Tommy John surgery in 2011. Still, by all accounts, he has been anything but elite since.

What happened?

In 2014, Wainwright’s last dominant year (6.1 WAR), he threw almost 230 innings on his way to a 20-9 record with a 2.38 ERA. Since then, he has posted a 4.35 ERA — almost a full 2 runs worse than 2014. Is this just the decline that comes with age, especially as he pitches in his age-35 season? Is it lingering effects from his devastating Achilles injury in early 2015? Admittedly, it’s probably a combination of both. They key, however, is the pitch he used to break onto the scene way back in 2006.

hrlpgo.0.gif

The curveball, which was his go-to pitch for years, is no longer devastating hitters with the consistency that it once did.

There has been a consistent decline in the percentage of whiffs Adam gets on his curveball. It peaked at 17.22% in 2014 and has fallen to 10.26% early in 2017 — a 40% decrease.

Curveball Whiff Rate

But a decreasing whiff rate doesn’t necessarily mean the pitch is failing him; maybe the batters are just making more contact?

When looking at how the vertical movement of his curveball has changed over the last few years, it is evident that the pitch has regressed.

Vertical Curveball Movement

From 9.22 inches in 2014 to 7.54 inches in 2014, the movement on Wainwright’s curveball has decreased by almost 20%. No wonder the whiff rate decreased by so much — the curveball doesn’t have the necessary movement to trick hitters.

This is probably a result of age. How many pitchers maintain the efficacy of their best pitch for their entire careers? None. But the most important thing to do, especially with a curveball, after realizing you can’t get the ball to move like you once could, is to selectively pick when to use it. If Wainwright used his regressing curveball more sparingly, it might be more successful. Instead, he has taken an obviously less effective pitch and increased how often he uses it.

Pitch Usage

Wouldn’t it make sense to use a decreasingly-effective pitch less often? As you can see, instead of markedly decreasing how often he uses his curveball, the long-time Cardinals ace actually increased its usage rate. Now, the graph shows a variance of only a few percentage points — relatively insignificant. Notably, the 28.89% usage rate is the most Wainwright has ever used his curveball.

Let’s do a quick recap. Adam Wainwright is not getting whiffs from hitters because his curveball doesn’t have the movement it once did. And instead of lowering its usage rate, he increased it to an all-time high.

What should we expect to happen when a less-effective pitch is used more and more?

Batting Average by Pitch Type

The batting average against his curveball has risen to .380 in 2017 — more than doubling since 2014. This is alarming. It leaves hitters hoping Wainwright throws them a curve — a stark contrast from a pitch that used to buckle knees.

Recently, we’ve seen less of Wainwright’s dominant curveball, and more of his less-effective curveball, leading to more hits, runs, and losses. Wainwright’s success is directly linked to the effectiveness of this pitch. While it may no longer be elite, it can be effective if he saves it for the right moments.


Platooning Kolten Wong and Jedd Gyorko

Last week, the Cardinals announced that Kolten Wong would be part of a platoon with Jedd Gyorko. As Mark Saxon noted, Wong did not react well to the news (although he later clarified that he would prefer to stay in St. Louis). Kolten and the Redbirds agreed to a five-year, $25.5-million contract last spring, but what might have served as a confidence booster for the young second baseman resulted in a slash line of .240/.327/.355 over 121 games.

The reason for this platoon is Gyorko’s bat. He did lead the Cardinals with 30 home runs in 2016, a number that had him tied for 11th in the National League. But is Gyorko that much better offensively to offset Wong’s defensive attributes?

Let’s look at this from two different perspectives: in the field and at the plate.

In the Field

Using data from 2015 and 2016, Wong and Gyorko played over 1000 innings at second base — a large enough sample size to use in an analysis. Examining the Ultimate Zone Rating per 150 games (UZR/150), we see that Kolten and Jedd have scores of 3.1 and 4.2, respectively. So, while Gyorko seems to have an advantage here, over the course of a 162-game season, this is a relatively insignificant difference.

Looking at Def, which measures the number of runs above or below average a player is worth, we see that Wong scores 8.2, while Gyorko scores 5.3. According to FanGraphs Rules of Thumb for interpreting this statistic, both players are between “above average” and “great defenders.” Wong’s advantage here equates to about 1/3 of a win. Again, no significant difference in their fielding abilities.

If we look at the Inside Edge Fielding statistics from FanGraphs, we see, as a whole, that Kolten makes more difficult plays, but Jedd makes the easier play a greater percentage of the time. For instance, look at the percentage of “unlikely” plays that each player made. An “unlikely” play is a play that is made 10-40% of the time. Kolten made 27% of these plays, while Jedd did not make a single one. At the same time, looking at plays that are “likely,” Kolten made 73% of them, while Jedd made significantly more (88%).

An analysis of these statistics shows us that, in the field, Kolten may make more web gems, but Jedd is the more consistent everyday second baseman. Nevertheless, there is not much separating these two on the defensive end.

At the Plate

At first, this part of the debate seems relatively simple. Gyorko led the team in HRs last year, he is clearly the much better hitter, right? Let’s take a look. At first glance, the players look very similar, with Jedd posting a line of .245/.301/.445 and Kolten producing a line of .254/.323/.375.

One key aspect of a platoon is starting the right-handed hitter against southpaws and vice versa. So let’s look at the zone profiles.

Kolten vs. Righties

Jedd vs. Lefties

Kolten is, far and away, the better hitter in this platoon in terms of average. But Gyorko’s greatest success was his power, right? So let’s look at the slugging zones.

Kolten slugging vs. Righties

Jedd slugging vs. Lefties

Although there are places where Jedd has the higher slugging percentage, Kolten has slightly lower, but similar zone ratings over a longer period of time. Even with advanced statistics, these two players are very difficult to separate.

By the eye test, Kolten seems to have the advantage in the field, but the statistics tell us that these two players are actually very similar. In addition, Jedd seems like the better hitter, but the statistics tell us that, again, they are very similar. Perhaps there is one thing that we can glean from this analysis: Kolten should be put in a place where he can reach base in front of players who drive the ball and Jedd should be placed where he can drive runners in.

To respond to the question asked at the beginning, should this platoon continue? The statistics tell us yes. As a younger player who just signed a large extension, Kolten has more upside. However, if we are to make a decision for this year, not the future, the numbers tell us that the platoon should continue because neither player has separated himself from the other.