Archive for Player Analysis

Greg Allen: More Than Meets the Eye

Spring training is here, the trade rumors have quieted a bit, and it seems as if Cleveland’s 40-man roster will be comprised of players already in Goodyear, Arizona.

Many fans have voiced their displeasure with the Indians’ lack of willingness to spend money on upgrades. The front office believes that with the way the division is set up, and with the current mix of young players and recent acquisitions, the Indians are in a position to continue winning into September and beyond, depending on if and when some of the young players breakout. President of Baseball Operations Chris Antonetti also suggested that they would be willing to make midseason adjustments depending on roster needs and the market at that time.

Nevertheless, that has not sat well with the Indians fan base. It is easy to be upset when the free agent market has been as glacially slow as it has been. Let’s not forget though, prior to the team’s World Series run in 2016, the Indians opened the season with Marlon Byrd, Rajai Davis, and Collin Cowgill starting in the outfield. It is a long season and one that is full of surprises.

One of the young Indians outfielders who may be poised for a breakout season is Greg Allen. Allen was a sixth-round pick in the 2014 draft from San Diego State University. Although his 2018 slash line of .257/.310/.343 may not raise too many eyebrows, there is much more than meets the eye.

Allen played in 91 games for the Tribe last year as well as 47 for the Triple-A Columbus Clippers. He had a difficult transition to the majors partly due to the fact that from the end of spring training, he was optioned and recalled five times.

That type of uncertainty would be difficult for any player to have in the back of their head, let alone a rookie trying to find a spot on a playoff contender. Last season, Allen was twice called up for as few as two games until being optioned back to Columbus. Read the rest of this entry »


A Look into Robert Gsellman’s Curveball

Robert Gsellman of the New York Mets had a fairly average 2018. After struggles in the rotation during 2017 due to injury and ineffectiveness in facing batters a third time, as well as losing two miles per hour on his sinker compared to the previous year, Gsellman was moved into the bullpen full time. The plan initially worked, with an uptick in velocity and an improved strikeout percentage during April. Unfortunately, the rest of his season was filled with highs and lows, resulting in an 86 ERA+. However, his curveball did improve drastically in 2018.

Changes to Movement

One of the main ways Gsellman’s curve improved was his added spin rate. In 2017, his curveball had 2606 revolutions per minute, and in 2018 it was 2699 rpm. An increase in spin rate leads to an increase in the movement of the pitch. These two graphs demonstrate how this increase in spin rate translated into movement from 2017 to 2018. The first graph shows changes in vertical movement and the second one shows changes in horizontal movement.


These graphs express how Gsellman has added more bite to his curve (vertical movement from -4.3 to -6 inches) and a bit more depth to his curve. Visually, we can see this using the power of GIFs. The first GIF is his curve from 2017 and the second one is from 2018.


The 2018 curve breaks more sharply and also breaks from right to left more, as opposed to its 2017 counterpart, which is more of a tight vertical break. This added spin was most likely due to an increase in the pitch velocity increasing (80.2 mph to 81.8 mph). Read the rest of this entry »

Introducing WPA-Win: A Better Pitcher Decision Statistic

Baseball fans have seen it time and again: a starting pitcher will twirl a masterpiece, but because his team doesn’t score, he’ll be tagged with a loss. Or a reliever will come into a game, pitch to one or two batters, and end up with the win.

The vagaries of assigning wins and losses to pitchers are a well-known irritant to serious baseball fans (though perhaps not to old-timers like Bob Costas or John Smoltz). Here is the pitching decision statistic explained:

The winning pitcher is defined as the pitcher who last pitched prior to the half-inning when the winning team took the lead for the last time.

The losing pitcher is the pitcher who allows the go-ahead run to reach base for a lead that the winning team never relinquishes.

Often timing — particularly the timing of a team’s offense — affects the statistic more than a pitcher’s actual contribution to his team’s win or loss. In other words, the decision frequently fails to reflect which pitcher made the biggest difference for the winning team (or was most detrimental for the losing team). In these cases, it simply tags the pitcher lucky or unlucky enough to pitch at a certain time in the game.

In an effort to create a more accurate stat to reflect a pitcher’s contribution to his team’s win or loss, I’d like to propose new stats, which I’ll call the “WPA-Win” and “WPA-Loss.” Let’s start with the WPA-Win:

The “WPA-Win” is given to the pitcher on the winning team with the highest WPA for that game.

I’ll address how to calculate the “WPA-Loss” (which is more complicated) later in the article. For now, we’ll just assume it goes to the pitcher on the losing team with the lowest WPA. Read the rest of this entry »


The Slowest Pitcher of 2018

It is not a difficult task to recite some of the hardest throwers of 2018, such as Jordan Hicks, Luis Severino, and the like. The purpose of this article is to highlight the softest throwers of 2018. To do so, I will examine the pitcher(s) with the slowest curveball, slider, changeup, and fastball. We will ignore some less common pitches such as Steven Wright’s knuckleball (76 mph) and Hector Santiago’s rarely-used screwball (also 76 mph).

To put some modest restrictions on the analysis, the minimum is 30 innings pitched, so odd cases like Jose Reyes taking the mound are not counted.

Curveball: Kazuhisa Makita (60.0 mph)

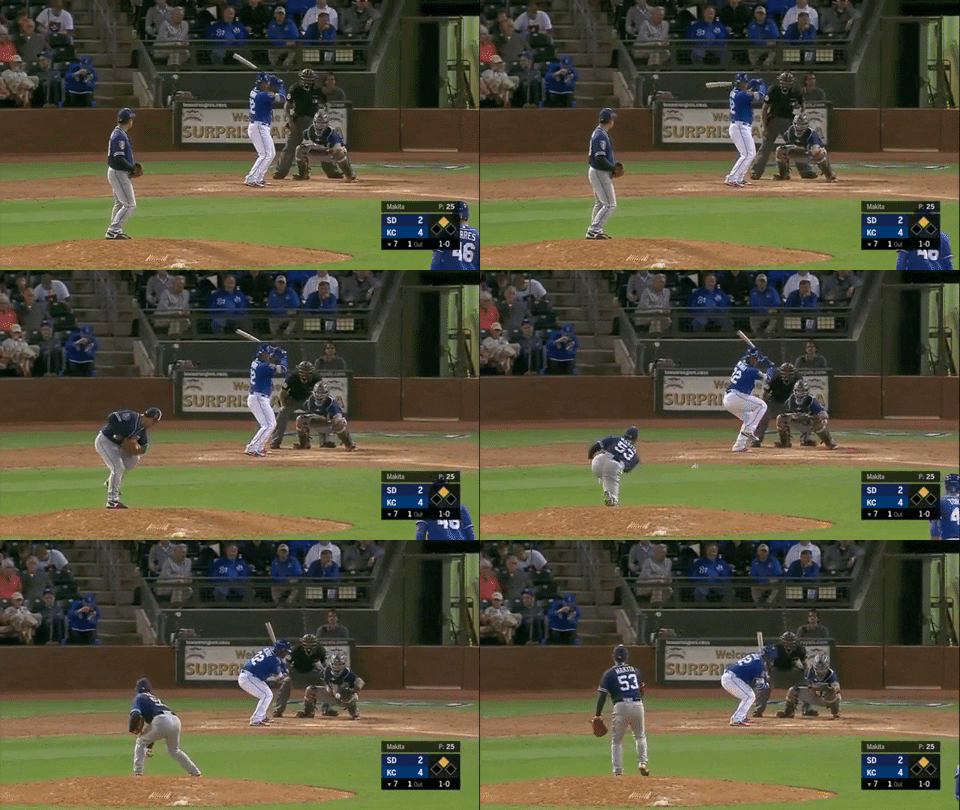
Kazuhisa Makita signed a two-year contract with the Padres last offseason to come to the United States from Japan. Below is a clip of a 52-mph pitch in spring training. Yes, you read that correctly. 52 mph.

To add to his deceptive submarine delivery, Makita’s pitch defies the gravitational forces that would pull a pedestrian 52-mph offering to the ground, breaking just outside of the initial target. It comprises only 4.6% of his repertoire, but is at minimum a very entertaining pitch.

Slider: Kazuhisa Makita (70.6 mph)

Makita returns with a slider that edges out Brad Ziegler’s by a little under 4 mph, and he throws it just under 20% of the time. While it is interesting to see Makita take the top honor for both curveball and slider, this pattern will not perfectly hold.

Changeup: Dan Jennings (69.7 mph)

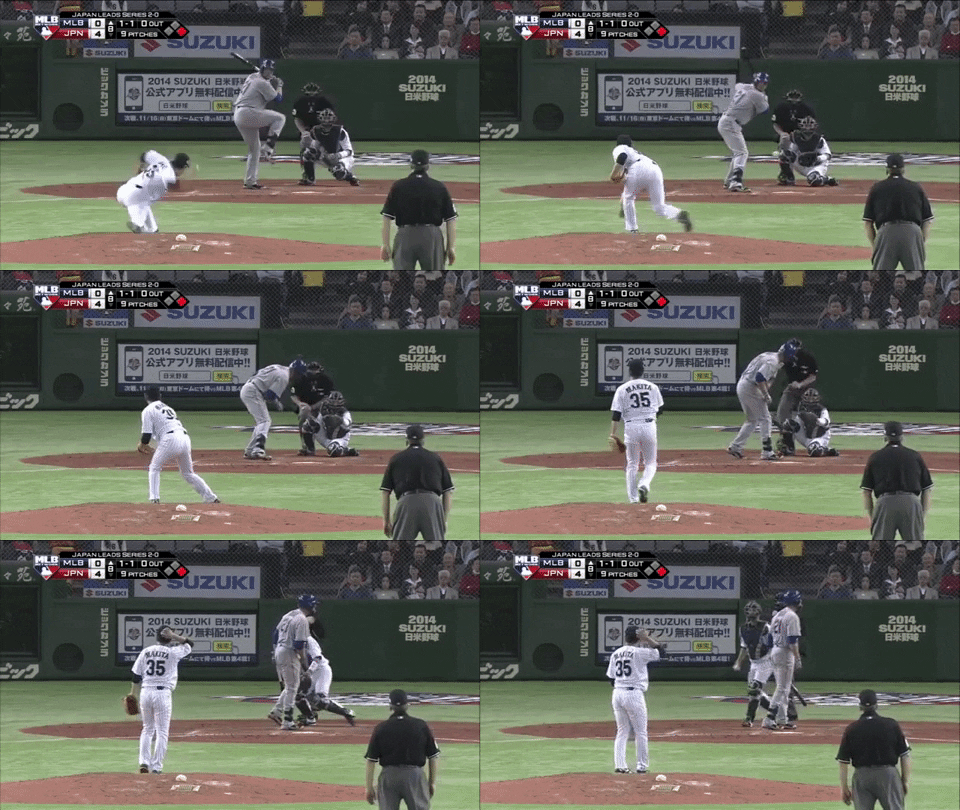
In case you were wondering, Makita comes in third, with his rarely-thrown changeup averaging 72.7 miles per hour. Here is an offering from a 2014 exhibition to Lucas Duda, then of the Mets, taken for a called third strike.

In contrast to Makita, Jennings heavily relies upon the ground ball (56.1 GB% with the Brewers last year). After bouncing around from the Marlins to the White Sox, Rays, and Brewers, he recently signed a minor-league contract with the Angels. Jennings’ most notable accomplishment last season was his one-batter start as an opener against the Cardinals, when he forced Matt Carpenter to ground out to second base.

Fastball: Kazuhisa Makita (81.2 mph)

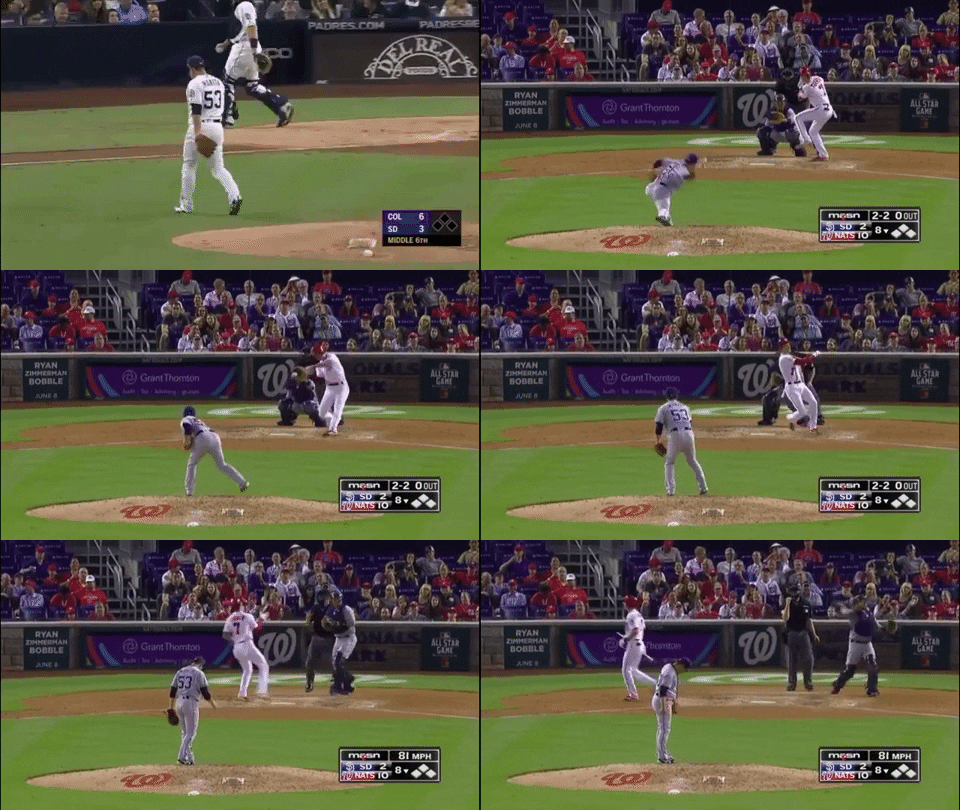
Makita’s is king again, with a fastball that was his only pitch to register a positive value last season, so despite its pedestrian velocity, it proved to be his most effective weapon. He threw it 72.5% of the time, far beyond any other pitch. Here he is using it to strike out Trea Turner.

The location in the upper portion of the zone presents a nice contrast to the curveball from earlier.

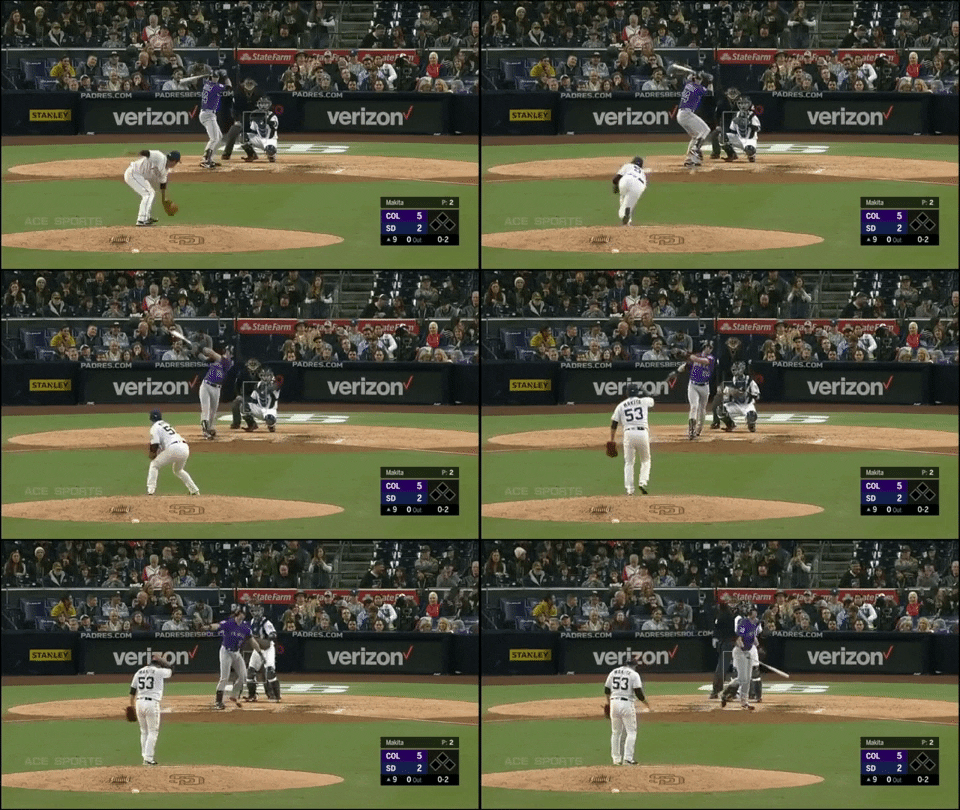
Here again the fastball is used to complete a strikeout, this time of Ryan McMahon.

One major problem for Makita last year was his inability to keep the ball in the ballpark, even while playing half his games at Petco. He yielded a 40.4% fly-ball rate, a worse-than-average 18.4% HR/FB rate, and a resulting 5.40 ERA. As a result, he was designated for assignment this offseason and reassigned to Triple-A after clearing waivers. His 4.85 FIP and 3.71 SIERA leave some (albeit little) room for improvement, but given the modest contract he signed to come over from Japan, the Padres have little to lose in keeping the slowest pitcher in all of baseball around.


The Reds May Have Andrew Miller 2.0

Andrew Miller has an undeniably nasty slider. As a Red Sox fan, I remember it far too well from the 2016 postseason. Big Papi’s farewell tour didn’t seem all that fair when you consider the way the Red Sox ran into the buzz-saw that was Miller and the Cleveland Indians. Sure, I’m grateful for Miller helping the 2013 version of the Red Sox win a third world title since 2004, but come on Andrew, you had to ruin Papi’s goodbye?

With Miller’s recent signing with the St. Louis Cardinals, I found myself exploring his FanGraphs page. I stumbled upon this article, Andrew Miller on the Evolution of his Slider, and I instantly began to wonder if pitchers had similar experiences developing their sliders in the 2018 season. The first step in this analysis was to evaluate the evolution of Miller’s slider.

What jumps off the page is the change in velocity. Miller saw a 4.6 mph increase in his slider from 2011 to 2012, then another 3 mph added from 2012 to 2013. This in large part had to do with Miller moving from a starting role to a relief role during his time with the Red Sox. Given that information, however, an increase in velocity that drastic not only shows a pitcher’s willingness to adapt, but also a pitcher’s ability to adapt. By observing Miller’s slider splits, we see that ability to adapt almost immediately.

Read the rest of this entry »


Why We Love Power Pitchers

Heat. Smoke. Velocity. Stuff. Gas. Cheese.

I’m sure there are other words to describe our beloved “fireballers” (see, there’s another one). Pitchers who throw at high speeds are treated like fine china — see Stephen Strasburg in the 2012 postseason. I’m guilty of falling victim to the allure of a 98-mph fastball, regardless of its location. We love it, and, frankly, we’d like to see more of it. Major League Baseball has created a setting in which if a pitcher doesn’t break 90 mph with his fastball, he’s considered a “finesse” pitcher, or even a “soft-tosser” if left-handed. We love strikeouts, especially when a power pitcher blows a fastball by a hitter. But why?

Matt Harvey was stellar in 2015. He’s not so good anymore. Why do teams keep giving him second chances? Mostly because he throws hard.

However, it’s not entirely our fault. After reading Thinking, Fast and Slow by Nobel Prize-winning psychologist Daniel Kahneman, I began to understand why this happens. It shows how you can overcome cognitive bias, but in order to do so, you have to understand which one of your “thought systems” is making that decision for you. He explains that each human being has essentially two modes of thought.

System 1 – fast, instinctive, and emotional (gut feeling)

System 2 – slower, more logical (critical thinking) Read the rest of this entry »


Advocating For A Different Type of Swing Change

When Statcast was launched, we were graced with incredible new stats such as Exit Velocity and Launch Angle, which revolutionized how we evaluate hitting. This new information confirmed obvious things like that Giancarlo Stanton hits missiles, but it also gave us a new breed of hitter. Daniel Murphy, Justin Turner, J.D. Martinez, and others looked at the data and made adjustments that started maximizing their power outputs. The standard evaluation method has become to look at EVs mixed with LAs to determine who is one tweak away from stardom. Hitting is a complex beast, with pitchers throwing 95-plus with nasty hooks to go with shifting defenses. Ultimately, a hitter is looking to produce solid contact regardless of where the ball goes. The goal of this analysis is to identify hitters who have an inefficient spray chart and see how they could optimize their profile by hitting more balls in a different direction to maximize production. Luckily with Statcast, we can now try to find these answers.

To do this analysis, I used Baseball Savant to gather 2018 Exit Velocity and xwOBA to Pull Side, Straight Away, and Oppo Side for all hitters with at least 50 plate appearances. I then used FanGraphs to pull the 2018 data for Pull%, Mid%, and Oppo% to discern how often a hitter attacks that field. I used 50 PAs as a filter since this is about where exit velocities become stable and helps weed out pitchers and other noise. This does create gaps in the data because some players didn’t register 50 PAs of a batted-ball direction. This dataset gives us the ability to look at how hard a hitter hits the ball to a field, what was their expected damage (xwOBA) to that field, and how often they went that way.

The first category I looked at was players who could use the opposite field more often. To do this, I looked at players who had an above average Oppo Side xwOBA and a below-average Oppo%. I used exit velocities to each field as a proxy to justify the directional swing change. Read the rest of this entry »


Why Did Eric Hosmer Decline in 2018?

Far and away the most expensive current player on the Padres is Eric Hosmer, who has proven to be quite disappointing so far in his short time with the team. He’s due $21 million next season, which is three times the second-highest salary on the club. For a team that will almost certainly never have a payroll that compares with larger market teams, that’s a significant price to be paying.

Although he was signed in February of 2018 to be a cornerstone for the team, he promptly put up a mere -0.1 fWAR last season. He’s always been an inconsistent performer year-to-year, and this campaign was no exception. How could a player who put up 4.1 fWAR in value in 2017 see his level of play drop off so quickly in the following season? Can he bounce back in 2019 as he often does?

To begin, we need to know what held him back last season as a hitter. Hosmer’s a first baseman, so the majority of his value is going to be derived from his bat. Here’s a table showing the differences in his offensive production between the 2017-18 seasons:

Eric Hosmer’s Past Two Seasons
Season OBP BB% K% wRC+
2017 0.385 9.8% 15.5% 135
2018 0.322 9.2% 21.0% 95

Read the rest of this entry »


Wes Johnson Should Help Jose Berrios Develop a Cutter

This article was originally published on my blog, cargocultsabermetrics.com. 

Developing a new pitch can be a great way for a pitcher to have a breakout season. In 2018, we saw big improvements from Trevor Bauer adding a slider, Adam Ottavino adding a cutter, and Patrick Corbin adding a curveball. A new pitch can sometimes be the missing puzzle piece when trying to figure out why a player is good and not great. For Jose Berrios, a cutter might be that missing piece.

Examining Berrios’ arsenal

Jose Berrios has one of the nastiest curveballs in baseball. Instead of having the typical downward break associated with curveballs, Berrios’ curve averages 15.5 inches of glove-side break. This results from Berrios imparting gyro spin (think bullet spin) on his curveball rather than 12-6 top spin. Because of this, Berrios generates close to no vertical break caused by Magnus force, which is just a fancy way of saying the only drop we see on Berrios’ curve is due to gravity rather than top spin.

To pair with his curve, Berrios has a four-seam fastball which generates 9.5 inches of arm side run and 16.5 inches of upward vertical break due to Magnus force (causing the pitch to drop less), a two-seam fastball which generates 16.5 inches of arm-side run and 11.0 inches of upward vertical break, and a changeup with 14.5 inches of arm-side run and 5.5 inches of upward vertical break (the changeup will drop even more than the fastball since it is thrown slower and gravity will have more time to bring the pitch down). Read the rest of this entry »


Jurickson Profar’s Throwing Pains

Jurickson Profar finds himself at the top of the second base depth chart for the Oakland A’s, his new team following an offseason trade. That is very good news for Jurickson Profar, since it seems Jurickson Profar is struggling to throw the baseball.

The former top prospect made nine throwing errors in 2018… at two different positions. He made nine throwing errors at shortstop and nine throwing errors at third base. He also made one at second base, for a total of 19 throwing errors on the year. That is seven more than anyone else and the most in one season since the stat was first tracked in 2003.

Profar came up as a middle infielder, playing every game but one there in his minor league career. In 2018, he started at shortstop for the first three months of the season when Elvis Andrus got injured, and he struggled to throw the ball accurately. In mid-May, Levi Weaver of The Athletic was concerned Profar had the yips. In the article, Profar states how he’s struggled to make the transition defensively from Triple-A to the bigs:

“You know, this is the first time that I’ve gotten to play, for a long time, shortstop in the big leagues. Shortstop in the big leagues is not the same as shortstop in the minor leagues. You don’t get big guys like… Giancarlo Stanton, Aaron Judge, and Didi Gregorius…”

Profar was getting his first real chance to play shortstop in the majors, recognizing its difference from minor league ball, and thought he was benefiting from his time there. Just as he was getting his reps and starting to figure out the differences, the Rangers decided to move him to third base in July as Adrian Beltre’s hamstring acted up.

Profar started 46 games at third base, and the results weren’t great. He made as many throwing errors as Maikel Franco in half the innings. In an article published by Sportsday, former manager Jeff Bannister attributes Profar’s miscues to his lack of footwork:

“There are times when he gets a little out of rhythm,” Banister said. “That’s when you see those errant throws. … He continues to work on being consistent with the footwork.”

On a bunch of Profar’s errant throws this year, he seems unaware of the amount of time he has to make a play. He gets the ball very quickly out of his glove but the throws have a tendency to be off-line. He appears to be rushing his throws in situations that don’t warrant it. This goes along with his poor footwork. When he’s better able to recognize the amount of time he has to make a play, he can take the time to set his feet and make a proper throw to first base.

All that said, there are two main reasons that there is some hope for young Profar. Exhibit A is Marcus Semien, Profar’s new teammate. In 2015, Semien’s first year with Oakland, he made 18 throwing errors. The next season he made only eight, and his defensive numbers have continued to improve overall. Maybe there’s some coaches in Oakland who will be able to recognize a problem that the Rangers could not. It also doesn’t hurt that Matt Olson is one of the best defensive first basemen in the league. With that in mind, the change of location could really benefit Profar.

The other silver lining, and what you’ve probably been thinking this whole time, is that second base is a much easier throw. Profar played 79 innings at second base this year and made just one throwing error, coming on a play where he slipped, regained his footing, and then made a throw well wide of first. On plays in which he did not slip, Profar had a flawless record at second.

Even if Profar makes eight throwing errors this season at second base, the most made by any second baseman in 2018, that is fewer than half what he made last year. The Athletics currently have one of the best defensive infields in the game, and they are hoping they can help Profar stay on his feet and contribute with his arm.