Archive for Player Analysis

The 2018 Prospect Breakout Nobody Is Talking About

When I was first asked about Chavez Young, I honestly vaguely recognized the name. I knew he was a Blue Jays outfielder, but that’s about it (and I work with prospects!). Just looking at the stat line, I was impressed. And the deeper I looked, the more I began to think that this might be the most criminally underrated prospect in baseball. David Laurila also took note recently here at FanGraphs.

Quick question: Who was the only prospect in baseball to record 50 extra-base hits and steal 40 bases in 2018? You guessed it: Chavez Young. Which prospect is rated as having the best defensive arm in the Blue Jays system by Baseball America, with 98 mph from the outfield recorded in high school? You guessed it again, Chavez Young. So how does a player like this go so under-the-radar? How does a 20-year-old in full-season ball who plays plus defense, hits third in his lineup, and had 50 extra-base hits and 40 steals not even make MLB Pipeline’s top 30 for the organization?

Let’s start off by saying who Chavez Young is. Young was born in the Bahamas, an area that is starting to get more buzz as a baseball country after producing prospects like Kristian Robinson and Jazz Chisholm. But it is also an area that up until recently was rarely visited by baseball scouts. Since 1983, only one major league player has made the MLB from the Bahamas (Antoan Richardson). As a result, Chavez left the Bahamas in high school to pursue baseball in the prestigious Georgia prep ranks. Read the rest of this entry »


Batter Performance vs. Pitcher Clusters

Managers are always attempting to optimize their lineups for success. Whether they make in-game decisions like double-switches and lefty-righty matchups, or choose to change things up based on recent or historical performances, every move is meant to give their team the competitive advantage. What if they also made alterations based on pitcher groupings? In this article, I will attempt to determine if batter performance is impacted by pitcher clusters that are organized by pitch speed and pitch proportion.

The parameters used to cluster pitchers are below:

  • Proportion of Pitch Thrown
  • Average Pitch Speed

These statistics were calculated for the following pitch types:

  • Changeup
  • Curveball
  • Eephus
  • Cutter
  • Four-seam fastball
  • Sinker
  • Two-seam fastball
  • Knuckle-curve
  • Knuckleball
  • Slider
  • Splitter

*All data in this study is from 2010-July 2017 (MLB Gameday). Read the rest of this entry »


James Paxton Is Not the “Next Sonny Gray”

The Yankees kicked off their offseason by acquiring LHP James Paxton from the Seattle Mariners to bolster their starting rotation. You won’t find anybody willing to deny Paxton’s immense talent, but it’s natural for people to scrutinize big acquisitions, especially when the big acquisition is on his way to New York. This scrutiny is best exemplified by a conversation I had with my mother on the day the trade was made. My mom followed the Mets of the mid-to-late 1980s when she lived in Brooklyn, went years without watching baseball, and has watched the Yankees for the past decade by product of my fandom. This leads to the amusing circumstance that she is very familiar with current broadcasters Keith Hernandez and David Cone, all of the recent Yankees players, and almost nobody in between. Our conversation on the day of the Paxton trade went something like this:

Me: The Yankees picked up a hell of a pitcher named James Paxton. I think he’s going to do big things for the Yankees next year!

Mom: Yeah, sure. Isn’t that what you said about Sonny Gray?

Okay — she got me there.

Read the rest of this entry »


Prospecting for the Mookie Betts of Pitching

Over the past several years, we have watched a number of hitters in the minors display good contact skills with average or below-average power be labeled with 45s and 50s only to burst onto the scene with an explosion of power they never showed any hint of previous. Mookie Betts might be the best example, along with guys like Jose Ramirez, who show up to the big leagues and announce themselves by mashing.  Naturally, prospect hounds, analysts, and the baseball community investigated how these guys went so overlooked (unless you were Carson Cistulli). It was surmised that contact quality mixed with good exit velocity and appropriate launch angles allowed hitters to maximize their output even without Aaron Judge levels of thump.

This investigation, however, is not a hunt for the next minor leaguer who will smash his way onto the scene, but rather a search for the pitchers who will try to stop them. With modern conditioning and institutions (read: Driveline) making it more possible than ever to gain velocity, one no longer must be naturally gifted a 6-foot-5 frame with easy 95 to be considered a prospect. Furthermore, with openers, bulk guys, firemen, and more, traditional pitching roles are going by the wayside.

This analysis attempts to seek out pitchers who possess above-average command or secondary offerings but lack the prototypical velocity grades we are seeing in today’s game. Identifying these pitchers would make them intriguing candidates for these high-intensity velocity training plans. While you may not find the next Luis Severino, you could uncover an explosive fireman reliever, matchup guy, or high-octane backend starter that pushes you closer to October glory.

The process for this analysis involved using the 2018 updated prospects list from THE BOARD, developed by Kiley McDaniel, Eric Longenhagen, and Sean Dolinar at this very site. I started by sorting for prospects who either currently have > 55 command or project for the same. This brought the sample to 85 pitchers. Next, I sorted out pitchers who have a present FB grade of > 55. Our sample now sits at 38 pitchers who have or project to have above-average command and an average-to-below-average fastball. Before diving into the next set of data, I wanted to provide some broader notes about this group. Notable pitchers with top 100–130 considerations on this list include Atlanta’s Kolby Allard and Joey Wentz, Miami’s Braxton Garrett, and the Angels’ Griffin Canning. There are 16 lefties and 22 righties. The Phillies lead the way with five of these guys, the Cubs and Rockies are tied with three each, and then the rest of the league has one or two on this list. Additionally, the average age of this group is 22.8 years old.

Now that we have our assorted pool, it is time to sort through this group’s off-speed arsenal. This part of the analysis was more subjective. I have attempted to group pitchers with similar traits that could fill a variety of roles. What follows is three tables of guys who could benefit most from additional velocity.

Elite Pitch Guys (70 Grade Pitch)
Name Pos Tm Age FB SL CH CMD
Eli Morgan RHP CLE 22.5 45 / 45 50 / 55 60 / 70 45 / 55
Logan Shore RHP DET 23.9 40 / 45 40 / 45 60 / 70 50 / 60

This first group features two right-handers with a current 60-grade pitch that projects for 70. Of the 38, these two are the lone members who feature a current 60 pitch. Of the two, Morgan has the higher upside based on his slider. Both have fastballs that sit around 90 mph, but additional velo training could push the value of these guys up a tier. Guys from this tier could be featured as openers or one-time-through-the-order relievers that rely on one elite pitch. The selling point of this group is that they have that elite pitch to lean on even without elite velocity.

Mid-to-Backend Starter Type (One 60 and 55)
Name Pos Tm Age FB CB CH CMD
Pedro Avila RHP SDP 21.8 50 / 50 55 / 60 55 / 60 45 / 55
Joey Wentz LHP ATL 21.1 45 / 50 45 / 55 60 / 60 45 / 55
Braxton Garrett LHP MIA 21.3 50 / 50 55 / 60 40 / 55 45 / 55
Foster Griffin LHP KCR 23.3 45 / 45 55 / 60 50 / 55 50 / 55

The next group features players with multiple 55-or-better future offerings, led by Padres righty Pedro Avila, who is rocking two future 60-grade pitches. Previously mentioned notables Garrett and Wentz also fall into this category. This group represents backend starter types who are useful during the season but less useful during the postseason. Additional velo here could push these guys into strong No. 3 starters or high-leverage multi-inning guys.

Kitchen Sinkers (High Secondary Scores)
Name Pos Tm Age FB SL CB CH CMD ARS
Griffin Canning RHP LAA 22.5 50 / 50 50 / 50 50 / 50 45 / 55 45 / 55 155
Peter Lambert RHP COL 21.6 50 / 50 45 / 50 50 / 55 55 / 60 45 / 55 155
Jose Lopez RHP CIN 25.2 50 / 50 50 / 50 50 / 50 40 / 50 50 / 55 150
Aaron Civale RHP CLE 23.4 45 / 50 55 / 60 40 / 45 45 / 50 50 / 60 155
Cole Irvin LHP PHI 24.8 40 / 40 45 / 50 50 / 50 40 / 45 45 / 55 145
Alec Mills RHP CHC 26.9 45 / 45 50 / 50 40 / 40 55 / 55 55 / 60 145
Cory Abbott RHP CHC 23.1 45 / 45 50 / 55 45 / 45 40 / 45 45 / 55 145

The last group of guys profile as backend starter types who live on off-speed stuff and have no margin for error with their fastballs. I identified these players by adding their FV non-fastball pitch grades together, noted as ARS in table (ARS = FCH+FSL+FCB). These guys walk the command and off-speed tightrope to end up as backend starters in the best case, or just middle-relief guys or up-and-down starters. Occasionally these guys become Kyle Hendricks, Tanner Roark, or Doug Fister, but these are exceptions and not the rule. Almost everyone in this group is older for a prospect, so the ceiling is limited, however, additional velo for these guys could turn them into more dynamic multi-inning relivers, bulk guys, or high-end No. 4-5 starters.

I should also note that all these guys fall into different buckets of age, level, and body types. Arguably, the most critical component of a prospect on this list would be targeting high-makeup guys who would be willing to experiment and acknowledge that they could use more gas to ascend to the next level. Some of these pitchers may be maxed out physically or unwilling to change what already seems to work. This analysis also looks past statistical performance, level, and even present pitch value a bit. What this analysis does do is identify guys who could rapidly improve with additional velocity due to advanced command and secondary. The margin for error is incredibly slim for this type of pitcher, but through intense training and velocity gains, pitcher X throwing 90-92 bumping to 94-96 with already above-average command and secondaries would vault them into a new tier of player. For teams looking to squeeze every ounce of value out of their farm system, this could be another way to target undervalued talent that has yet to be unlocked and developed.


Where Did Madison Bumgarner’s Four-Seamer Go?

Something appears to have happened to Madison Bumgarner. Specifically, his four-seam fastball has gone missing. Depending on which data source you use, it figuratively and literally disappeared. Regardless of data source used, Bumgarner’s fastball isn’t performing.

Two leading data sources disagree on what has happened to Bumgarner’s fastball. Because of this, I chose to look at both sources independently: Pitch Info (through Brooks Baseball) and Statcast (through Baseball Savant). This analysis spans four seasons, 2015 through 2018, encompassing Bumgarner’s two best and two worst complete seasons.

According to Pitch Info, Bumgarner threw four-seamers in 2018 at a career-low frequency — 34.5% of the time in 2018, down from 48.2% in 2016 and 49.6% in 2015. It has been losing effectiveness since its peak in 2014. Using Pitch Info’s runs above average metric, we see Bumgarner’s four-seamer peaked in quality at 1.25 runs above average per 100 pitches in 2014 and has dropped each year since then: 0.97 in 2015, 0.39 in 2016, -0.35 in 2017, and -1.14 in 2018, a career low.

bum brooks.png

As seen in the Pitch Info Whiff Percentage charts above, Bumgarner’s four-seam fastball had its lowest whiff rate of our period of study in 2018 (seen on the left), likely leading to it’s ineffectiveness. Similarly, Bumgarner’s four-seam is measured to have had more vertical sink, independent of gravity, than it had throughout this period (seen on the right). Depending on the pitch, more movement generally increases whiff rates. A four-seam fastball moving more like a two-seamer, however, would lose swing-throughs: sinkers (two-seamers) generate more contact in the form of ground balls.

Screen Shot 2018-10-10 at 3.45.35 PM.png

Bumgarner produced his highest ground-ball rate with his fastball since 2013 while also generating the fewest whiffs with his fastball of his career. Couple the results with the change (increased vertical movement), and it appears his fastball began to behave like a two-seam fastball.

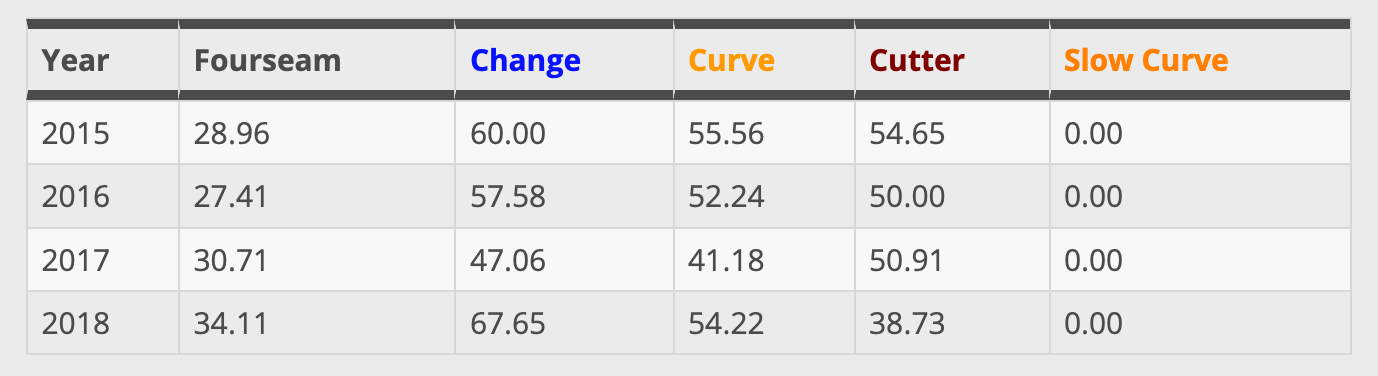
This seems to be clear already. According to Statcast, Bumgarner threw his four-seam fastball only once in 2018, as compared to 38.6% of the time in 2016 and 41.1% of the time in 2015. He replaced them mainly with two-seam fastballs, but also with some curveballs and changeups.

bum_pitches_16-18

When comparing Statcast to Pitch Info, I wondered if Statcast could have been misclassifying four-seam fastballs as two-seamers. Through looking at the above plots, however, it’s clear a cluster of pitches was missing in 2018. The above graphs are of every pitch Bumgarner threw, by horizontal (x-axis) and vertical (y-axis) movement, colored by Statcast pitch classifications. Even when ignoring pitch type labels, a pitch type is seen to be missing. Specifically, Bumgarner’s high-rising, fairly straight pitch was no longer thrown. On a side note, notice how inconsistent 2017’s movements were: likely because Bumgarner had to recover form a major shoulder injury and struggled.

With Statcast data, we can evaluate what happened with greater depth than through other methods. Below is a table of statistical changes in both Bumgarner’s two-seam and four-seam fastballs.

fastball stats

Velocity is measured in miles per hour, spin in revolutions per minute, extension is feet from the rubber, and horizontal and vertical movements are in inches from release point. Ignore 2017, as it was a very inconsistent year (as seen with the movement chart above). Both two-seam and four-seam fastballs in 2015 and 2016 had significant vertical rise due to spin. In 2018, however, Bumgarner couldn’t or wasn’t spinning his fastballs as much, resulting in less rise and more downward movement. This could be why Statcast is misclassifying his fastballs.

Why has Bumgarner lost spin on his fastballs? The data suggests two reasons why, both of which could be correlated. He’s lost velocity, and release speed correlates with spin rate. Similarly, Bumgarner has less extension on his fastballs than in 2016. His 2018 extension is similar to his 2015 extension, but because he’s lost velocity, the loss of extension could be penalizing. This loss of extension could explain the loss of spin if it’s related to grip or release.

Extension loss to home plate reduces the perceived velocity the batter anticipates, making it easier for the batter to time the pitch. Both loss of velocity and extension would, when combined, greatly benefit the batter at the expense of Bumgarner’s fastball.

What could have caused the loss of velocity and extension? Bumgarner is 29 years old, so there is a chance he’s entered his decline. The likely culprit, however, is injury: Bumgarner fell of a dirt bike in April 2017, injuring his left shoulder, and he broke his left hand on a line-drive comebacker in spring training in 2018, requiring surgery. Being left-handed, both injuries could have significantly affected his 2018.

One year away from free agency, Bumgarner likely hopes he can recover lost velocity and spin on his fastball. Whether it was an organizational change, a declining skill set, or driven by injury, his 2018 fastball difference was one to forget. His shoulder should be better healed, one year further removed from his accident, and hopefully his throwing hand does the same.

This and other postings like it can be found on my personal blog, First Pitch Swinging.

The Theoretical Attack of a Bullpen-Focused Felix Hernandez

The slow progression that leads to a self-acknowledged decline was a process Felix Hernandez, unfortunately, entirely skipped. His career arch was a natural regression to average, injury, failure to adjust; sudden, poignant, and ridden of organizational, cognitive bias. The stark drop-off resulted in a split between a player who once meant everything being the roughest point in a rotation embattled in a playoff race. The hope that Hernandez could return to a balanced tactician on the mound was probably maintained one game too long – the last time he held a team to no runs was on opening day. Even more egregious, there was no subtle change to change his approach. The long leash of hope allowed him to stay stagnantly desperate.

His last outing against the Texas Rangers was the final capitulation to put him into the bullpen, no longer scheduled to make his start on Sunday August 12. The seven runs he allowed were built off his consist frustration leading to a parochial process. He no longer worked through counts with cognition for how batters were attacking – he was simply throwing. Analytically, Hernandez works from a fastball to a breaking ball; speed leading to mistimed swinging later in the count. Simply put, his fastball is necessary for leading into the breaking ball, and with his fastball dead in the water, his breaking ball is also dead. Batters no longer deceived now look forward to teeing off on a very predictable and forced breaking ball.

As the arm dies, the fastball dies. The changeup and breaking ball, however, does not always die. Furthermore, spin may die on the curveball, but spin rate makes an average curve deadly. Henceforth, Hernandez, does not need an incredible fastball to work toward an average changeup/curve. Yet, as a starter he has failed to figure out how to work into his changeup; he is beholden to a fastball which no longer averages 90 MPH. Experimenting with velocity and pitch utilization reached a maxim in 2018, leading to nowhere even after dropping the four-seam fastball. It is a crutch he has been unable to move past.

The following charts display how Hernandez has attacked batters based on the count from 2012, 2016, and 2018. As stated, in 2012, he used his fastball to work into a changeup on ahead counts ahead or a sinker when behind. Through 2016 and 2018, injury forced him to drop the fastball on the opening pitch, instead of using the fastball sinker. This creates two problems: the sinker is no longer effective to land a strike when behind counts because it is used as the opening pitch and the sinker becomes exposed to each batter, leading to the predictable approach. His sinker now owns a 1.64 BB/K ratio with a 1.001 OPS.

Moving to the bullpen should not necessarily be a point to fix Hernandez for an eventual transition as a starter. He is, for better or worse, an abbreviated pitcher, and as of right now, cannot endure multiple innings. His limited arsenal establishes him as a stretch reliever for two innings at best. To become an endurance starter, he needs to improve his curveball to break across both sides of the plate – or, McCullerize himself.

The focus for 2018 Hernandez is bullpen effectiveness and no more. Unfortunately, precedent for a pitcher in the Statcast era who utilizes a slow fastball and curveball/changeup is limited; limited to Sean Marshall. (This is assuming that Hernandez continues to forego his fastball in the bullpen. Most curveball relievers have a fastball which averages 93-97 MPH. Fernando Rodney is another reliever who is comparable with a sinker/changeup arsenal, but even he has maintained a 94 MPH sinker at age 41.) Thus, there is some new paths to be paved with Hernandez in the bullpen, making the transition even more intriguing.

The main goal in the bullpen is inducing ground balls; that was the magic of Hernandez’s changeup in his prime. Marshall achieved this in his prime with ground ball rates of 52.2, 57.5, and 56.3 percent from 2010 to 2012. He opened his counts with a slider, moving to a curveball when ahead and staying with his slider when behind. His curveball broke left (right from Marshall’s view) and was best when slyly placed out of the zone.

Hernandez breaks his curveball in the same style, just the opposite direction. In fact, while the spin rate has dropped, without injury, there is a clear improvement in control (2018 curve map versus 2015 curve map). Using the curve to introduce batters can theoretically be complemented by a changeup which paints the other side of the plate. Even so, his changeup is falling more in the zone as he ages (implicative of lack of a fastball to paint the inside, 2012 changeup versus 2018 changeup).

Putting the different strings together, a bullpen focused Hernandez would utilize a curveball to specialize for attacking the right side of the plate, with an increase to break across both aspects. His changeup then becomes the quick out option to force quick ground balls. If he slowly beings to move that pitch into the corner of the zone again, he can end at-bats on weak contact and topped contact. Despite his demise, the changeup is a quality pitch for inducing topped contact if he is ahead of counts. (Emphasis on if, and, there is a base loss of control which cannot be ignored; again, the point he is a limited inning pitcher with an onus on control). Thus, control with the curve to land a strike or foul from the corner can lead to an inning of what might remain of a magical changeup.


Chris Archer Can’t Strike Out Lefties Anymore

Chris Archer is the classic two-pitch pitcher. He’s got a high velocity, albeit slightly flat, fastball, as well as one of the game’s dirtiest sliders. His fastball has never missed many bats, and it’s always had a wRC+ of over 120 in every year save for 2013. His fastball is nothing like that of the “spin king” Luke Bard, as it holds a pretty pedestrian 2192 RPM, less than the average MLB fastball spin rate of 2264 RPM. However, his high velocity fastball, ranking 21st this year for starters averaging about 95 mph, contrasts well with his wipeout slider.

As you can see here in this sequence to strikeout Josh Donaldson, the two pitches complement each other well. It is hard for any hitter to adjust from a 97 mph fastball to a knee buckling slider.

His slider, save for this year, has been devastating. Nobody really likes to hit his slider, and that is why he is one of the most prolific slider throwers in the game. He’ll make lefties and righties alike to look silly.

For example, Yangervis Solarte and Zack Cozart have both fallen victim this season.

https://twitter.com/PitchingNinja/status/993181847315238914

https://twitter.com/PitchingNinja/status/99743282699065344

The bread and butter for Archer is fastball away and up away and sliders below the zone with two strikes. Despite a 95 wRC+ on his slider this year, compared to his career mark of 65, the swinging strike rate on his slider is still high and there’s no reason the pitch can’t return to form.  There’s not much that’s changed with this pitch. The average spin rate is about the same as the last year, sorry @Trevor Bauer.

Archer’s past two years have been somewhat rough.  In 2016, Chris Archer went 9-19. Only he and James Shields had done that in the last 14 years.  I know I’m not really supposed to talk about wins and losses, but James Shields -1.1 WAR season is not great company.  In 2017, Chris Archer posted a strong 4.6 WAR and fell victim to a .325 BABIP that is almost 30 points higher than his career.  He’s still looking to repeat the 5.2 WAR 2015 with a 3.23 ERA and a 2.90 FIP.

Archer has also always liked to throw the slider more with two strikes.  Over his career, he has thrown 2719 sliders with two strikes, compared to 3734 sliders before two strikes.  Archer has always relied heavily on the two strike slider to both lefties and righties.

This year, Archer has faced 134 lefties and struck out 23, just under 18%.  For his career, he strikes out lefties at a 25.3% rate. Strikeout rate stabilizes after about 70 batters faced, so clearly something is up with Chris archer when he faces lefties. Here was Chris last year against lefties, his best year striking them out.

And here is Archer this year.  Can you tell the difference?

No lefties are missing whiffing in the zone, or above it anymore.  While Archer doesn’t have the typical rise or spin rate of a high fastballer, he needs his second best pitch to generate some whiffs.  Archer has thrown 217 fastballs this year to lefties, 14 swinging strikes. No swinging strikes with 2 strikes. Archer has yet to strikeout a lefty with his fastball.  Now this in not a huge difference, as lefties struck out on his fastball just 14 times last year, with a 7.5% whiff rate on it.

The issue is not the fastball, but that lefties just aren’t missing his slider.  They know the slider is coming; it’s Archer’s put away pitch. And when he puts it right below the zone, it’s practically unhittable.  That’s what Archer wants to do, throw below the zone and back foot sliders to lefties. This year and last, Archer induced 147 swinging strikes to lefties on sliders below the zone, on 330 sliders, a whiff rate of 44%.  But when he throws the slider in the zone to lefties, it has a whiff rate of 10%, compared to 18% last year.

The reasons for Archer’s troubles against lefties may be explained in a great piece, http://theprocessreport.net/archers-struggles/, which  Jason Collette wrote for the Process Report.  

Archer has moved from the first base side of the rubber, last season on the left, to the third base side of the rubber, this year on the right.  How has he done with this so far?

His fastball has been failing against righties and lefties and his slider results are divergent.  

Pitchers don’t move where they stand for no reason.  Clearly, it makes it harder for righties to see the slider coming out of his hand, and they have a far worse angle on the pitch.  But, a slider is also a hard pitch to throw to a batter of opposite handedness, especially when you have to throw it for a strike.  When Archer’s slider is coming at an angle where lefties can read the spin even easier, they will miss a little bit less. For example, here is a slider in the zone to a lefty, and J.P. Crawford doesn’t miss.  

https://baseballsavant.mlb.com/videos?video_id=1938512583

Archer’s move from one side of the rubber isn’t easy.  He’s facing batters in a way that he’s likely never faced them before.  And this has resulted in some dramatic success against righties. But if he wants to throw fastballs or sliders in the zone to lefties, they just aren’t going to miss.  At this point in his career, Archer is hardly going to try to develop a great slider. It’s just not in his DNA. So, we know the results of Archer’s change, and he has to ask himself, what is the cost.


Marcell Ozuna has Changed, Again

Writing about Marcell Ozuna has become a sort of an annual early-summer tradition. Back in 2016 on May 20th, Craig Edwards wondered if Marcell Ozuna, then 25 years old, was breaking out. That hot streak didn’t last, as Ozuna saw his 132 wRC+ pre-Edwards article drop to 97 post-Edwards article.

Just over a year later in June of 2017, Craig revisited another Ozuna hot streak. That one lasted the rest of the season, and qualified as a breakout in most minds.

Now, nearly a year after that second article, some things have changed. Ozuna is no longer a Marlin. He’s a Cardinal! He’s the Cardinals cleanup hitter. And, through May 20th, Ozuna has been the St. Louis Cardinals worst hitter.

What?

Among the twelve Cardinals with at least 25 plate appearances so far, Ozuna’s 63 wRC+ ranks twelfth. Last. Worse than Matt Carpenter, whose recent hot streak lifted his mark from 60 to 89. Worse than Dexter Fowler. Worse than Francisco Pena. Last. Dead last.

Compounding the issue, or at least the prevalence of the issue, is that every single one of Ozuna’s plate appearances have come from the cleanup spot in the batting order. Individually, he’s been the second-worst cleanup hitter with at least 75 plate appearances in that spot. He’s dragged the Cardinals as a team down to the third-worst cleanup hitter production.

Of course, we know players go through slumps. Early season slumps tend to stick in our heads more because they’re more noticeable. Even still, this has been Ozuna’s third-worst slump of his career. He’s only had a powerless stretch this long once before. And yet, it doesn’t appear that the Cardinals have an alternative for his lineup spot.  Ozuna is, or was supposed to be, the Big Bat.

On the surface, it seems like there’s hope for a bounce back. While I haven’t been as adamant as I was for Carpenter, I’ve noticed plenty of bad luck plaguing the St. Louis slugger.

According to Baseball Savant, his average exit velocity is at a personal Statcast-era best of 92.6 mph, up nearly 2 mph over last year and in the top 30 across the MLB. His average launch angle is up a half degree from last year and in line with his career norms. And with the tenth worst gap between his expected wOBA and actual wOBA so far, we can attribute much of his slump to luck.

Luck doesn’t explain all of the difference between this year and last, though. Even if Ozuna’s actual wOBA was in line with his expected, he’d own a .339 wOBA and a wRC+ similar to that of Harrison Bader. Don’t get me wrong, a wRC+ around 115 is good – it’s 15% better than league average – but it’s not what we wanted from the Cardinals biggest offseason acquisition and it’s not what we expected from a guy who just least season broke out to mash 37 home runs while hitting .312 en route to a career best 142 wRC+.

Two paragraphs ago, I cited Ozuna’s average exit velocity and average launch angle. In my opinion, that’s the most common fallacy in the widespread use of Statcast data. Neither of those metrics are best thought of as averages. Ozuna’s average exit velocity is up, but what if he’s hitting every ball 92 mph or one ball 112 mph and another 72 mph? What if he’s hitting them into the ground where that exit velocity will do less damage?

To answer that, I compared Ozuna’s average exit velocity on line drives and fly balls to his exit velocity on grounders over the last three years. To tease out some luck, good or bad, impacting his production, I used expected wOBA instead of actual wOBA.

Image and video hosting by TinyPic

In 2016, Marcell Ozuna hit his line drives and fly balls only 2 mph harder than his grounders. In 2017, he sacrificed exit velocity on his ground balls to increase his exit velocity on line drives and fly balls. So far in 2018, he’s back to a near-even exit velocity between his grounders and line drives or flies.

Sometimes a gain in air ball exit velocity at the expense of ground ball exit velocity is indicative of an uppercut. Sometimes it might indicate a player has lowered their hands. Maybe they’re selecting better pitches to drive. Usually, it means a player’s swing is directed more ‘upward’ than it used to be.

On the other hand, when a player gains ground ball velocity as the expense of air ball velocity, the opposite is likely true. A swing that’s flatter or on a more downward plane will generate harder hit ground balls at the expense of harder hit line drives and fly balls.

Going off the above, it looks like Ozuna had a downward swing in 2016. It looks like he had a more upward swing in 2017. Now, it looks like Ozuna is back to a downward swing.

I went to the video room to see if I could identify any difference between Ozuna’s swing this year and last. While I couldn’t find anything noticeably different in the swing, there are significant differences in his set up and trigger. I’m going to show you two pitches. He didn’t swing at either. There are still big differences.

First, a take from 2018:

Next, one from 2017:

And here’s a still side-by-side of his stance, below.

Image and video hosting by TinyPic

Don’t make anything of the bat placement. He moves it around, and I didn’t take care to match that up. But look at his feet. His back foot is a little closer to the plate and his front foot is a little more towards third base. I don’t know how much of a difference that makes, and whether it’s good or bad. But it’s different.

Then there’s this:

Image and video hosting by TinyPic

Now that’s something. Ozuna has a toe tap. He had a toe tap last year, and he had one the year before that. Last year, after tapping his toe, his stance was slightly closed. This year, it’s dead straight. Last year, he had a bend in both legs during his tap. This year, his front leg is straight. Last year, his butt looks a little lower than this it does this year – he used to attack the ball from a slightly lower position. All together, in 2017,  Ozuna looked more like a tightly coiled spring. He was in a more powerful and explosive position.

Next, compare his 2016 toe tap (far right), when his air ball / ground ball exit velocity splits were nearly identical to what we’ve seen so far in 2018.

Image and video hosting by TinyPic

It’s not identical, but it’s really close. In 2016, Ozuna used a stiffer front leg. It looks like 2018 Ozuna, following his monster 2017 season, has gone back to his 2016, pre-breakout toe tap.

The obvious follow-up question: why? Why change what wasn’t broken? It hasn’t helped his plate discipline. It hasn’t improved his contact quality. It’s made him, essentially, the same hitter he was back in 2016. Was it a coach’s decision? Ozuna’s? An accident? In any case, despite breaking out in 2017, Marcell Ozuna isn’t the same hitter he was a year ago.

The St. Louis Cardinals, riddled thus far with injuries, are desperate for someone to step-up offensively.  They might start by taking a closer look at his toe tap.


Salvador Perez Has a Complicated Relationship With the Strike Zone

Between catching pitches for one of the worst pitching clubs in Baseball (The Royals have the worst team ERA in baseball), and being made a fool by Adeiny Hechavarria at the plate (5/14/18), Salvador Perez is having an embarrassing year. Yet below the obvious misfortune, a slow insidious killer lies. Salvador Perez seems to have forgotten about the strike zone.

In 2016 Salvador Perez won a Silver Slugger award. How can a relatively recent award winning catcher have forgotten about the strike zone? Well, the thing is, the strike zone and Ol’ Salvador have been in a tenuous relationship for a long time now. From 2016 to 2018, nobody in the MLB has swung at more outside pitches than Perez. Over the past 4 years, Perez has swung at 42.5%, 44.2%, 47.9% and 49.1% of pitches outside the strike zone (O-Swing%), respectively. All these percentages place him near the top of the leaderboards for each of these years. His contact rate on outside pitches during that time (O-Contact%) is 73.6%, 65.8%, 70.4%, and 63.1%, respectively. The nature of Perez’s efficacy on swinging for outside pitches is worth a deeper dive.

Does Perez benefit from his lack of plate discipline? In order to simplify the the study, I am going to only be looking at Salvador Perez in 2018 so far. Whether the lack of discipline worked for him in the distant past is not the focus, instead I am going to look at the efficacy of this kind of batting for Perez moving forward, using 2018 data to support my prediction. Perez’s season started April 24th due to a MCL tear. As of the end of play on 5/18, Perez has seen 333 pitches this year. Perez has swung at 56.4% of those pitches, meaning that he has swung at roughly 187 of all of the pitches he has seen this season. Of this 187 pitches swung at, Salvador Perez has swung at approximately 46 pitches outside the strike zone this season. One look at Perez’s Swing% heat map shows that he seems to believe that the strike zone is larger than it actually is.

Perez swings at a markedly higher percentage of pitches outside the strike zone than his contemporaries. Jorge Alfaro, and Wilson Ramos are the only two Catchers so far in 2018 that have swung at outside pitches at anything near the rate of Perez’s O-Swing of 49.1%, with the other catchers at a rate of 44.1% and 43.2% respectively, (Min PA 100). Perez has been a far better contributor to his team this season when he has shown more plate discipline. He has had a far inferior wOBA on days in which he has an O-Swing above 50%. His average wOBA on 50% O-Swing days is an abysmal .237, which is .067 less than league average for catchers and is .078 less than the overall league average. In comparison, on days in which Perez has an O-Swing% below 50, his wOBA is .440, a vast improvement, and a wOBA that puts him .04 above Mike Trout. If an outlier game against Detroit on May 5th in the below 50% dataset in where he had a wOBA of .000 is removed, his below 50% O-Swing wOBA would become .484, a number that would put him not far off the wOBA of Mookie Betts (.495). All this is to say that Perez is a very valuable hitter on the days in which he shows better, more league average (29.9% O-Swing) plate discipline.

What of the pitches that Perez swings on outside the strike zone, and actually makes contact? Perez boasts a 63.1 O-Contact%, which is the best contact percentage of Catchers (100 PA minimum) with above an 40% O-Swing. Are these contacts worth anything, or are they just mostly foul balls and popups? Perez has made contact with 22 pitches outside the strike zone. (There is a discrepancy of approximately 6 pitches here between the data supplied to FanGraphs, and the data supplied to BaseballSavant. I have decided that this slight difference does not compromise the integrity of the article, as my conclusions are the same. As such, some of the pitch numbers may be slightly off due to the slight difference between the O-Swing and O-contact% of FanGraphs and the statistical equivalent Chase and Chase Contact% of BaseballSavant, however the use of BaseballSavant was necessary for the exact pitch breakdowns.) Of these 22 pitches Perez has fouled off 13 of them, and has hit the other 8 chased pitches. Of these 8, he hit into an out in 7 of them, with the remaining contact being a single. So while Perez’s contact numbers while chasing are impressive, they amount to naught. Even with this high contact percentage the previous conclusion still stands, Perez is a bad hitter when he is in a chasing mood, and a very good one when he works the strike zone.

Is there something special about the 46 pitches that Perez chased outside the strike zone? (The data of both sites confirm that Perez has swung at 46 pitches outside the strike zone, so there is no problem here.) Is the number mostly made up of pitches that are right on the edge of the zone? The answer to both these questions is no. Perez has been lit up for a total of 19 swinging strikes to just the outside bottom-right of the Strike Zone alone. Meaning that of the 46 chased pitches so far this season, a staggering 41% of them have been swinging strikes to the outside bottom-right. The final tally of Perez’s adventures outside the strike zone sit at a pitiful, but not wholly unexpected, 24 Swinging Strikes, 14 Fouls, 7 hit into outs, and 1, lone, sad, pathetic, inconsequential, single.


In conclusion, Salvador Perez desperately needs to work on his plate discipline if he wants to continue to be a Major League catcher worth anything close to the $7.5M and $10M the Royals are paying him this year and the next. If Perez cannot reverse the negative course that his batting discipline has been on the last couple of years, his O-Swing% having jumped 4.9% in the past two years alone, he will begin to become an non-factor at the plate. Perez’s WAR has been in a steady decline ever since his O-Swing% began the leap to its current heights. If Salvador Perez cannot find more discipline at the plate, the former Silver Slugger will no longer be worth having on a Major League Team.

‘

(Data courtesy of Fangraphs and Baseballsavant)


An Early Look at Adam Duvall’s Struggles

Disclaimer: I started writing this post prior to Duvall’s on Friday night, right about the time he decided he was going to make me look silly. Stats do not include games on Monday 4/15.

A quick glance at the Reds offensive production so far in 2018 provides some context for a horrendous start.  Jumping down towards the bottom of stat sheet, we find 2016 All-Star Adam Duvall, who has been off to a terrible start at the plate. He leads the team in both home-runs and RBI (not saying much at this point) but has struggled to get much going other than that and currently owns a 59 wRC+. And that follows two strong performances since I started writing this, when he had a 29 wRC+. He is not the only reason the Reds offense is struggling , but he is among the biggest culprits.

Duvall’s calling card is no secret; he is a slugger. Over the 2016 and 2017 seasons, he ranks 15th in the MLB with an ISO of .244. He hits the ball harder than average and pulls the ball more than average. So while a high pull rate isn’t necessarily a bad thing, it is interesting that he is currently well above his own normal.

View post on imgur.com

League average is just under 40% while Duvall’s career average is just under 48%. So far in 2018 he is pulling almost 63% of balls, highest in the league among qualified hitters. Even for power hitters, there is an optimal amount of pulling the ball, and Duvall is way above it. Presumably, this is not something he is trying to do, but rather has been influenced in part by pitch location.

View post on imgur.com

Not surprisingly, the highest concentration of pitches Duvall saw in 2017 (left) were on the outside part of the plate as pitchers try to avoid playing to Duvall’s strength. In 2018 (right), he has seen a more even distribution of pitches across the strike zone. So if more balls are coming closer to where he can pull them, why is he not having success?

The easiest answer is that is has not been catching any breaks. While his BABIP as of Sunday night was a .156, it had been down to a .091 just a couple days earlier. The small sample of the young season shows how quickly a couple balls here or there can change things. Still though, a low BABIP indicates that there are better days ahead.

However, in addition to the high pull rate, other components of Duvall’s batted ball profile are not ideal. He is creating more soft contact than normal and is also hitting more groundballs than normal. It is not to a level he has not been before, but his soft contact was increasing in the latter half of 2017 and could be a larger trend. And the increase in ground balls has been accompanied by an all-time low line drive rate, which is generally the result of weak contact.

View post on imgur.com

Duvall has always gotten the ball in the air, as his career average 20.1-degree launch angle and 47% fly ball rate will attest to. So far this year, it has pretty much either been in the air or on the ground. And of the balls in play to the left side of the field this year, his launch angle is 4.6 degrees, compared to 9.8 degrees last year. Even though he has gotten pitches to the inside of the plate, he has not been able to drive them as he has in the past.

View post on imgur.com

Even with a high concentration of balls hit to 3B in 2017 (left), Duvall still made good use of left and center field. 2018 (right) has been way more concentrated to the infield, with very few balls going anywhere besides 3B or LF.

On top of his batted ball profile, plate discipline metrics also tell an interesting story.

View post on imgur.com

So far this year, 42% of pitches to Duvall have been in the strike zone, just below is career average of 43.4%. While that number may be a bit low, it is nothing compared to the drop off in Swing% which is 41.8% and well below his career average of 49%. Improving selectivity is something that players are always striving to do, so this makes sense, especially at the start of a new season. And while his BB% is slightly up, so is his K%, even despite a lower SwStrike%. Dvuall is taking too many pitches in the zone, most likely as he is not yet comfortable with his new approach. However, it could be an effect of not seeing the ball well out of the gate, which could also explain the weaker contact.

It is not like pitchers have figured out a magical way to always get Adam Duvall out. There is some variance at the pitch type level, specifically more sinkers and less four-seamers, but the overall breakout between hard, breaking and offspeed pitches is very much in line with what Duvall saw in 2016 and 2017. The only variation is with how Duvall has performed against the pitches.

View post on imgur.com

Higher whiffs per swing on breaking and offspeed pitches could be another indication that he is just not seeing the ball well at this point in the year. Even though he is swinging less and swinging and missing less overall, he is really struggling with non-fastballs.

Add it all up and Duvall is getting decent pitches to hit, but he is either taking them more so than before, swinging and missing on breaking/offspeed stuff, or swinging and not making solid, hard contact, leading to a lot of grounders to third base. Time will tell if he maintains and improves upon his newfound patience and starts connecting with and driving good pitches, utilizing the power that got him here.