Archive for Player Analysis

Let’s Project Three 2018 Breakout Players

The best thing about Spring Training statistics for fantasy owners is that you can spin them whichever way is convenient for you, the owner. If you’re heavily invested in a certain player who is struggling in Spring Training, you can always say “It’s only spring, these numbers don’t count!” Or, on the other hand, you can use a hot spring to justify reaching for a player who you believe will breakout. So yes, largely spring statistics are meaningless. Except, Jeff Zimmerman wrote an article earlier this year highlighting batted ball data to spot potential breakouts. With limited Statcast data provided at many Arizona and Florida ballparks, the ground out/fly out ratio may be the best indicator for hitters to spot those breakouts. Luckily MLB.com provides the GO/AO ratio for all spring statistics, so we can put Jeff Zimmerman’s hard work to use now that 2018 Spring Training is in the books. Let’s look at three players that look poised to breakout in 2018. I’ll write a part-two portion including three or four players who had previously broken out (relatively speaking) in 2017 but are projected to regress some by the masses.

Let’s start with Brandon Nimmo, the young outfielder for the Mets. Nimmo had a hot spring and with Michael Conforto starting the season on the DL, Nimmo got the nod to leadoff and play centerfield for Opening Day. Conforto is progressing much quicker than expected and should be back before the end of the month. halting Nimmo’s playing time. Thanks to the Mets signing on Adrian Gonzalez, effectively blocking Jay Bruce from moving from right field to first base, Nimmo is left without a spot. I won’t speculate on injuries (too much) but Yoenis Cespedes rarely plays a full season and I don’t expect Adrian Gonzalez to be at first base all season.

Back to Nimmo, he hit .306 with three home runs and whooping nine extra-base hits in Spring Training. In addition to all those loud numbers, his GO/AO ratio sits at 0.87 for the spring. For context, his minor league ratio is 1.32 and so far in limited major league experience (250 at-bats) it’s 1.12. Based on Zimmerman’s conversion table, we are looking at a ground ball rate of between 42% and 43%. Throughout his minor league career his ground ball rates have ranged between 45% to 56%, let’s call it 50%. That difference in groundball rate could mean an improvement in fly ball rate to near 40%. Nimmo has never been considered a power hitter but he’s been graded with a 50 in raw power, so a change in approach may unlock 20+ home runs. His previous career high is 12 in 2016, mostly in AAA and one at the major league level. His plate discipline is already fantastic evidenced by his incredible minor league walk rates. If he were to unlock average to above average power, Nimmo could become a Matt Carpenter-type leadoff hitter for years to come.

Steven Duggar is a name I haven’t seen on many people’s radar this offseason. He performed well this spring and has impressed the coaching staff of the Giants. But alas, he was Optioned to AAA to receive everyday at-bats. The Giants believe he is the centerfielder of the future and given the health track record of players like Hunter Pence and the mediocrity of Gregor Blanco, I wouldn’t be surprised to see Dugger by June (if not sooner). Duggar is a good athlete with a good hit tool and above average speed. His raw power is only graded out as average but I’ve noticed an approach change that began in High-A last year where he, like many others began elevating the ball more. He missed some time last year but also saw a solid HR/FB% at about 13% along with the increase in fly balls. This is a good sign. So let’s compare some numbers for Duggar.

In his first two seasons of minor league ball, his GO/AO ratio was 1.52 with fly ball rates typically below 30%. In 2017, again he dealt with injuries and only played in 42 games, but improved on his GO/AO ratio and fly ball rate to the tune of 0.82 and 43% respectively. This spring he’s continued elevating the baseball with a GO/AO ratio of 0.92 along with 4 home runs and six extra-base hits. His patience at the plate is incredible, much like Brandon Nimmo and his outfield defense is good enough to play centerfield for the Giants right now. He’s been a doubles machine in the minors and it’s possible those doubles start turning into home runs. I don’t see the upside in terms of home runs compared to Nimmo but I think Duggar can steal more bases, so both can be solid fantasy contributors, especially in OBP formats.

Based on all the hype in Ozzie Albies’ direction this offseason, you would be under the impression that he already broke out. However, he was only up with the Braves for all of 57 games and 244 plate appearances. In that short amount of time, he performed admirably with a triple slash line of .286/.354/.456 with six home runs and eight steals at the ripe age of 20 years old. Impressive to say the least, but before 2017 he had hit a total of eight home runs in 293 games. So, should we just chalk up the 15 he hit between AAA and the majors in 2017 to luck or an outlier?

How about neither, you know better than that! Ozzie was a ground ball machine in the minors which is typical for a speedster with 70-grade speed and five foot nine inch, 160-pound frame. Prior to 2017, Albies’ minor league GO/AO ratio was 1.5. Last year between AAA and the majors, it was 0.9 which matches his approach this spring at 0.85. Albies has hit over .300 with three homers and six extra-base hits this spring. I realize that Albies only played in 57 games in 2017 but I set some parameters for comparison sake to Ozzie Albies’ short time in the Majors, because why not? It’s fun. Take a look. Not bad, right? I set the walk rate above 8%, the K rate below 17%, the flyball rate above 39%, and the Hard contact above 33%. The player I want to highlight of this group is fellow five foot nine inch Mookie Betts. Let’s compare Mookie’s 200+ PA cameo at age 21 to Albies’ 200+ PA cameo last year.

Season Name Age PA BB% K% FB% IFFB% HR/FB Hard%
2014 Mookie Betts 21 213 9.90 14.60 38.60 11.50 8.20 35.80
2017 Ozzie Albies 20 244 8.60 14.80 40.30 1.40 8.20 33.20

I should point out that Betts didn’t strike out as much as Albies did in the minors but still impressive, to say the least. New SunTrust Park plays much better in terms of power for left-handed batters and yes, Albies is a switch hitter, but should bat from the left side at least 65% of the time. Hitting from the left side should help his power production. The infatuation with Albies continues to grow. If he builds on his success from 2017, there’s nothing in his batted ball profile that would prevent him from hitting 20+ home runs as he reaches his peak. The kid’s a star! I envision multiple seasons of 20 home runs and 30 steals with a great average for Albies.


What Would it Have Taken for Aaron Judge to be Clutch?

During one of my recent visits to the Fangraphs home page, while scrolling across the leaberboards, I was confronted by a fact I had once known but had long ago forgotten over this slow and tired off-season. Aaron Judge led the league in WAR! as a rookie?! and by quite a wide margin. That happened last season? Shoot just over a year ago Judge was still relatively unknown and Jeff Sullivan was telling us not to underestimate his power.

This realization conjured up memories of last season’s AL MVP vote, how one of Sabermetrics’ patron saints shook the foundations of Sabermetrics’ most prominent statistical achievement, and how article after article were written about clutch hitting.

This, in turn, reminded me of another leaderboard Judge topped last season, this one more dubious. He led (lagged?) the league with the lowest Clutch score. He was fourth in WPA/LI with 5.85 Wins, trailing only this generation’s Mickey Mantle, Judge’s clone, and some guy who plays for the Reds and just a fractional win behind the leader. In contrast, he ranked just 38th in WPA tied with some guy who used to play in Korea. Add this up and he had by far the lowest Clutch score at -3.64 wins, a full win lower than the rest of MLB save for one blue-eyed Cub.

Which led me to ask the question: What would Aaron Judge have had to do to be a clutch batter? And I don’t mean the obvious answer, “Hit better in high leverage situations“. Duh! He batted an astounding 190 wRC+ in low leverage situations to just a 107 in high leverage at bats. But that’s not the answer I was looking for. I wanted to know specifically, what would Aaron Judge have had to do to be a clutch batter? as in what could we change from his epic near MVP season to bring his Clutch stat into the positive?

So I set to find out.

Using Fangraph’s own Play Log, and with plenty of assistance from BaseballSavant.com and Statcast, I decided to play as one of the “Baseball Gods” and see if I could tweak a few of Judge’s plays to make him more clutch. As a “Fair and Just Baseball God” I wouldn’t be aiming to increase Judge’s overall stat line. If I nudge a groundball a little to turn an out into a single in a high leverage situation, I’d do the opposite in a low leverage situation (Judge had nearly 50 PA’s with a Leverage Index, LI, of effectively 0) nudging another grounder into a fielder’s glove for an out.

Thus his overall stat line and his WPA/LI would remain effectively the same, and since in those low leverage situations no (or nearly no) WPA was added, we’ll only be looking at how the play’s I change increase Judge’s WPA.(And I’ll only be going through the plays I add not the ones I’d need to take away.) I also won’t worry about any of the time traveler unintended consequences stuff, I’ll assume that only the single event changes without it affecting other plays in the same game or others. (I’ll let some of the other “Baseball Gods” worry about that stuff…)

Recall the Equation for Clutch:

Clutch = (WPA)/(pLI) – (WPA/LI)

With my rule that Judge’s pLI (0.95) and WPA/LI (5.85) will remain fixed we are just looking to increase Judge’s WPA.

With that lengthy explanation out of the way, let’s begin!:

Judge Initial WPA = 2.10
_________________________________________________________
Situation #1:

July 27th, Bottom 9, 1 Out, Runner on Third, Yankees down 1.
LI = 5.81 – Actual Play – Judge Fly’s Out to Right. – WPA = -.252

We’ll start with a big one, in fact Judge’s second highest leverage play of his season!
With a chance to tie the game in the 9th, Judge just miss-hits the ball sending it not quite far enough to allow the speedy Brett Gardner to score from third. As you can see, similar hit balls all had the same result:

”7/27/2017”
But as my first act as “Baseball God” I’m gonna adjust this hit ever so slightly, notching Judge’s bat up a millimeter to two to lower the Launch Angle of this hit and allow it to carry just a bit further. Something more like this:

”7/27/2017_Alt”
That should be far enough out to score Gardner giving Judge a Sac Fly.

New Play – Sac Fly – New WPA = .112 – Net WPA Change = .364

Judge’s New WPA = 2.46
_________________________________________________________
Situation #2:

August 2nd, Bottom 8, No Outs, Runner on Second, Yankees down 2.
LI = 2.72 – Actual Play – Strike out swinging. – WPA = -.08

Sometimes the job of a “Baseball God” is rather easy. In this case I’ll just need to do some umpire convincing. In this at bat Judge struck out on a 3-2 slider, but earlier in the at bat, after three wild pitches, here was the 3-0 offering from Bruce Rondon:

”8/2/2017”

Ok, sure, most umpires probably call this a strike on a 3-0 count, but I’m gonna go ahead and give this one to Judge. Ball Four!

New Play – Walk – New WPA = .087 – Net WPA Change = .167

Judge’s New WPA = 2.63
_________________________________________________________
Situation #3:

September 19th, Bottom 2, 2 Outs, Runners on Second and Third, Tie Game.
LI = 2.03 – Actual Play – Fly out to Center. – WPA = -.061

Judge crushed a Jose Berrios offering at 107 MPH:

Here’s what it looked like.

He was just a little under this one, wouldn’t take much more to send this ball out. So we’ll make the charge and turn this loud out into a bomb.

New Play – Three Run Home Run – New WPA = .249 – Net WPA Change = .310

Judge’s New WPA = 2.94
_________________________________________________________
Situation #4:

September 9th, Top 9, No Outs, Runner on First, Tie Game.
LI = 3.40 – Actual Play – Fielder’s Choice to third, out at second. – WPA = -.084

Judge grounds one to third, and nearly into a double play.
Here’s what it looked like.

Thing is, Rougned “De La Hoya” Odor is in such a hurry to turn two that it almost looks like he jumps off Second too early. Take a closer look:

”8/2/2017”

Your guess is as good as mine, but here’s the thing: As a “Baseball God“, I don’t have to guess. I’ll just make the throw from third just a little higher and wider pulling Odor off the bag and leaving both runners safe on a throwing error. Did you know that errors count as positive WPA plays?!

New Play – Reach on Error, Throwing Error at Third, Runners safe at First and Second – New WPA = .109 – Net WPA Change = .193

Judge’s New WPA = 3.13
_________________________________________________________
Situation #5:

August 18th, Top 6, 2 Outs, Bases Loaded, Yankees down 1.
LI = 4.52 – Actual Play – Ground Out to Shortstop. – WPA = -.119

Judge hits a sharp ground ball at 103 MPH.

Here’s what it looked like.

Hit hard, but right into Xander Bogaerts‘ glove for a routine out. But per Statcast balls hit at that Velocity and at that Launch Angle become hits about half the time.

One can imagine Judge hitting this ball just a little closer to the pitcher’s mound, and seeing it get past a diving Bogaerts. With the runners going, that hit would easily score 2.

New Play – Ground Ball Single up the Middle Scoring 2, – New WPA = .275 – Net WPA Change = .394

Judge’s New WPA = 3.53
_________________________________________________________
Situation #6:

June 14th, Top 7, No Outs, Runners on First and Second, Tie game
LI = 2.89 – Actual Play – Fly Out to Left. – WPA = -.085

Judge ropes one into left field, where Eric Young Jr. makes an awkward dive for it.

Here’s what it looked like.

Young makes the out, but just barely. Imagine if his dive is just a little more awkward… That ball probably gets by him and clears the bases.

New Play – Bases Clearing Double to Left Field – New WPA = .219 – Net WPA Change = .304

Judge’s New WPA = 3.83
_________________________________________________________
Situation #7:

June 15th, Top 9, No Outs, Bases Empty, Yankees down 1.
LI = 2.88 – Actual Play – Strike Out Looking. – WPA = -.073

Were picking up steam now! And as a “Baseball God” I haven’t had to work very hard changing these last few plays. Now it’s time to work just a little harder.

Leading off a do or die ninth, Judge took three easy balls, then saw and fouled consecutive fast balls. This set up a full count pitch where Santiago Casilla froze him with a beautiful knuckle curve. Here’s what it looked like.

”6/15/2017”
No doubt that’s a beautiful pitch. But guess what? Umpires sometimes miss calls, especially when they get some inadvertant dust in their eye…

New Play – Walk – New WPA = .110 – Net WPA Change = .183

Judge’s New WPA = 4.02
_________________________________________________________
Situation #8:

September 10th, Top 3, 1 Out, Bases Loaded
LI = 2.26 – Actual Play – Sac Fly to Right. – WPA = -.002

In an RBI situation, Judge blasts one.

Here’s what it looked like.

So Judge clearly gets under this pitch… but he still hit it over 300′ and scores a run.
The thing is the next two times up he did this and this!
I’m just gonna do a little rearranging on when these homers take place…

New Play – Grand Slam to Right – New WPA = .256 – Net WPA Change = .258

Judge’s New WPA = 4.27
_________________________________________________________
Situation #9:

April 18th, Bottom 9, 2 Outs, Bases Loaded, Yankees Down 3
LI = 3.86 – Actual Play – Fielder’s Choice to Shortstop, Out at Second. – WPA = -.100

Judge ends the game on a weakly hit grounder to shortstop.

Here’s what it looked like.

Looks like a routine grounder, but per Statcast similar balls become hits about a third of the time. And we don’t really need a hit here, Tim Anderson looks a little shaky fielding the grounder as it hops to his glove. In a critical situation like this who’s to say he doesn’t boot one? The answer is me, the “Baseball God“. I say he boots it…

New Play – Fielding Error at Shortstop, 1 Run Scores – New WPA = .090 – Net WPA Change = .190

Judge’s New WPA = 4.46
_________________________________________________________
Situation #10:

July 21st, Top 3, 1 Out, Runners on First and Third, Tie Game
LI = 2.12 – Actual Play – Sac Fly to Center. – WPA = +.016

Another well struck ball that just stays in the yard for a sac fly.

Here’s what it looked like.

But Judge would get one more try at Andrew Moore that game, and you may remember it. Judge’s next at bat was that time he broke Statcast!

I’m just gonna move that Statcast breaking smash up one AB if you don’t mind…

New Play – Three Run Home Run – New WPA = .216 – Net WPA Change = .200

Judge’s New WPA = 4.66
_________________________________________________________
Ok, awesome we’re 10 plays in, and as a “Baseball God” I don’t feel like I’ve had to work all that hard. But were still only at 4.66 WPA, nearly a win short of our target. It’s time to pull out the big guns. It’s time to perform a MIRACLE!

Situation #11:

July 30th, Bottom 9, 1 Out, Runners on First and Second, Yankees down 2.
LI = 4.78 – Actual Play – Foul out to First. – WPA = -.112

Representing the go ahead run, Judge pops up in foul ground to the first baseman. You can see his hit in blue in the image below.

”7/30/2017”
(As to why this shows up as a -57° LA I think sometimes Miracle Work messes with Statcast…)

Just a lazy pop-up. Not much a “Baseball God” can do to affect this play without revealing myself to the world. So I’ll just void the play and blows this ball a little further to the right and into the seats where Trevor Plouffe can’t catch it!

So I’ve just given Judge a new lease on this particular at-bat. I hope he uses it wisely. I’ll just assume it goes something like this!

New Play – Walk Off Three-Run Home Run – New WPA = .793 – Net WPA Change = .905

What?! You don’t think that’s fair. Tough! I am Beerpope the Baseball God and this is my Miracle, don’t tell me what’s fair!

Judge’s New WPA = 5.57

And with that spectacular finish, we check Judge’s Clutch score:

5.57 / 0.95 – 5.85 = +.01 Wins

And there you have it. Aaron Judge – CLUTCH BATTER. My work here is done.

So what does this all mean? Really I’m not sure. Does the fact that it took 10 twists of fate and one walk-off miracle just to bring Judge barely into the positive show just how deeply un-clutch he was last season? Maybe. But it may also show us how futile it is to focus of how clutch or un-clutch a batter is if an ump call, miss hit, or bounce here or there in just 10 at bats can invalidate the other 600 plus plate appearances in a player’s season.

I’ll leave that determination to the readers.

Now enough with the 2017 Season. It’s time for me to begin contemplating what Miracles to perform thus upcoming season…

Cheers!


Dansby Swanson’s Adjustment, Into the Rabbit Hole

(Editor’s note: this post was submitted prior to the start of the season but it seems rather timely now)

I can’t shake myself from latching onto spring training hype trains. Even after all we’re taught about small sample sizes, I find myself watching games and wondering whether this could be the year for any number of players.

Watching the Braves and the Nationals last weekend, something about Dansby Swanson seemed different. I started digging and emerged on the other end of a rabbit hole that brought me from hitting guru Jason Ochart (@Jason_cOchart) to Coach Bobby Stevens Jr. (@StevieBobbins, BattersBoxChicago.com, GoWindyCityBaseball.com) to gif-ing up everything and more.

I’ll admit, I forgot Dansby Swanson was sent to the minor leagues in late July. The former number one pick relinquished his major league role after mustering only a .287 OBP in just under 400 plate appearances. Two weeks later he was recalled with little more than generalities to sift through in hopes of unearthing what the Braves wanted to change mechanically if anything at all.

After Swanson’s return to the major leagues tinkering began.

Video via MLB.com – 1, 2

It’s a relatively simple adjustment, but the ramifications and reasoning behind the alteration bubbles numerous points to the surface.

“Getting [your front foot] down too early can mess up timing and alter the kinematic sequencing of the swing.” Jason Ochart quickly summed up via Twitter what I speculated might be true.

For almost all of Swanson’s 2017, before his change in late August, his front foot was down earlier than your standard hitter (in the video on the left above).

“For most hitters, the pressure shifting onto the front foot is what initiates their swing. Force plate data shows that the forceful heel drop works as the trigger of the swing and works as a brake to send energy upward through the body… to accelerate the bat late in the swing arc, as all the best hitters do.”

Breaking down Orchart’s points make a complex explanation simple. A hitter’s front foot is used to initiate their swing. When this foot plants, it helps transfer energy from one’s lower body to upper body. Eventually, that energy affects a hitter’s bat.

“Force plate data” sounds complex, but it’s nothing more than a plate on the ground that measures exerted force. In this case, the force from a hitter’s front foot. (YouTube is always here to help as well).

Ochart went on to state research shows that shorter time between the peak of one’s front-foot force and contact with the baseball can lead to greater exit velocity. If your front foot peaks early, as a hitter’s might if they’re planting as early as Swanson was, the effects could be detrimental on the one variable most hitters are focused on.

Stats, however, have a tough time backing up a substantial performance boost solely through the hovering of Swanson’s front foot.

Upon Swanson’s return to the majors in August, there was a strong uptick productivity that lasted until the beginning of September. This correlates nicely with his front-foot alteration but doesn’t sustain through the end of the season, as one would hope a material adjustment would. A variety of other factors could counter the change: production uptick being artificial, fatigue, comfort with the new approach, etc.

But what about other components of Swanson’s swing that might have been affected by this change?

“Hitting is controlled all through the back hip in relation to controlling your weight and ‘staying back’ on pitches. The issue is in the explanation of ‘stay back’. Stay back in what position? With your foot off of the ground? With your front foot on the ground? In your stance? That is where understanding is lost in my opinion.” Stevens took a different route to a similar conclusion that buoys the case Swanson had beneficial intentions, even if stats cloud improvement.

“A hitter must ‘stay back’ in their hip with their foot off the ground or hovering. This does not mean that you lift the front foot off the ground and balance on your back leg, though. It means that we load or coil into our back hip, then as our lead leg begins to stride out towards the pitcher, we want to ‘stretch’, or use our back muscles, to hold our weight back until we decide it is time to launch the swing.”

Stevens’ broadening of terminology related to “staying back” unearths numerous other factors related to what Swanson did. Each of his points made me consider other aspects of Swanson’s kinetic chain, particularly how the most visible change – foot down early to hover – could be covering up other, more important changes to help the former college star, acting as the low-hanging fruit.

So why bring this front-foot change up now, six months late? Because Swanson’s lower body alteration was actually the second thing I noticed, behind another change that caught my eye on his long home run off Max Scherzer in spring’s first weekend of action.

Video via MLB.com – 1, 2

First his lower body, now his upper body. While the above camera perspective when comparing is slightly askew thanks to spring training parks and their uniqueness, Swanson is starting his hands lower and bringing them up into his load. In 2017, he started his hands higher and kept them there for the duration of his pre-swing rhythm. Now, his momentum is built up into the hitting position, yet the path and aesthetic of his swing after his load are nearly identical to the naked eye. This feels like a conscious attempt at relaxation in the box, with the foresight to alter the path to his load as opposed to how exactly he is loading. What could be invisible, however, to my untrained scouting eyes are the concepts Stevens talked about above relating to a hitter’s back hip and launch into his swing.

Swanson’s adjustment is similar in direction to Zack Cozart’s alteration from 2016 to 2017, one that brought Cozart a substantial uptick in power. Some might say Billy Eppler’s new third baseman’s breakout came demonstrably because of health, but Cozart admitted last Spring he wanted to start his bat on his shoulder to relax himself at the plate and come up into the hitting position. What Swanson is doing above mimics that concept – coming up into his load – even if the point at which the process begins is different. Swanson’s relaxation also reminds me of Anthony Rendon’s gradual adjustment, as the All-Star began to push his hands further south when comparing his swing at Rice University to that of later in his career.

Most relevant to my gracious sources, Ochart and Stevens, Swanson retains his front-foot hover from late in 2017 in the gif above.

While the stats seem doubtful a tangible change in the Braves shortstop, numbers can often be blind to progression mechanically that hasn’t manifested on the spectrum of production. My confidence in an improved Swanson is driven by the theory around adjustments he seems to have made, starting with the hover of his front foot to the repositioning of his hands preload. Add him to the list of players I’ll be watching closely in one month’s time.

A version of this column can be found on BigThreeSports.com.

You should do that thing where you follow me on Twitter – @LanceBrozdow.


Reason For Optimism For… Matt Davidson?

Matt Davidson was not good last year. He got 443 plate appearances in his first full MLB year on a rebuilding White Sox club, and it didn’t go well as he posted a WAR of -0.9. That mark was seventh-worse in MLB for position players with at least 400 PA. There’s little mystery how he got there, as he combined DH-only caliber defense with a paltry 83 wRC+.

Davidson achieved that uninspiring number by hitting like a three-true-outcomes guy without the walks, more or less a poor man’s Chris Carter. Good news first: last year, he ran a pretty decent ISO of .232, putting him close to good-to-great hitters like Francisco Lindor, Anthony Rendon, and Anthony Rizzo, cracking 26 homers along the way. His raw strength is very real: he blasted a tape-measure 476-foot moonshot out of Wrigley with a 111MPH exit velocity in July. Big power is a good trait to have, but it’s been devalued in today’s game, where guys like Carter and Logan Morrison can hit 35+ homers in a year and then can’t find contracts of even $5M the following offseason.

Still, significant pop is necessary for a high offensive ceiling, so what’s holding Davidson back? In a word, strikeouts. He struck out a horrifying 37.2% of the time in 2017, second-most in the majors.  Unsurprisingly, his whiff rate was a scary 16.3%, sixth-highest among his peers; for reference, that’s identical to how often hitters swung and missed against Andrew Miller last year. The walk rate that keeps most K-prone sluggers’ OBP somewhat afloat wasn’t in evidence, as Davidson walked only 4.3% of the time. You won’t be shocked to find that he finished second-worst in K/BB with an ugly 0.12. Although he did hit the ball hard (we’ll come back to that), his flyball-heavy batted ball profile and below-average speed kept his BABIP suppressed to .285. That mark was in close agreement with his xBABIP of .283.

The astronomical K% and below-average BABIP held him to an ugly .220 AVG, which combined with the poor BB% led to a truly abysmal OBP of .260, second-worst among hitters with 400+ PAs. The only guy worse in that column was Rougned Odor, who has a similar offensive profile, but at least he can partially blame a particularly unlucky .224 BABIP.

Looking at last year’s stats, there appears to be approximately zero reason for optimism for Matt Davidson. He hit for power well, but was near the top of all the peripheral leaderboards that you really don’t want to be at the top of.  So why is this post being written at all? In short, Davidson seems to have turned over a new leaf this spring.

Now, I know the sabermetric kneejerk reaction to that last sentence: spring training means nothing and spring training stats mean less than that. But that’s not entirely true, as this excellent piece in the Economist way back in 2015 details. If you don’t want to read the whole piece, that’s fine, because it can be summed up very briefly: a hitter’s strikeout rate in spring training actually has a pretty high correlation with their strikeout rate in the regular season. Of course, one of the chief objections to drawing conclusions from spring training stats is the tiny sample sizes with which we’re working. Fortunately, strikeout rate is one of the fastest-stabilizing peripheral rates there is; Fangraphs itself puts the threshold for stabilization of strikeout rate at about 60 PA.

That piece was linked somewhere recently and I read it for the first time. A couple days later, being entirely starved for any form of baseball through this long winter, I reached the rock bottom of scouring the spring training stats of the team I supported, the White Sox. To my own surprise, there was actually something interesting buried there; as you might guess, it was in Matt Davidson’s stat line.

Luckily for us, and this piece, Davidson’s played the most of any White Sox this spring, totaling 60 PA as of March 20. He’s struck out twelve times, a K rate of 20%. He has walked seven times, for a walk rate of 11.7%. In this small sample, he’s almost halved his strikeout rate and nearly tripled his walk rate from 2017. On the one hand, that sounds like an insane improvement that cannot possibly be maintained; on the other, those rates from spring training are by themselves quite unremarkable for a major league hitter. Using BBRef’s summed 2017 stats to calculate league-wide rates, 20% K and 11% BB would have both been slightly better than average league-wide in 2017.

A significant walk rate improvement wouldn’t actually be terribly surprising. If you peruse Davidson’s player page, you’ll find that before last year he never posted a BB% worse than 9.1%, ranging up to 12.0%, from Double-A onwards, a total of five seasons spent mostly at Triple-A plus a month in the majors with Arizona. His walk rate at least doubling this coming year wouldn’t be coming out of left field; rather, it would be him returning to the player he has been in that sense for pretty much his entire professional career minus last year. It will probably come down from 11.7%, given that MLB pitchers likely have better control than those he’s faced this spring, but still, a big jump in walk rate seems likely for him this year.

That strikeout rate is a different animal, though. He’s always struck out a lot, never posting a K rate below 20% at any stop in the minors, and the whiff rate mentioned previously supports that. On the other hand, the sample size is now at the point where this being a complete fluke is pretty unlikely. Is this a real improvement or a mirage? I don’t know, and we don’t have plate discipline numbers in ST to see underlying patterns, but according to Davidson himself, making more contact is exactly what he’s trying to do. It sure seems like he’s succeeding in that thus far. As another small data point, he doesn’t seem to have a pattern of ST flukes in K rate, as in 58 PAs during last year’s spring training he struck out in 37.8% of his plate appearances, a number that echoes his full-season 37.2%.

This wouldn’t be as interesting a case if Davidson did nothing well offensively. He’s a large and very strong man, which is why he hasn’t just been released by the White Sox years ago. Take a look at his contact profile. Basically, last year, he pulled balls, hit more fly balls than ground balls, and vaporized balls in to play, with a quality-of-contact triple-slash line of 15.7% Soft/46.1% Med/38.2% Hard. His HR/FB% was a robust 22.0%, rubbing statistical shoulders with established sluggers like Nelson Cruz and Edwin Encarnacion. In short, when he actually did hit the ball, he looked for all in the world like a poster child for the fly ball revolution. Those underlying numbers hint at a lot more offensive potential than anyone outside of the White Sox organization sees in him, if he could just reduce that giant 32.9 K-BB%.

Now he’s showing signs of significant improvement in that fatal flaw of plate discipline. It doesn’t seem like the improvement in K% and BB% thus far in spring training has cost him much in power, considering that he’s demolished ST pitching to the tune of .358/.433/.679 (1.113 OPS & .321 ISO). Obviously, he’s not going to keep hitting quite that well, but the still-rebuilding White Sox aren’t about to outright bench or demote him either. Maybe it’s all a lot of noise, and he’ll be bad again this year. Or maybe Matt Davidson, at the age of 26, is about to be the Next Big Breakout™. Just as a reminder, it took J.D. Martinez until 26 to figure it out and become the “King Kong of Slug”; Justin Turner was 29-year-old replacement-level utility infielder who suddenly blossomed offensively in 2014; Jose Bautista was almost 30 before he turned into a nightmare for AL pitchers in 2010. So, here’s an prediction I would have laughed off for 2018: Matt Davidson is about to bust out in a big way.


UPDATE 3/29: Davidson hit three homers on a cold day in Kauffman Stadium, every single one of them with a 114+ MPH exit velocity. He also walked and did not strike out. Jump on the bandwagon now while there’s still room.


Nate Pearson’s Pitching Coach on Grunting, Routines, and Hard Changeups

Fluctuation of prospect value during the offseason is a mental exercise. Given the lack of activity to substantiate one’s changing opinion, hype can often be attributed to reputable names in the industry praising players, or the release of top prospect lists into the wild. Nate Pearson’s name has generated helium in the recent months, but instead of dismissing a storyline and citing our historically slow offseason for the surfacing of this hype, I wanted to understand the origin of praise surrounding our budding prospect.

Jim Czajkowski, the Vancouver Canadians pitching coach helped put into perspective how bullish the Blue Jays organization is on their first-round pick from 2017’s draft. Pearson carries a 6-foot-6, 240-pound frame onto the mound, his arm balancing out the offensive firepower Bo Bichette and Vladimir Guerrero Jr. bring to a system loaded with top-end talent.

Having groomed the likes of Aaron Sanchez, Marcus Stroman, and Noah Syndergaard, Czajkowski’s reps with advanced skill sets and assessment of their potential needs no introduction.

“[Nate] is better at his age than any of those guys were…. If I were to rank those guys, Sanchez probably had the best pure arm action and a good curveball, a good sinking fastball too, but Nate has all four [pitches].”

Pearson transferred from Florida International University (FIU) to Central Florida Junior College for the 2017 season for personal development reasons, and the gamble paid off as he posted 118 strikeouts in 81 innings with only 23 walks. Even with his stellar stats, one could assume Pearson may have been passed on last June due to his size.

“It’s a chunky 240 [pounds]. And in high school he was up to 300… he’s thinned down some… It was definitely his workout regiment; it was phenomenal.”

As his time at FIU was largely in a relief role, it was inevitable that discussion arose between Czajkowski and myself regarding how to condition the 6-foot-6 righty to shoulder a progressively larger workload. The focus was more on optimization – the sequencing of Pearson’s innings and coinciding off days – than sheer control of inning quantity.

“He probably pitched once a week [in college], and then he’d have six days to recover… we got him down to one less [recovery] day in Vancouver, and then wherever he goes next year, he’s going to be on a five-man rotation, so he’ll really need to adjust his regiment and take care of his arm care.”

Preparation for the next level is front of mind for Czajkowski and the Blue Jays. Focusing on routine and laying the groundwork to ease Pearson’s adaptation to higher levels lead to necessary and subtle tweaking.

“When we talked to him about his routine, we actually thought he might be overdoing it right after the game with his arm care. We wanted him to tone it down a little bit.”

This restructuring of Pearson’s off-day regiment and arm care was not suggested to his detriment. It became a vital step to eventually ease him into Lansing or Dunedin’s standard, five-man rotation, dealing with less off days in the process.

While any arm possesses the inherent risk of injury, Czajkowski admitted that himself and management are more optimistic with Pearson’s arm health knowing the primary generator of velocity comes from his lower half.

Adding audible intimidation to Pearson’s presence on the mound is a less statistical reason hitters struggled mightily against his offerings.

“There is not a lot of herky-jerky in [Pearson’s] motion, there are times where he pitches and he’ll grunt. And when he does that, he throws 100 [mph]. There are times early in counts where he grunts because he’s trying to make a statement, and he’ll overthrow a couple pitches… he was almost trying to strike guys out early in counts; trying to not let them touch the ball, that’s when he would lose a little bit of command and come out of his delivery a little bit.”

Pearson’s delivery is unique. His 6-foot-6 frame barrels downhill towards a hitter, as the harmony of his kinetic chain capitalizes on the energy stored in his lower half. A strong front leg allows him to stabilize after the energy released from his torso’s aggressive tilt forward finishes his motion. Exceptional is an understatement when describing the extension he achieves; the eye is tricked for seconds as one forgets the amount of mass supporting the big righty.

(Gif from YouTube, video credit to Niall O’Donohoe)

“If you watch him play long toss you know where he gets his power; his power is from his legs.” Czajkowski was quick to confirm what is visually consistent.

Pearson’s work ethic and natural ability, continually touted by Czajkowski in our talk, remain one reason why concerns over inconsistency fell to a simmer from the boil that eclipsed his potential pre-draft. An unusual detriment associated with this level of velocity is how advanced it can be for the pitcher’s level.

“At the lower levels they can’t catch up to his 100[-mph fastball]… The higher Nate goes, to Double-A and Triple-A, his changeup will be able to play because those guys will be able to catch up to his 100.”

Velocity differential between a pitcher’s fastball and changeup remains one of the key factors to predicting the value of the feel-dominant pitch and whether it behaves like a sinker, generating ground balls, or a true changeup, generating whiffs. While Czajkowski rated each of Pearson’s four pitches – fastball, slider, changeup, and curveball – above average, he was quick to disclose his high expectations for a pitch that was hit around for Pearson in his 19 innings with Vancouver.

Pearson’s arm speed is another reason why I’m bullish on his changeup. His body’s aggressive motion towards the plate can deceive hitters from an aesthetic standpoint. Add that to the fade he’ll be able to generate as he evelates his feel for a pitch and his mastery will quickly exceed the talents of his seniors.

But Pearson’s calling card is a two-plane slider; an unfair pitch when backed up with his command. He seamlessly changes the eye level against hitters, leaving most Class A Short Season hitters to guess if they stand a chance of hitting either pitch. The offering below is at this hitter’s belt, which gives a better idea of the pitch’s depth, rather than the late, “fall off the table” break noticeable when he buries the pitch at a hitter’s knees.

(GIF via YouTube, video credit to Blue Jays Prospects)

Is there a point where overuse of such an advanced pitch could hurt a young arm?

“If we think he is overusing his slider, just for strikeouts, we’ll talk about the percentage he throws his pitches. [Nate] gets a breakdown… and I think he did a very nice job this year in utilizing everything.”

Czajkowski reiterated the themes of our talk, bringing up a final thought that adds to his appreciation for the righty.

“He has four major league quality pitches, he has size, but the one thing he doesn’t have yet is stamina. He hasn’t built up the innings to be a starter at the major league level. Roberto Osuna pitched a couple years in the minor leagues as a starter and then became a reliever. So Nate Pearson as a closer at the major league level, I can see that too. Because of his regiment; the way that he throws, and the way that he bounces back tells me that he can handle a relief role, too.”

If the Blue Jays window of contention opens quicker than some anticipate, Pearson’s services may be needed at the major league level sooner than later. With Czajkowski’s suggestion that Pearson could reach Double-A New Hampshire by season’s end if the stars align, opportunity for Pearson to make an impact in 2019 isn’t off the table. His adaptation to higher levels and a five-man rotation are what I consider the largest factors dictating his future role.

Czajkowski’s final words to me on the record epitomize what we’re all thinking about Pearson.

“The sky is the limit for him.”

Special thanks to Jim Czajkowski for allowing me to steal some of his vacation time to chat Canadians baseball and Pearson. I wish the Blue Jays organization, and each pitcher he grooms, the best in the coming season.

I can be found on Twitter – @LanceBrozdow

A version of this post can be found on BigThreeSports.com


Temporarily Replacement-Level Pitchers and Future Performance

As I’d like to think I’m an aspiring sabermetrician, or saberist (as Mr. Tango uses), I decided to test my skills and explore this research question. How did starters, who had 25 or more starts in one season and an ERA of 6.00 or higher in their final 10 starts, perform in the following season? This explores whether past performance, regardless of intermediary performance, adequately predicts future performance. Mr. Tango proposed this question as a way to explore the concept of replacement level. From his blog: “These are players who are good enough to ride the bench, but lose some talent, or run into enough bad luck that you drop below ‘the [replacement level] line’.” Do these players bounce back to their previous levels of performance, or are they “replacement level” in perpetuity?

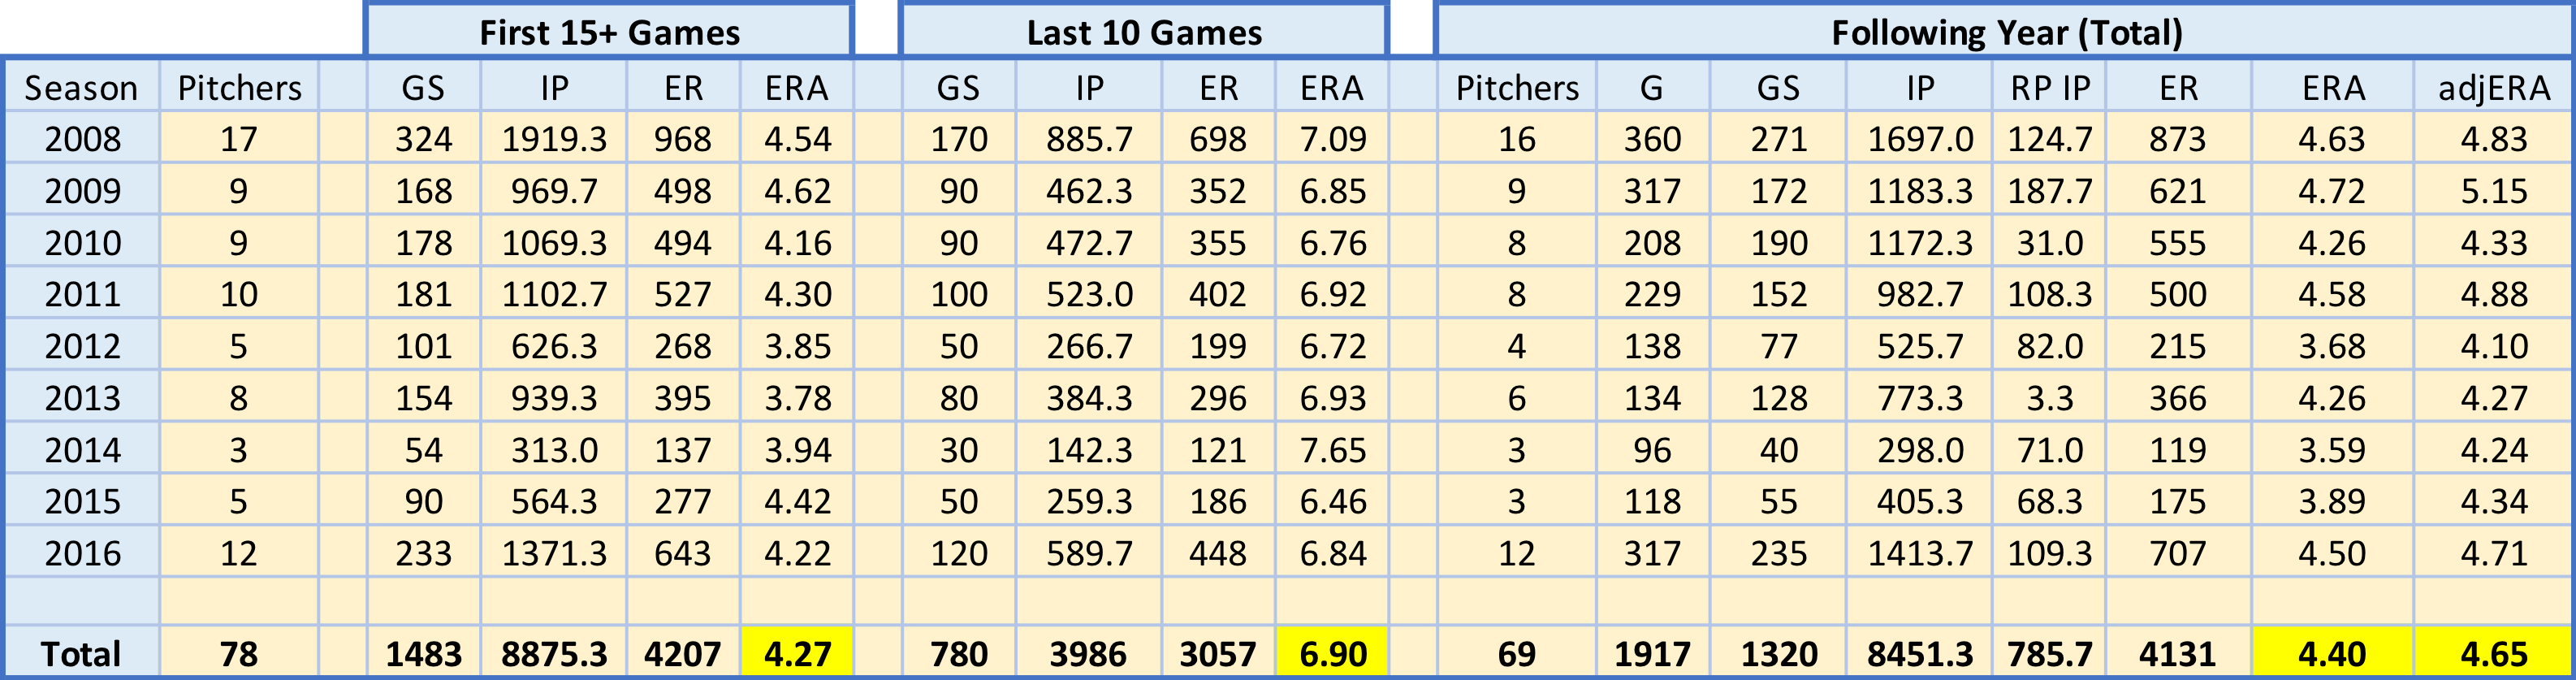
To explore this, I gathered game-level performance data for all starters from 2008 through 2017 from FanGraphs, grouped by season. I then filtered out pitchers who had fewer than 25 starts and had an ERA less than 6.00 in their final 10 starts. This left me with a sample of 78 starters from 2008 through 2016 (excluding 2017 as there is no next year data yet). I assumed that a starter with an ERA above 6.00 was at or below replacement level. Lastly, as some starters were converted to relievers in the following year, I adjusted the following year ERA according (assuming relievers average .7 runs over nine innings less than starters: see this thread).

final10.png

Seems like the 10-game stretch to end each season is a bit of an aberration. The following year’s adjusted ERA is much closer to the first 15+ games than the final 10 games for pitchers in our sample. In fact, the largest difference between any first 15+ game ERA and its following year adjusted ERA is .58 runs, in 2011. The smallest difference between any last 10 games ERA and its following year adjusted ERA counterpart, for comparison, is 1.7 runs, in 2009.

Using adjusted ERA corrects for the potential slight downward bias in our following year totals. Following year games started fell by ~9%, while reliever innings increased from zero to each season’s value. Relievers, on average, have a lower ERA than starters. As mentioned above, I adjusted each season’s following year ERA by .3 runs per reliever inning pitched (my assumed difference in runs allowed between starters and relievers per inning pitched). Another source for potential downward bias is sample size – of the 78 pitchers who fit our sample qualifications, only 69 pitched in the majors the following season. A survivor bias could exist in that the better pitchers in the sample stayed pitching, while the worse pitchers weren’t signed by a team, took a season off or retired.

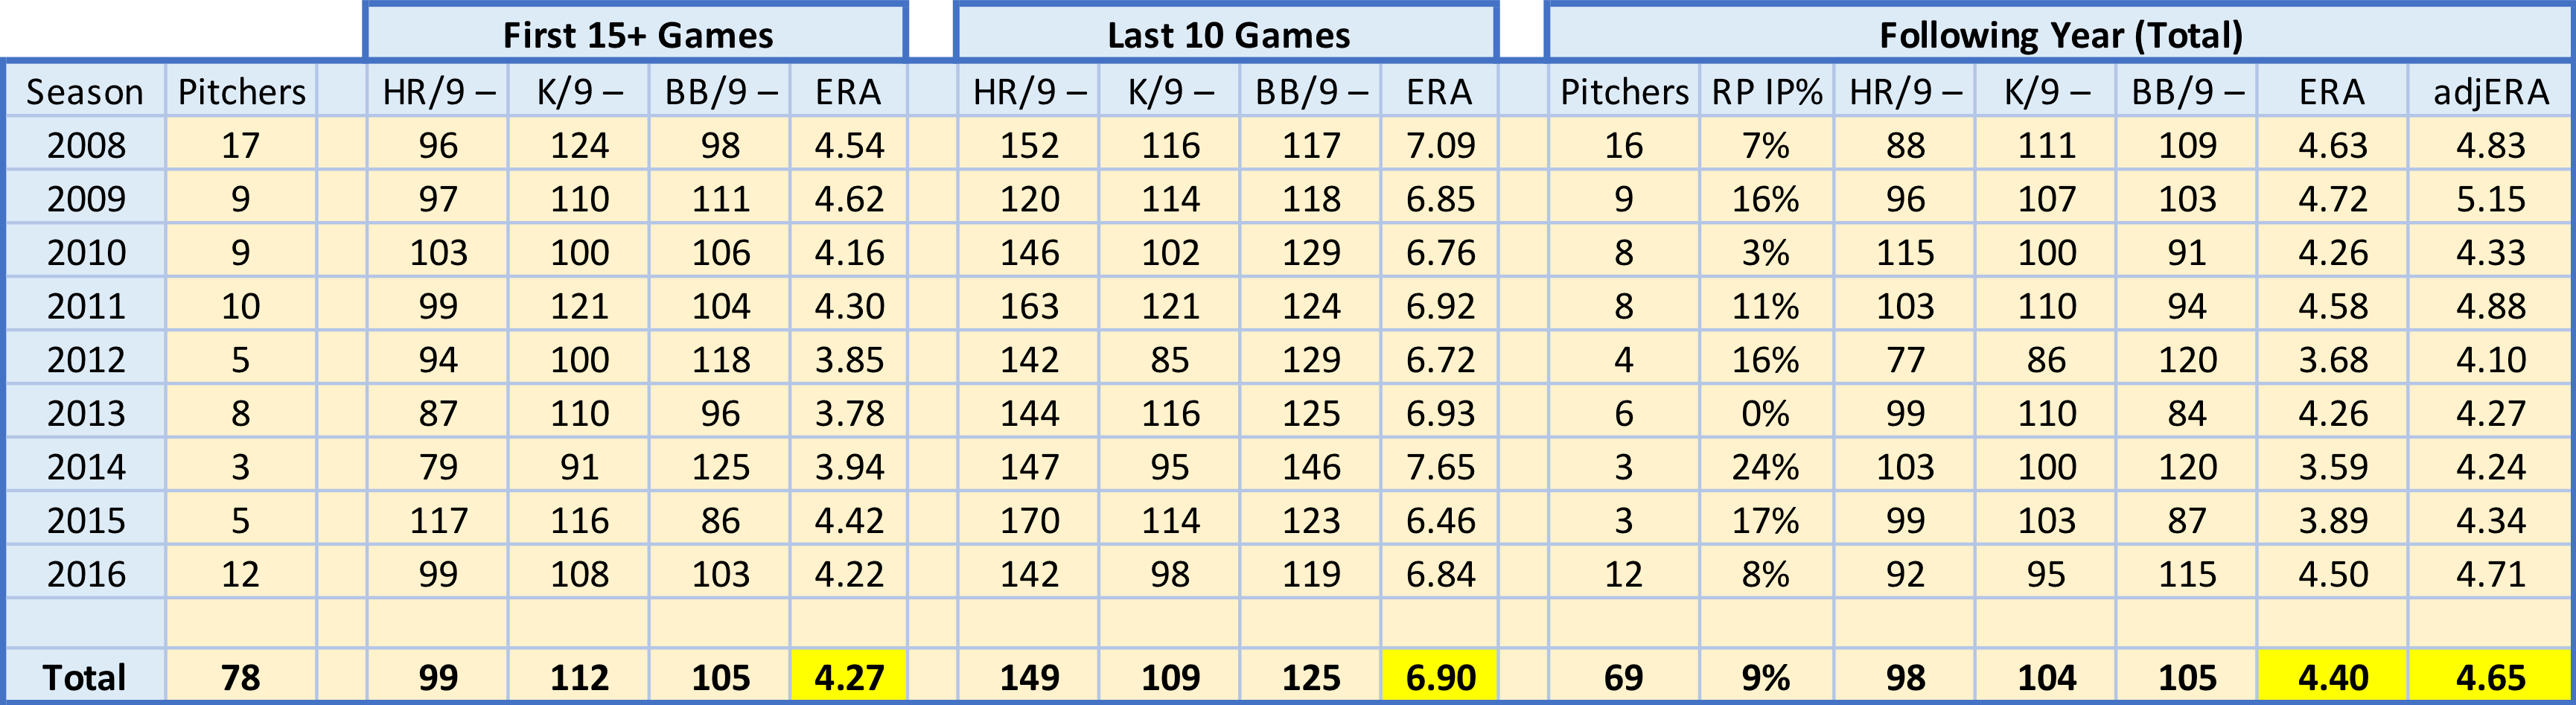
What is driving these final 10 game ERA spikes? It has been shown that pitchers don’t have much control over batted ball outcomes. Generally, it is assumed pitchers control home runs, strikeouts and walks – the basis of many defense-independent pitching stats. Changes in these three stats could explain what happens during our samples’ final 10 games. Looking at each stats’ rate per nine innings, however, would be misleading, as each season exhibits uniform change (such as the recent home run revolution, or the ever-growing increasing in strikeouts). I calculated three metrics for each subset (first 15+, last 10 and following year) to use in evaluation: HR/9–, K/9– and BB/9–. All three are similar to ERA– in interpretation – a value of 100 is league average, and lower values are better.

Further, not necessary math details: for example, a value of 90 would be read as the following. For HR/9– or BB/9–, a value of 90 means that subset’s HR/9 or BB/9 is 10% lower, or better, than league average.  For K/9–, a value of 90 means that the league average is 10% lower, or worse, than the subset’s K/9. To create these measures, I calculated HR/9, K/9 and BB/9 for each subset and normalized them to the league value for each season – including the next year’s value for the following year’s rates. Then, I normalized these ratios to 100. To do that, I divided HR/9 and BB/9 by the league averages and multiplied by 100. Because a higher K/9 is better (unlike HR/9 and BB/9), I had to divide the league average by K/9 and then multiply by 100, slightly changing its interpretation (as noted above).

final10-2.png

As mentioned above, the issue of starters-turned-relievers within our sample likely influences our following year statistics. I was able to adjust the ERA, but I did not adjust the rate stats – HR/9, K/9 or BB/9 – as I have not seen research suggesting specific conversion rates between starters and relievers for these.

Interestingly, our sample of pitchers improved their K/9– across the three subsets, despite having fluctuating ERAs. They were below average, regardless, but improved relative to league average over time. Part of this could be calculation issues, as league K/9 fluctuates monthly, and I used season-level averages in calculations.

Both HR/9– and BB/9– drastically get worse during the 10 start end-of-season stretch. These clearly drive the ERA increase. In fact, despite seven of the nine seasons’ samples having better-than-average HR/9 in their first 15+ starts, every season’s sample has a much-worse-than-average HR/9 in their last 10 starts, where eight of the nine seasons’ samples HR/9 are 40%+ worse than league average. Likewise, though less drastically, our samples’ BB/9 are much worse than league average in the last 10 starts subset. Unlike HR/9–, though, our samples’ BB/9– is worse than league average in the first 15+ starts subset. The first 15+ games’ HR/9– and BB/9– are identical to the following year’s values, unlike K/9–.

It appears that starters with an ERA greater than or equal to 6.00 in their final 10 starts, assuming 25 or more starts in the season, generally return to close to their pre-collapse levels in the following year. This end of season collapse seems to be driven primarily by a drastic increase in home run rates allowed, coupled with an increase in walk rate. These pitchers performed at a replacement level (or worse) for a short period and bounced back soon after. Mr. Tango & Bobby Mueller, in their email chain (posted on Mr. Tango’s blog), acknowledge this conclusion: “they are paid 0.5 to 1.0 million$ above the baseline… At 4 to 8 MM$ per win, that’s probably an expectation of 0.1 wins to 0.2 wins.” We can debate the dollars per WAR, and therefore the expected wins, but one thing’s for sure – past performance is a better predictor of the future than most recent performance.


– tb


Special thanks to Mr. Tango for his motivation and adjusted ERA suggestion.

Osuna or Later, Roberto Should Bounce Back

Roberto Osuna, the Blue Jays young star reliever, has put together a very impressive resume in his 3-year career. Last season Osuna ranked 3rd in RP WAR (3.0) only behind Craig Kimbrel and Kenley Jansen in his age 23 season, and has also posted the highest cumulative WAR among relievers aged 20-23 years old in the last 40 years, while also producing the 2nd best FIP (2.69) and the moves saves (95).

Last July, Jeff Sullivan wrote a very compelling and in-depth article into the pure dominance Osuna was displaying on the mound; he was having a near perfect start to his season. He showed that across the board, Osuna ranked in the top 90 or 95 percentile in all of the major pitching statistics, proving that he had put it all together – matching his control to his skills. A few weeks before Jeff published his article (around June 25th), Osuna had missed some time for personal reasons, which was later disclosed as time away from the team to deal with anxiety issues. Roberto showed great courage speaking out to the public about his own internal struggles, but it was soon after that announcement that Osuna began to struggle on the mound.

It is both a difficult and a delicate analysis to undertake when analyzing the changes to Roberto’s performance last season. It is important to not read too much into certain trends and extrapolate that these derive from mental rather than physical, mechanical or strategic changes; however, this article will explore these changes to see why he suddenly began to struggle and how Roberto can strive to regain his top form for his 2018 season and beyond.

Roberto was at the top of his game in May and June and was putting up ridiculous numbers every time he took the mound. From July onward, Osuna began throwing his cutter and sinker much more frequently and threw fewer four-seam fastballs and sliders, as shown below:


The increase in his FC and SI usage and decrease in his SL and FA usage resulted in a change in his batted ball profile and strikeout potential. Osuna has a devastating slider with one of the best chase rates and swinging strike percentages in the league. He moved away from this pitch in favor of his sinker, which resulted in a lot more groundballs, as shown below. This change affected his BABIP, as it rose from .269 to .298.


Further, the large increase in his cutter usage resulted in a lot more hard-hit balls and he began to use it more often in high leverage situations with runners on base. His cutter usage increased from 15.7% to 37.4% with runners on base and this led to a plummeting left on base percentage. Last season Osuna posted the 2nd worst LOB% in the league among relievers at 59.5%. This is a statistics that jump off the page when juxtaposed with his fellow elite relievers who post metrics above 80 or even 90 percent. Below we can see just how drastic the drop was for him.


Considering that his LOB% was such an outlier compared to his peers, it is important to delve further into how this occurred. Recent history shows how rare it is for a pitcher with such great skills and control to have such trouble with runners on base. Since 2000, there has only been one other reliever who had a FIP under 2.00 who had a lower LOB%. A contributing factor to his struggles with runners on base was his aforementioned change in pitch composition. Increased usage of his sinker increased his balls in play and BABIP, his increased usage of his cutter resulted in harder hit balls and his decreased slider usage decreased his strikeout rate at times where he needed it most. Before June 25th, Osuna had a 2.41 FIP, 29.4% strikeout rate, 0% walk rate and a .304 BABIP with runners on base. After his temporary absence, his FIP actually dropped to 2.02, despite striking out fewer batters (24.1%) and walking more batters (1.8%) but his BABIP increased to .378. His xwOBA of .274 versus his wOBA of .311 with runners on suggests that he got a bit unlucky in the second half of the season, so his high BABIP is likely a combination of poor pitch command or selection, poor defense behind him and bad luck on balls in play.

Osuna enjoyed such great success when getting ahead of hitters (.189 wOBA after 0-1) and especially with 2 strikes (.130 wOBA), that hitters began to be more aggressive earlier the count looking for something to hit hard. A combination of a loss in fastball velocity and poor pitch location, Osuna began to get hit harder in high leverage situations. The top two heatmaps are Osuna’s fastball location and the bottom two are for his cutter. The heatmaps on the left are before June 25th while the ones on the right are after June 25th.


Osuna began to leave his fastball up over the plate in a hittable spot, as opposed to up and in, where he could tie-up right-handed hitters and produce weak contact. His cutter went from a setup pitch or even a waste/chase pitch to a pitch that he threw for strikes. Since Osuna started to throw so many more cutters, of course, he had to throw more of them for strikes, but the problem was he was unable to command the pitch to the better areas of the zone. A likely reason why Osuna began throwing more cutters was because the drop in his fastball velocity, as it was losing its effectiveness.


Pete Walker the pitching coach for the Toronto Blue Jays recently discussed with reporters Roberto Osuna’s offseason and reflected on his 2017 season. He acknowledged that Osuna had a drop in velocity during the season, had some mechanical issues, which impacted his fastball command, and that perhaps he threw his cutter too often during stretches of the season. All of this can be backed up with stats. Both the Jays coaching staff and Osuna are aware of where he can improve to regain with elite form. Walker also alluded that perhaps Osuna’s off of the field issues had an impact on his performance last season. By interpreting some statistics through this lens we can see how it can appear that Osuna lost of a lot of his confidence on the mound, especially in high-stress situations.


In particular, Osuna struggled away from the Rogers Centre as his road ERA was 5.10 versus only 1.85 at home in 2017. Further, Osuna had the 2nd best home wOBA while on the road it was only ranked 48th best.

Osuna was still good in the 2nd half (1.80 FIP and 4.24 ERA) and overall had a great 2017 season, but when the pressure started to grow and the wheels started to spin, they usually fell off (i.e. on the road with runners on base). It is hard to say whether this is the result of a lack of confidence, his decreased velocity on his fastball and his subsequent increased usage of his cutter or if it was a bit of bad luck with runners on base. It is likely a combination of these factors that led to Osuna’s declining second half, but we shouldn’t forget how dominant he can be when he’s at his best. According to Walker, Osuna has put on some muscle this offseason to help him with his durability in maintaining fastball velocity. Just like for most if not all other pitchers, being able to command his fastball is pivotal to Osuna being successful. At the end of last season, Osuna saw a small up-tick in fastball velocity and retired all 15 batters he faced in his last 5 appearances of the season, which is an encouraging sign, but how will he handle adversity, when batters reach base in 2018? With some minor tweaking to his game, Osuna should be on track to bounce back and have another dominant season as the Blue Jays closer.


A Second Look at a Team Full of Free Agents

At the beginning of February, Travis Sawchik wrote a piece about the viability of a team consisting entirely of unsigned free agents. I enjoyed the exercise as it underscored the extent to which players had been waiting to sign deals. Even that late in the year it was easy to field a competitive team, albeit an expensive one. Free agency is always considered to be more expensive than a homegrown team, hence the reason small market teams have to trade free agency bound players and retool, so it was no surprise that to create a decent team, the payroll had to be exorbitant. If you assume one WAR is worth $8-9 million dollars, then you would predict a 40 WAR team to cost over $300 million dollars in payroll. Sawchik’s team ended up costing $245 million dollars for the first year and was projected for 37.1 wins above replacement. While this was good for only $6.6 million dollars per WAR, it would still be the most expensive team in baseball and have to fight to stay in the wild-card race.

At the time I thought this was a good reminder of why the offseason was so slow; it just didn’t make sense for teams to meet players contract demands when it was so inefficient. In the following weeks though, players started signing at a faster rate, and again and again, I was taken aback by how little they were receiving. The $4 million dollar contract for Neil Walker was the most surprising of all for me. With seven straight seasons of at least 2 WAR and no qualifying offer, it seemed obvious to me that he deserved considerably more this. If you were to plug one year of Neil Walker into the surplus value calculators that Dave Cameron used to commonly employ, it estimates that Walker has $16 million in value for 2018, this is nowhere near what he ended up receiving.

Because of this, I decided to do a different spin on Sawchik’s team building exercise, using the contracts players actually signed, as opposed to projected contracts. Here is the team I came up with:

Team of Signed Free Agents

Batters Position WAR DC Proj. $/Year (mil) Years Total $ (mil) $/WAR (mil) QO
Lucroy C 2.9 $6.5 1 $6.5 $2.2
Duda 1B 1.7 $3.5 3 $10.5 $2.1
Walker 2B 2.6 $4.0 1 $4.0 $1.5
Moustakas 3B 2.7 $6.5 1 $6.5 $2.4 Y
Cozart SS 3.4 $12.7 3 $38.0 $3.7
Gomez LF 1.4 $4.0 1 $4.0 $2.9
Cain CF 3 $16.0 5 $80.0 $5.3 Y
Martinez RF 3.4 $22.5 5 $112.5 $6.6
Alonso DH 1.8 $8.0 2 $16.0 $4.4
Avila C 1.2 $4.2 2 $8.3 $3.5
Nunez UT 1.3 $4.0 2 $8.0 $3.1
Rasmus OF 1.2 $0.5 1 $0.5 $0.4
Pitchers Position WAR DC Proj. $/Year (mil) Years Total $ (mil) $/WAR (mil) QO
Darvish SP 4.2 $21.0 6 $126.0 $5.0
Cobb* SP 2 $12.0 4 $48.0 $6.0 Y
Minor SP 1.9 $9.3 3 $27.9 $4.9
Sabathia SP 1.6 $10.0 1 $10.0 $6.3
Vargas SP 1.5 $8.0 2 $16.0 $5.3
Swarzack RP 1.2 $7.0 2 $14.0 $5.8
Gregerson RP 1.1 $5.5 2 $11.0 $5.0
Hernandez RP 0.7 $2.5 2 $5.0 $3.6
Petit RP 0.5 $5.0 2 $10.0 $10.0
Albers RP 0.4 $2.5 2 $5.0 $6.3
Watson RP 0.4 $3.5 2 $7.0 $8.8
Benoit RP 0.1 $1.0 1 $1.0 $10.0
Liriano RP/SP 1.2 $4.0 1 $4.0 $3.3
Total 43.4 $183.6 57 $579.7 $4.2
*MLB trade rumors projection

DC Proj. are the Fangraphs depth chart projections

QO is whether or not the player had a qualifying offer attached

As you can see, the result of this team is much more successful than the team using projected contracts. I managed to stay under the luxury tax threshold ($197 million minus $13 million projected for player benefits) while creating a team that would be eighth in major league baseball in projected WAR just ahead of the Cardinals and behind the Nationals. Think about that, a team with no prospects, no homegrown players, and no assets to trade from could create a competitive baseball team from scratch through one year of free agency. And the team isn’t completely sacrificing its future either, as only four of the contracts are for more than three years. I can’t stress enough how surprising this is.

Instead of showing that free agency is completely inefficient for teams, this shows how easy it would be for a team to be projected for a playoff spot in the year’s offseason. Adding even a couple homegrown players, which every team has would boost this team into the ranks of other division leaders. So why is this the case? How was an entire team of free agents created for $4.2 million dollars per projected WAR? What happened to the accepted value of $8-9 million dollars per WAR?

I found both of these questions kind of perplexing since I could not find a good reason why the price of a win had dropped so quickly, but I decided to compare some of the most surprising contracts with similar players who were traded, and what the return was. All of the following free agents received considerably less than expected salaries based on their projected WAR and the following traded players were traded this offseason and have played a similar position and projection to the selected free agents.

Selection of Signed Free Agents

Name Age WAR DC proj. Contract
Mike Moustakas 29 2.7 1yr/6.5 mil (QO)
Todd Frazier 32 2.5 2yr/17 mil
Neil Walker 32 1.9 1yr/4 mil
Carlos Gomez 32 1.4 1yr/4 mil
Jonathan Lucroy 32 2.9 1yr/6.5 mil

Selection of Traded Players

Name Age WAR DC proj. Contract Return
Evan Longoria 32 2.8 5yr/68 mil + option Christian Arroyo (81 on MLB Pipeline), 2 other prospects, Denard Span (1yr/9 mil + option)
Dee Gordon 29 1.9 3yr/37 mil 2 prospects (both top 20 in Marlins system)
Yangervis Solarte 30 0.9 1yr/4.1 mil + options (5.5 and 8 mil) Edward Olivares (top 20 in Padres system), 1 other prospect
  1. Contracts according to Spotrac 2) Prospect rankings according to mlb.com

While these are only specific examples, all three comparisons, between Longoria and Moustakas or Fraizer, between Gordon and Gomez, and between Walker and Solarte, show a higher value placed on traded players than on free agent ones. Even with Longoria’s $68 million owed, he still returned three prospects in a trade. The Rays did take on Denard Span’s contract, but this salary dump was made up for by Arroyo alone, who is worth $20.2 million according to the Updated Version of MLB Prospect Surplus Values. Despite this, Moustakas received a tenth of the guaranteed money, and Frazier, who didn’t have a qualifying offer, a quarter of Longoria’s contract. So while Longoria had surplus value in a trade to the Giants, Frazier, and Moustakas, whose projections are very close to Longoria’s, couldn’t get anything close to his contract.

Similar situations occur with the other two comparisons. Dee Gordon was worth two prospects in surplus value, but Carlos Gomez, who is only projected to be a half-win worse, couldn’t even get 15% of Gordon’s guaranteed money. Also, the Blue Jays traded two prospects for Solarte this winter, even though he is making slightly more money than Neil Walker, and is projected to be only half as valuable. These both seem to be huge gaps between the value on the trade market, and value on the free agent market.

Then there is Jonathan Lucroy. While there were no significant catcher trades this offseason, comparing Lucroy’s Fangraphs projection to his contract is absurd.He has the fourth highest projected WAR for catchers in all of baseball, meaning that 27 teams could have upgraded by signing him, and yet he received $6.5 million. Granted, this projection seems high, but it’s easy to forget that two years ago he was a 4.6 win player. It seems to me that he would be worth much more than $6.5 million.

It is hard to know what all of this means. Do our WAR models overestimate mid-level talent? Do teams have projections very different from what is in the public sphere? Does it really have a lot to do with what teams think they can do with a player as opposed to their present value as was brought in a recent piece by Jeff Sullivan? Was the $8-9 million per win phase really just a contract bubble that has burst? While it is true that the gap in value between trade candidates and free agents is what you would expect if there were to be collusion from general managers, I think there is little other evidence of that, but it is still confusing why some player values seem to have dropped so quickly when compared to previous markets. I feel like I have brought up more questions than I have answered, but one thing is clear to me. If the trends from this offseason continue, looking to free agency for mid-level players will be much more efficient than it once was for teams. It seems unlikely that contracts for these types of players stay this low, however, since as any economics textbook can tell you, demand drives the price up. I would guess that plenty of teams will once again realize the value of Neil Walker for $4 million a year in the coming weeks, months and years ahead.


Will We See a Record Number of Three True Outcomes Specialists in 2018?

Last season was the year of the three true outcomes specialist.  Aaron Judge’s dominant three true outcomes season was the most prominent example of this: he ranked second in home runs (52) and walks (127) and first in strikeouts (208).  In total, 57% of his plate appearances resulted in one of the three true outcomes.  He was the American League Rookie of the Year and in the running for the 2017 American League Most Valuable Player award, finishing second.  His performance helped the Yankees reach the American League Division Series.

We know that the three true outcomes rate has been increasing.  In part, this is due to the average player increasing his rate of home runs, strikeouts and walks.  But there is also the unusual player in the mold of Judge who takes an extreme approach at the plate resulting in dominant three true outcomes seasons.  The number of these hitters has been increasing over time.

Figure 1. Three True Outcomes Specialists per Season, 1960-2017

View post on imgur.com

Figure 1 shows the number of dominant three true outcomes player seasons over time.  To get here I examined all players since 1913 with at least 170 plate appearances in a season.  I considered a dominant season one with a three true outcomes rate of at least 49%.  There have been 132 player seasons with a three true outcomes rate of at least 49%.  All of them have taken place after 1960.

The graph shows that the number of dominant seasons has been increasing over time.  Since Dave Nicholson first did it in 1962, most years have had at least one player cross the threshold.  Since 1994, every season has had at least one.  From 2001 to 2010 there were four seasons with five three outcomes hitters.  There was six in 2012 and eight in 2014.  The trend is currently peaking with 13 in 2016 and 16 in 2017.  The trend is a bit more extreme but similar to the average increases in three outcomes rates over time.  It seems that more players pursue (and teams tolerate) an approach to hitting that includes extreme rates of the three outcomes.

It is worth pointing out that those 16 players in 2017 account for about 4% of all players with at least 170 at-bats.  Three true outcomes specialists are more common but still rare.  Who are those 16 players?  Table 1 lists them including the home run, walk and strikeout rates, and the combined three true outcomes rate for the year.

Table 1. Three True Outcomes Specialists, 2017

Player HR/PA BB/PA SO/PA TTO
Joey Gallo 8% 14% 37% 59%
Aaron Judge 8% 19% 31% 57%
Ryan Schimpf 7% 14% 36% 56%
Chris Davis 5% 12% 37% 54%
Miguel Sano 6% 11% 36% 53%
Alex Avila 4% 16% 32% 52%
Mike Zunino 6% 9% 37% 51%
Drew Robinson 5% 12% 35% 51%
Jabari Blash 3% 14% 34% 51%
Keon Broxton 4% 9% 38% 51%
Chris Carter 4% 10% 37% 50%
Mike Napoli 6% 10% 34% 50%
Kyle Schwarber 6% 12% 31% 49%
Matt Olson 11% 10% 28% 49%
Cameron Rupp 4% 10% 34% 49%
Eric Thames 6% 14% 30% 49%
Jake Marisnick 6% 8% 35% 49%
2017 Averages 3% 9% 21% 33%

The list includes many of the unique player stories of the year.  Aaron Judge’s rookie year was historic.  Joey Gallo made waves, particularly for his extreme three true outcomes rates.  Miguel Sano was an All-Star who helped lead the Twins to a bounce back year and a wildcard spot.  Eric Thames was a surprise story of the year, returning from a year in Japan and sparking the Brewers to an early lead in the National League Central.

Notable about this list is the young cohort of hitters who have consistently taken the all or nothing approach of the three true outcomes specialist.  Judge, Olson, and Blash all made their MLB debut in 2017.  Gallo still qualified as a rookie despite making his debut in 2016.  Keon Broxton, Ryan Schimpf, and Kyle Schwarber are in their second year.  Sano has been a specialist for three years running.  Sure, there are old hands like Napoli and Carter, and Davis who take the all or nothing approach, but the record number of specialists the last couple years have been due to this young cohort of three true outcomes specialists.  A new record will come down to 2018 rookies who practice this all or nothing approach heading into their major league debuts, and the number of teams willing to tolerate the strikeouts that come with this approach.


The Trickiest Third Strike Pitcher in MLB

I ran some queries over at Baseball Savant and came across this tidbit of information. Since 2015, no other pitcher froze hitters on strike three more than Cleveland Indians’ Corey Kluber.

cKluber

I decided to write an article on Kluber’s caught looking data along with how he’s able to be the best at getting hitters held up on that third strike.

Sifting through the last three years of Statcast data, and filtering the results down to a 5000 pitch minimum, Kluber ranks second overall to Clayton Kershaw (2.38%) in called third strike ratio to total pitches (2.28%).

So, why am I not writing about Kershaw? Well, I’m not concerned with ratio because, in this case, the ratio is independent of the number of times Kluber is able to deal that third strike. Kershaw might be better at working over hitters (thereby throwing less) but that doesn’t necessarily lend itself to more swing-less third strikes.

Kluber has thrown with two strikes nearly 1500 more times than Kershaw has in the last 3 years. But, Kershaw his pitched much less (mainly due to injuries), so we’re not going to ‘punish’ Kluber for this. And, we’re talking about a difference in the ratio that’s a tenth of a percent.

Moving on, I wondered if there is any advantage pitching in the American League? First, I looked at the overall plate discipline numbers for the entirety of Major League Baseball from 2015-2017.

mlbPlateDiscipline

So we have a 3-1 ratio of swings, as well as contact, in verses out of the zone. Now I’ll compare the AL vs NL three-year average.

alnlPlateDiscipline

We’re talking about fractions of a percent difference, with the only real disparity (if you can call it that) is the out of zone contact where the AL has a nearly 1% difference. So, there is no advantage to pitching in either league in terms of the type of at-bat you’ll experience.

Using a minimum of 1000 pitches each year, I found that Kluber finished first in 2015, third in 2016, and 2nd in 2017 in strikeouts looking. Furthermore, in context of plate appearances with two strikes, Kluber is ahead in the count (1-2/0-2 count) 24% of the time, even at 45%, and behind (or, a 3-2 count) 31% in those three years. Nearly a quarter of every two-strike situation, hitters are forced to be aggressive at the plate; and just under a third of the time, the batter has to make a mandatory choice.

Before I proceed,  I need to point out that there is some discrepancy as to what Kluber actually throws. He uses something of a sinking fastball that is hard to classify; it goes either way but my main source of research indicates it’s basically a sinker. And with his breaking pitches, which some sites call it a slider, some call it a curve, but it may be a slurve.  For argument’s sake, we will refer to both of them as a sinker and a slider.

So what is it that Kluber is using that’s laying waste to hitters on strike three? His sinker, which he’s thrown for strike three 108 times (50%) since 2015.

kluberPitchTypes

The above graph is his pitch selection after strike two the last three seasons.

His sinker location when he throws regardless of the count. Good luck telling a hitter where to concentrate his swing when he throws it.

chart (21)

chart (22)

However, something changed in 2017; he cut back on his bat-confining sinker by 7% and increased his change-up and slider/curve/slurve usage 1.5% and 7.3% respectively.

kluberSIvsCH

Just for curiosity’s sake, Kluber’s release points are nearly identical on all three pitches. So the hitter may not know whats coming at him with the intention of ending up as strike three (until its too late).

chart-(23)

OK, so he leaned more on his slider last year. What can we make of that using his last three years’ run values in the context of runs above average?

Screen Shot 2018-02-28 at 4.48.06 PM

The sinker, his bread and butter pitch for strikeouts, seems to hover around league average in terms of run value. Upping his change and slider usage appears to have paid dividends; Kluber seems to believe those are better suited to set the batter up for the strikeout. I would also venture to guess his sinker isn’t nearly as effective when thrown earlier in the count, hence the negative run value.

To note, Kluber’s two-strike stats: .136 BA/.392 OPS/10-1 K-BB

His sinker is clearly working when he needs it to.  Overall, it’s his least-effective pitch as hitters eat it up for a .300 average. Nevertheless, according to the data, it’s a tough pitch to gauge when used for that third strike.

Maybe Kluber will start using his slider more with two strikes. However, if he does so, that could cause him to be dethroned as the ‘King of Caught Looking’; his slider is swung at more than any other pitch he has, thereby causing a swinging strikeout.

Regardless, Kluber should still be able to put batters away with that devastating sinking fastball; opponents have 2-to-1 odds they’ll be dealing with it when the count has their backs are against the wall.  It usually doesn’t end well.