Temporarily Replacement-Level Pitchers and Future Performance
As I’d like to think I’m an aspiring sabermetrician, or saberist (as Mr. Tango uses), I decided to test my skills and explore this research question. How did starters, who had 25 or more starts in one season and an ERA of 6.00 or higher in their final 10 starts, perform in the following season? This explores whether past performance, regardless of intermediary performance, adequately predicts future performance. Mr. Tango proposed this question as a way to explore the concept of replacement level. From his blog: “These are players who are good enough to ride the bench, but lose some talent, or run into enough bad luck that you drop below ‘the [replacement level] line’.” Do these players bounce back to their previous levels of performance, or are they “replacement level” in perpetuity?
To explore this, I gathered game-level performance data for all starters from 2008 through 2017 from FanGraphs, grouped by season. I then filtered out pitchers who had fewer than 25 starts and had an ERA less than 6.00 in their final 10 starts. This left me with a sample of 78 starters from 2008 through 2016 (excluding 2017 as there is no next year data yet). I assumed that a starter with an ERA above 6.00 was at or below replacement level. Lastly, as some starters were converted to relievers in the following year, I adjusted the following year ERA according (assuming relievers average .7 runs over nine innings less than starters: see this thread).
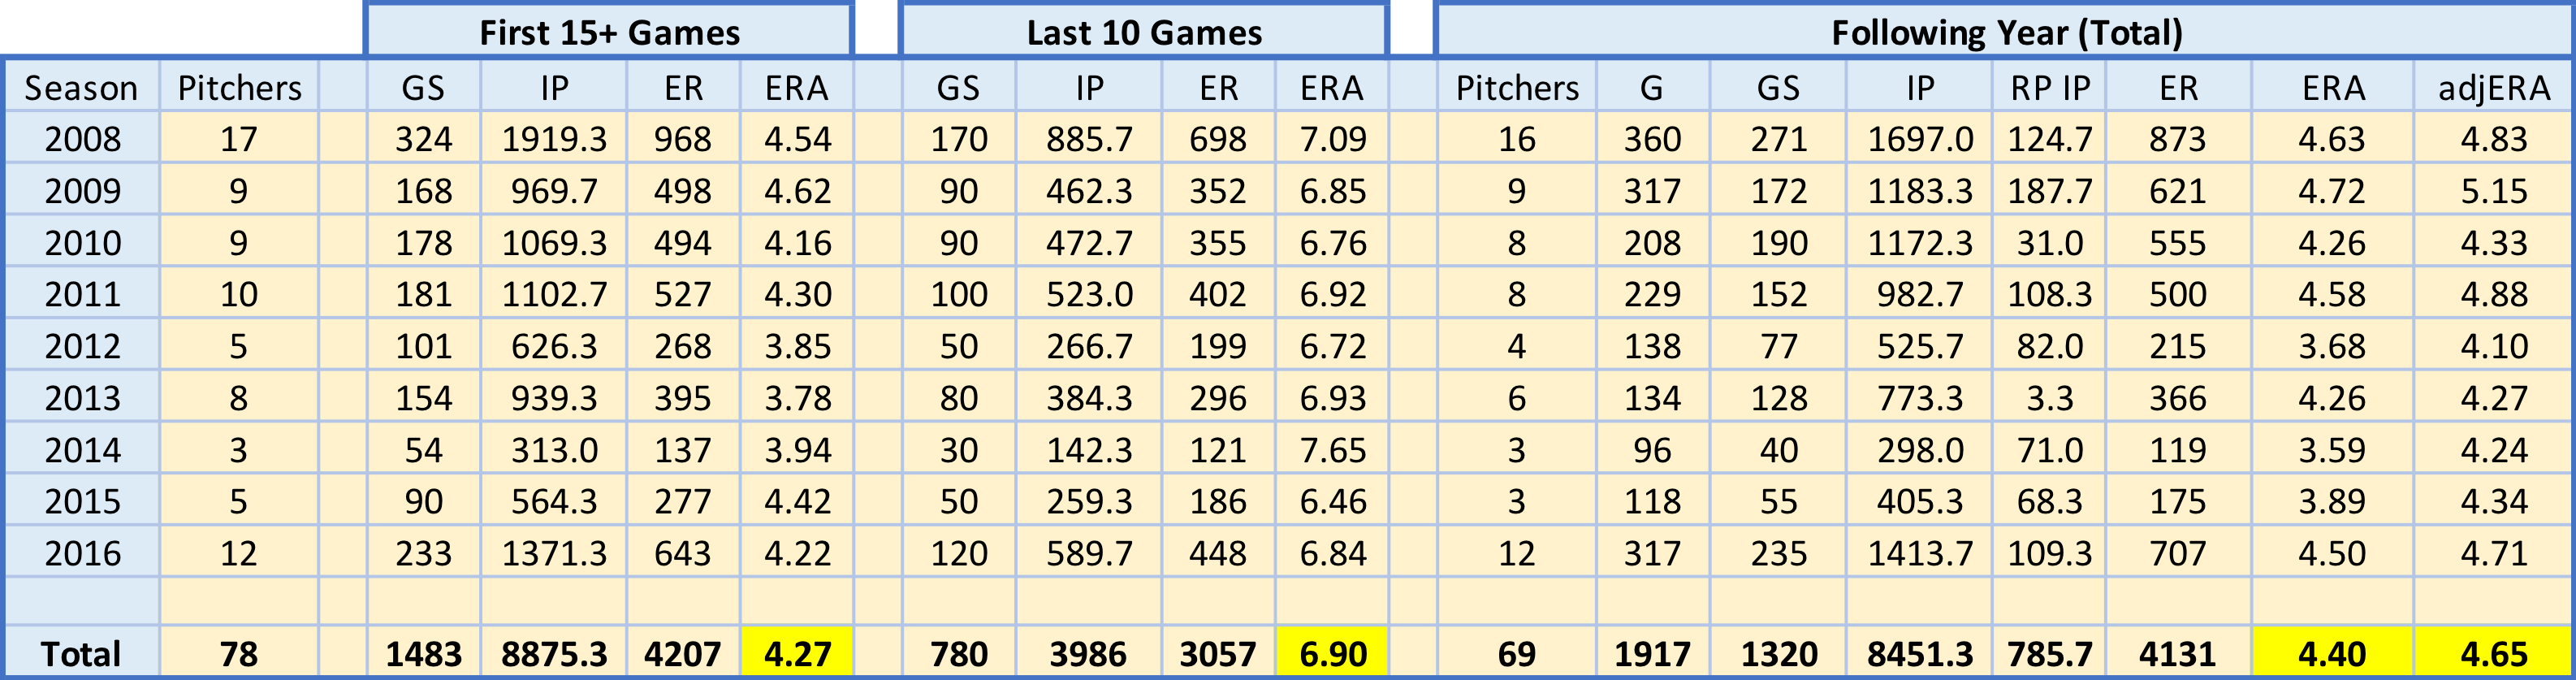
Seems like the 10-game stretch to end each season is a bit of an aberration. The following year’s adjusted ERA is much closer to the first 15+ games than the final 10 games for pitchers in our sample. In fact, the largest difference between any first 15+ game ERA and its following year adjusted ERA is .58 runs, in 2011. The smallest difference between any last 10 games ERA and its following year adjusted ERA counterpart, for comparison, is 1.7 runs, in 2009.
Using adjusted ERA corrects for the potential slight downward bias in our following year totals. Following year games started fell by ~9%, while reliever innings increased from zero to each season’s value. Relievers, on average, have a lower ERA than starters. As mentioned above, I adjusted each season’s following year ERA by .3 runs per reliever inning pitched (my assumed difference in runs allowed between starters and relievers per inning pitched). Another source for potential downward bias is sample size – of the 78 pitchers who fit our sample qualifications, only 69 pitched in the majors the following season. A survivor bias could exist in that the better pitchers in the sample stayed pitching, while the worse pitchers weren’t signed by a team, took a season off or retired.
What is driving these final 10 game ERA spikes? It has been shown that pitchers don’t have much control over batted ball outcomes. Generally, it is assumed pitchers control home runs, strikeouts and walks – the basis of many defense-independent pitching stats. Changes in these three stats could explain what happens during our samples’ final 10 games. Looking at each stats’ rate per nine innings, however, would be misleading, as each season exhibits uniform change (such as the recent home run revolution, or the ever-growing increasing in strikeouts). I calculated three metrics for each subset (first 15+, last 10 and following year) to use in evaluation: HR/9–, K/9– and BB/9–. All three are similar to ERA– in interpretation – a value of 100 is league average, and lower values are better.
Further, not necessary math details: for example, a value of 90 would be read as the following. For HR/9– or BB/9–, a value of 90 means that subset’s HR/9 or BB/9 is 10% lower, or better, than league average. For K/9–, a value of 90 means that the league average is 10% lower, or worse, than the subset’s K/9. To create these measures, I calculated HR/9, K/9 and BB/9 for each subset and normalized them to the league value for each season – including the next year’s value for the following year’s rates. Then, I normalized these ratios to 100. To do that, I divided HR/9 and BB/9 by the league averages and multiplied by 100. Because a higher K/9 is better (unlike HR/9 and BB/9), I had to divide the league average by K/9 and then multiply by 100, slightly changing its interpretation (as noted above).
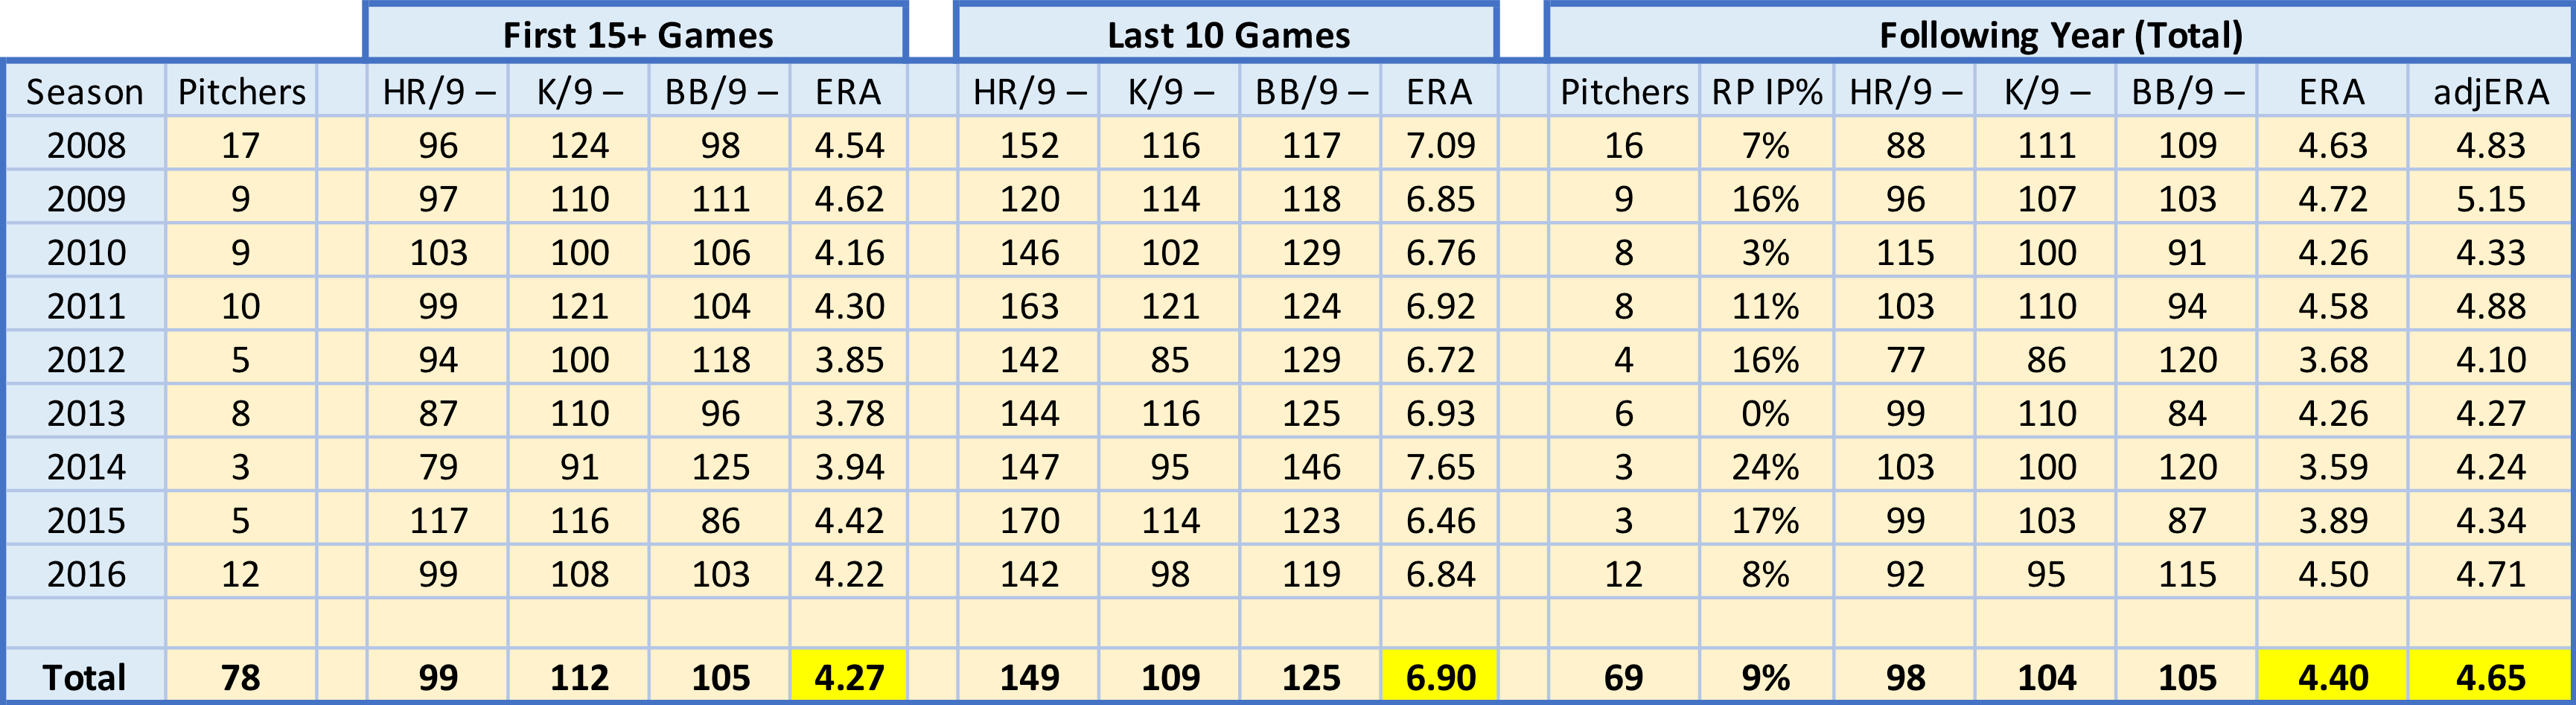
As mentioned above, the issue of starters-turned-relievers within our sample likely influences our following year statistics. I was able to adjust the ERA, but I did not adjust the rate stats – HR/9, K/9 or BB/9 – as I have not seen research suggesting specific conversion rates between starters and relievers for these.
Interestingly, our sample of pitchers improved their K/9– across the three subsets, despite having fluctuating ERAs. They were below average, regardless, but improved relative to league average over time. Part of this could be calculation issues, as league K/9 fluctuates monthly, and I used season-level averages in calculations.
Both HR/9– and BB/9– drastically get worse during the 10 start end-of-season stretch. These clearly drive the ERA increase. In fact, despite seven of the nine seasons’ samples having better-than-average HR/9 in their first 15+ starts, every season’s sample has a much-worse-than-average HR/9 in their last 10 starts, where eight of the nine seasons’ samples HR/9 are 40%+ worse than league average. Likewise, though less drastically, our samples’ BB/9 are much worse than league average in the last 10 starts subset. Unlike HR/9–, though, our samples’ BB/9– is worse than league average in the first 15+ starts subset. The first 15+ games’ HR/9– and BB/9– are identical to the following year’s values, unlike K/9–.
It appears that starters with an ERA greater than or equal to 6.00 in their final 10 starts, assuming 25 or more starts in the season, generally return to close to their pre-collapse levels in the following year. This end of season collapse seems to be driven primarily by a drastic increase in home run rates allowed, coupled with an increase in walk rate. These pitchers performed at a replacement level (or worse) for a short period and bounced back soon after. Mr. Tango & Bobby Mueller, in their email chain (posted on Mr. Tango’s blog), acknowledge this conclusion: “they are paid 0.5 to 1.0 million$ above the baseline… At 4 to 8 MM$ per win, that’s probably an expectation of 0.1 wins to 0.2 wins.” We can debate the dollars per WAR, and therefore the expected wins, but one thing’s for sure – past performance is a better predictor of the future than most recent performance.
– tb
Special thanks to Mr. Tango for his motivation and adjusted ERA suggestion.
This was a fun read. Great line of inquiry.
thanks, trying to explore baseball and sabermetrics in insightful, non-modeling ways (as I learn more about modeling).