A Look into Robert Gsellman’s Curveball
Robert Gsellman of the New York Mets had a fairly average 2018. After struggles in the rotation during 2017 due to injury and ineffectiveness in facing batters a third time, as well as losing two miles per hour on his sinker compared to the previous year, Gsellman was moved into the bullpen full time. The plan initially worked, with an uptick in velocity and an improved strikeout percentage during April. Unfortunately, the rest of his season was filled with highs and lows, resulting in an 86 ERA+. However, his curveball did improve drastically in 2018.
Changes to Movement
One of the main ways Gsellman’s curve improved was his added spin rate. In 2017, his curveball had 2606 revolutions per minute, and in 2018 it was 2699 rpm. An increase in spin rate leads to an increase in the movement of the pitch. These two graphs demonstrate how this increase in spin rate translated into movement from 2017 to 2018. The first graph shows changes in vertical movement and the second one shows changes in horizontal movement.


These graphs express how Gsellman has added more bite to his curve (vertical movement from -4.3 to -6 inches) and a bit more depth to his curve. Visually, we can see this using the power of GIFs. The first GIF is his curve from 2017 and the second one is from 2018.


The 2018 curve breaks more sharply and also breaks from right to left more, as opposed to its 2017 counterpart, which is more of a tight vertical break. This added spin was most likely due to an increase in the pitch velocity increasing (80.2 mph to 81.8 mph).
Changes in Results
Both of these improvements sound great, but how did these changes affect the results? Using data from Baseball Savant¹, here’s a chart for the changes in how hitters swung at his curveball:
| Year | Zone Swing & Miss % | Chase % | Swing & Miss % (total) |
|---|---|---|---|
| 2017 | 19 | 14.1 | 25 |
| 2018 | 10 | 30.9 | 32.2 |
So, what does this chart mean? In general, we see that that his swing-and-miss rate has increased by 28%, but how he got those swings-and-misses changed. He increased his chase rate by nearly a whopping 120% and had a decrease in swing rate inside the strike zone. We should also keep in mind that he achieved this while keeping his pitches inside the zone at about the same rate from last year.
Knowing now that Gsellman’s curve is a more potent strikeout weapon than before, let’s look at the results on his pitches for balls in play. Thankfully, Baseball Savant helps us again with the data here. Here’s a graph demonstrating a few key differences from 2017 to 2018:
| Year | Hard Hit % | Barrel % | Line Drive % | Popup % |
|---|---|---|---|---|
| 2017 | 39.4 | 9.1 | 36.4 | 6.1 |
| 2018 | 15.8 | 0 | 26.3 | 15.8 |
Overall, his distribution of balls in play has not changed, but the quality of contact has. He massively improved his hard hit rate from 39.4% to 15.8%, nearly a 60% decrease. For reference, league-average hard hit percentage was 34.6%. This hard hit percentage is expressed in a lower line drive rate, an increase in popup rate, and zero barrels hit throughout the 2018 season.
Applications of these trends
Gsellman’s curve improved a lot in 2018, so naturally, he used it more, right? Surprisingly, the data tells us the opposite; Gsellman’s curveball usage remained the same at about 12 percent. This could either mean that Gsellman does not realize how good his curve is, or that he has found a good third pitch. The second option is really interesting, as it could signal a potential ability to be a starter. One of the biggest things that Gsellman struggled with in 2017 was facing a lineup the third time through. For example, here’s the isolated power numbers that he allowed for each time through the order, sorted by pitch category.
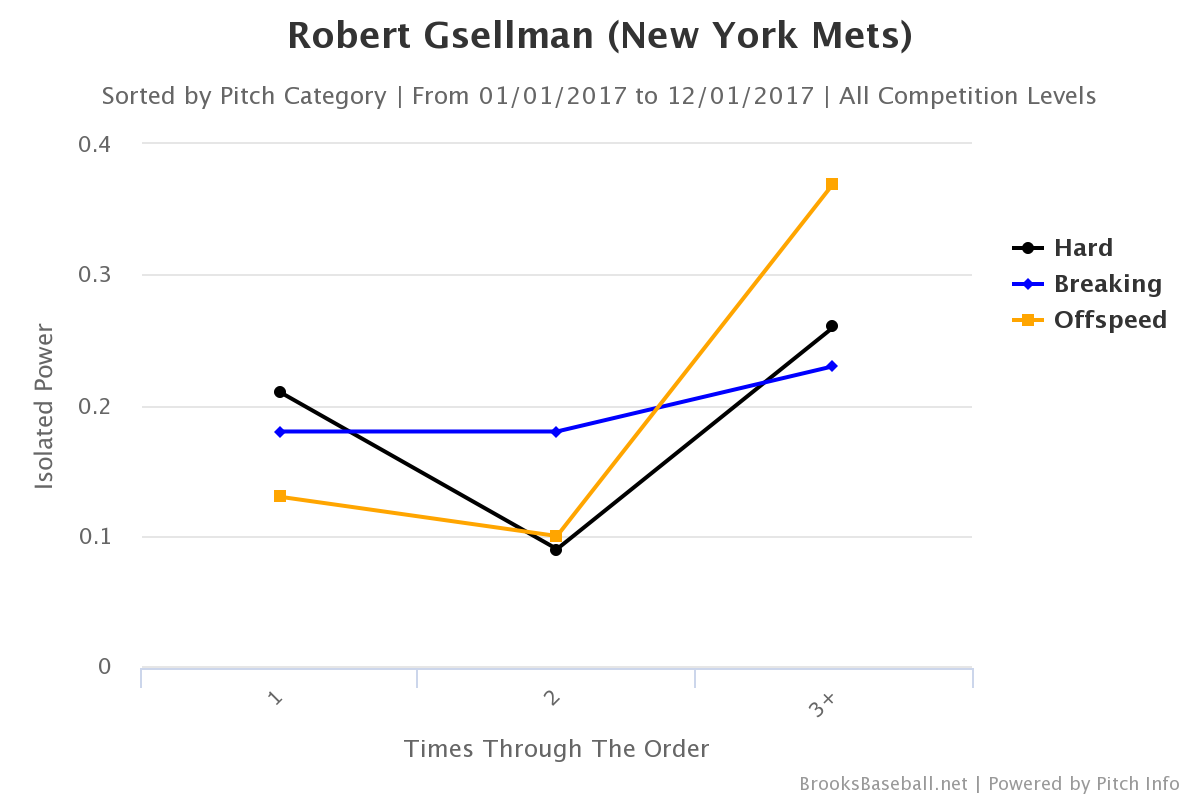
Yikes. Gsellman got truly hammered during the third turn of the lineup in 2017. Going back to the third pitch concept, three good pitches makes it easier to navigate a lineup a third time through, as it will be easier to keep hitters off balance by mixing in a third pitch. With this, Gsellman seems like a potentially appealing option for the rotation for the 2019 season, despite Mets GM Brodie Van Wagenen penciling him in for the bullpen. Should an injury or poor performance occur (Jason Vargas is their fifth starter), it will be interesting to see if he moves back into the end of the Mets rotation. Should this not happen, having a better third pitch will make him a better reliever as well, and it will be interesting to see how much he will improve in his second full season in the bullpen.
Citations:
Graphs:
- Player Card, BrooksBaseball.net.
- Player Card, BrooksBaseball.net.
- Player Card, BrooksBaseball.net
Data:
- “Robert Gsellman Statcast, Visuals & Advanced Metrics | MLB.com.” Baseballsavant.com.
Luke Power is a junior in high school