Archive for Player Analysis

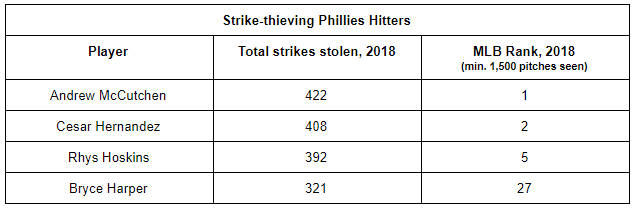
Getting Joe Musgrove to the Next Level

Joe Musgrove was a pretty ordinary pitcher in 2018, with a 103 ERA- and an 89 FIP- according to FanGraphs. He once again battled through injuries on the way to a career-high 115.1 innings, and he had more woes to deal with in the offseason by undergoing abdomen surgery. He doesn’t particularly stand out in Pittsburgh’s rotation, as he doesn’t have the track record or high transaction cost of Chris Archer, he doesn’t have the easy-to-root-for, feel-good story of cancer survivor Jameson Taillon, and he doesn’t have the intriguing out-of-nowhere 2018 performance of Trevor Williams. He is rather ordinary among starting pitchers. Even when I ran a query of starters with similar 2018 statistics, I got back a list of some good-but-perhaps-underwhelming hurlers. Look here:

musgrove comps 1

Nothing against these pitchers (especially Miles Mikolas, who had a good but perhaps unsustainable 2018 when looking at xFIP and SIERA, which he at least parlayed into a big contract extension), but these aren’t names that come to mind first when you think of the top pitchers in the league, and Garrett Richards isn’t usually on the mound to move up into that category in the first place.

This isn’t a great endorsement for Musgrove, so why am I interested in him? I drafted Musgrove in both of my fantasy baseball drafts earlier this month, prioritizing him over the other names in the above table. I did this based on the work of Nick Pollack, founder of the great website Pitcher List and contributor to FanGraphs, who has talked up Musgrove for awhile now. On the now- famous Top 100 Starting Pitcher Rankings featured on Pitcher List, Musgrove ranks 44th, ahead of the previously mentioned Archer (54), Alex Wood (69), Marco Gonzales (77), and other notable pitchers such as Cole Hamels (47), Jon Lester (48), and Dallas Keuchel (73). There must be an explanation for this. Read the rest of this entry »


The New-Look Phillies Lineup Plans on Stealing All Your Strikes

You’ve probably heard of how pitchers and catchers can steal strikes via expert control and framing. Some guys are just so good at painting the edges that they get those calls, plus the benefit of the doubt on the ones that push a little further outside. Think Zack Greinke, Aaron Nola, or Kyle Hendricks for pitchers. On the catching side, the names are less heralded, but think Yasmani Grandal, Jeff Mathis, or Max Stassi. They all deliver or receive the ball with such veracity that it’s almost magical to witness as a viewer, and probably infuriating as a hitter.

But all’s fair in love and baseball. If pitchers and catchers can aid themselves in stealing strikes that help them get outs, logic follows that hitters can do the same to prolong at-bats, even if we don’t necessarily talk about it under the same terms. Certain guys are just better than their peers at knowing when to swing and when not to, whether the ball is in the zone or not. And maybe, just maybe, that’s part of why the Phillies went out and acquired Andrew McCutchen and Bryce Harper this winter: they know when they can afford to not swing, even if the ball ends up on the edges or in the zone. In addition to Rhys Hoskins and Cesar Hernandez, the team now has three of last year’s top five hitters in baseball (and four of the top 30) at getting pitches in those spots to be called balls.

phils strike stealers

There’s a lot to unpack here. In each of the past three seasons, only about 220 hitters have qualified to be a strike thief each year by having seen at least 1,500 pitches. While hypothetically that works out on average to about seven guys per team, it’s certainly not how the talent is actually distributed. Just seven teams accounted for half of the top 30 alone in 2018. In many respects, what one team has is what another inherently can’t. Read the rest of this entry »


2019 Free Agents Got 91.5% of What We Expected

(…or “Fun With FanGraphs’ Free Agent Tracker and Excel”)

The 2019 offseason was an interesting and surprising one. It continued the recent trends of free agents signing later and of several prominent free agents getting less than expected. There was debate here at FanGraphs and elsewhere on whether free agency is broken, no longer working as intended, and if it could lead to a labor shutdown. Others see the big money earned by Harper and Machado as evidence that all is fine. I wanted to take a closer look, informed by data and some quick-and-dirty analysis.

On March 3, 2019, I went to FanGraphs’ free-agent tracker and selected the first 60 free agents listed in descending order of total value of newly signed FA contract. I removed the 13 players who were not featured in reader contract crowdsourcing, leaving 47 players, ranging from Bryce Harper ($330M) to Lonnie Chisenhall ($2.8M). I then compared the total years and total dollar values from crowdsourcing to the actual signed contracts. Here’s what I found. Read the rest of this entry »


Mike Trout and The 1% Club

Like many other followers of FanGraphs, I never seem to get enough articles about Mike Trout — the general theme being: “another way Mike Trout is so great” — so I want to share one of my own. Contrary to popular belief, Trout did not invent WAR; even more shocking, the metric wasn’t developed for the primary purpose of showcasing how valuable he is. But that of course is what it does do. Many readers may know that beginning with his first full season, at age 20, and continuing up to his most recent, age 26, Kid Fish has had the most WAR through every season but one — his age-25 season, when he missed nearly fifty games with an injury — than any other player in history. So it shouldn’t be surprising that he is one of just 20 members of what I call The 1% Club: players who have equaled or exceeded 0.010 WAR per PA for their entire careers.

In fact, he’s currently second only to Babe Ruth:

Career War/PA Of 0.010 Or Greater
Player fWAR/PA (career) fWAR/PA (age 26)
Babe Ruth 0.0159 0.0172
Mike Trout 0.0138 0.0138
Rogers Hornsby 0.0138 0.0134
Ted Williams 0.0133 0.0139
Barry Bonds 0.0130 0.0107
Lou Gehrig 0.0120 0.0121
Willie Mays 0.0120 0.0120
Honus Wagner 0.0118 0.0080
Ty Cobb 0.0114 0.0131
Mickey Mantle 0.0113 0.0129
Tris Speaker 0.0109 0.0123
Joe DiMaggio 0.0108 0.0123
Joe Jackson 0.0106 0.0109
Mike Schmidt 0.0106 0.0109
Jackie Robinson 0.0106*
Jimmy Foxx 0.0105 0.0122
Dan Brouthers 0.0104 0.0118
Nap LaJoie 0.0103* 0.0095
Eddie Collins 0.0100 0.0125
Stan Musial 0.0100 0.0116
*rWAR

This list is based mostly on FanGraphs’s fWAR, and is for players with a minimum of 50 career WAR. However, two players, Nap LaJoie and Jackie Robinson, don’t quite qualify by fWAR, but they do if we use Baseball Reference’s rWAR (all the others on the list qualify using either metric). Trout is the only active player on the list, though if we lower the bar to 30 career fWAR, three more players appear, including Mookie Betts, who is at 0.0104. Even lowering the criterion to just 10 fWAR adds just one more active player, Aaron Judge (0.0103). Read the rest of this entry »


How Blake Treinen Dropped 3.15 from His ERA

Blake Treinen had an outstanding year. You know that, I know that, he knows that, and his 9-2 record, 0.78 ERA, 38 saves, and 100 strikeouts says that. But how exactly did a run-of-the-mill reliever drop more than three runs from his ERA to have one of the best reliever seasons in history? I don’t know about you, but I think that’s what this article is all about.

Let’s start with some comparable seasons. First up, we go to Hall of Famer Dennis Eckersley. He only had one season in his 24-year career that compares to the brilliance of this Treinen’s 2018 campaign. That was 1990, when Eckersley was 35 years old and compiled a 0.61 ERA in 73.1 innings pitched with, coincidentally, 73 strikeouts, as well as 48 saves in 50 opportunities.

Secondly, Zack Britton’s 2016. I’m sure you remember Britton’s amazing season: 0.54 ERA, 47 saves, 67 IP, 74 strikeouts, and zero blown saves. That season was exceptional, and I must say, better than Treinen’s.

Finally, Jonathan Papelbon’s 2006: 0.92 ERA, 35 saves, 86.1 IP, and 75 strikeouts.

And that’s it. After searching both Baseball-Reference and FanGraphs, these three seasons are the ones I can find similar to Treinen’s. None of Mariano Rivera, Lee Smith, Trevor Hoffman, or Aroldis Chapman had a season like this.

Enough with those numbers, let’s move on to other numbers. Read the rest of this entry »


A Closer Look at Luke Voit

When PECOTA projections were released at Baseball Prospectus in February, I’m sure that I wasn’t the only one who was surprised to see Luke Voit projected to be a top-25 hitter in the entire sport this season. We all know what Voit did in the final month or so of the 2018 campaign, and when you look back on it, there were always going to be questions of whether it was repeatable or whether he was going to go down the same path as famed Yankee flash-in-the-pan Shane Spencer.

I think there can be a comfortable medium between one-hit wonder and top-25 hitter in baseball, so I decided to do a deep dive into Voit’s batted ball profile. I then compared him to his peers based on both his profile as well as his walk and strikeout rates to find some comparable hitters and try to answer whether a top-25 projection for Voit is realistic, too high, or too low.

To do this, I took the batted ball leaderboards from FanGraphs and imported them into R. I then looked at Voit’s batted ball profile from the minor leagues, considered by Yankees officials to be part of the reason why they wanted to acquire him. I calculated his minor league averages in Ground Ball%, Line Drive%, Fly Ball%, Pull%, Center%, and Opposite%, which can be found in the table below:

voit_minors

Note: I only looked at minor league seasons in which he had more than 100 plate appearances. Read the rest of this entry »


Greg Allen: More Than Meets the Eye

Spring training is here, the trade rumors have quieted a bit, and it seems as if Cleveland’s 40-man roster will be comprised of players already in Goodyear, Arizona.

Many fans have voiced their displeasure with the Indians’ lack of willingness to spend money on upgrades. The front office believes that with the way the division is set up, and with the current mix of young players and recent acquisitions, the Indians are in a position to continue winning into September and beyond, depending on if and when some of the young players breakout. President of Baseball Operations Chris Antonetti also suggested that they would be willing to make midseason adjustments depending on roster needs and the market at that time.

Nevertheless, that has not sat well with the Indians fan base. It is easy to be upset when the free agent market has been as glacially slow as it has been. Let’s not forget though, prior to the team’s World Series run in 2016, the Indians opened the season with Marlon Byrd, Rajai Davis, and Collin Cowgill starting in the outfield. It is a long season and one that is full of surprises.

One of the young Indians outfielders who may be poised for a breakout season is Greg Allen. Allen was a sixth-round pick in the 2014 draft from San Diego State University. Although his 2018 slash line of .257/.310/.343 may not raise too many eyebrows, there is much more than meets the eye.

Allen played in 91 games for the Tribe last year as well as 47 for the Triple-A Columbus Clippers. He had a difficult transition to the majors partly due to the fact that from the end of spring training, he was optioned and recalled five times.

That type of uncertainty would be difficult for any player to have in the back of their head, let alone a rookie trying to find a spot on a playoff contender. Last season, Allen was twice called up for as few as two games until being optioned back to Columbus. Read the rest of this entry »


A Look into Robert Gsellman’s Curveball

Robert Gsellman of the New York Mets had a fairly average 2018. After struggles in the rotation during 2017 due to injury and ineffectiveness in facing batters a third time, as well as losing two miles per hour on his sinker compared to the previous year, Gsellman was moved into the bullpen full time. The plan initially worked, with an uptick in velocity and an improved strikeout percentage during April. Unfortunately, the rest of his season was filled with highs and lows, resulting in an 86 ERA+. However, his curveball did improve drastically in 2018.

Changes to Movement

One of the main ways Gsellman’s curve improved was his added spin rate. In 2017, his curveball had 2606 revolutions per minute, and in 2018 it was 2699 rpm. An increase in spin rate leads to an increase in the movement of the pitch. These two graphs demonstrate how this increase in spin rate translated into movement from 2017 to 2018. The first graph shows changes in vertical movement and the second one shows changes in horizontal movement.


These graphs express how Gsellman has added more bite to his curve (vertical movement from -4.3 to -6 inches) and a bit more depth to his curve. Visually, we can see this using the power of GIFs. The first GIF is his curve from 2017 and the second one is from 2018.


The 2018 curve breaks more sharply and also breaks from right to left more, as opposed to its 2017 counterpart, which is more of a tight vertical break. This added spin was most likely due to an increase in the pitch velocity increasing (80.2 mph to 81.8 mph). Read the rest of this entry »


Introducing WPA-Win: A Better Pitcher Decision Statistic

Baseball fans have seen it time and again: a starting pitcher will twirl a masterpiece, but because his team doesn’t score, he’ll be tagged with a loss. Or a reliever will come into a game, pitch to one or two batters, and end up with the win.

The vagaries of assigning wins and losses to pitchers are a well-known irritant to serious baseball fans (though perhaps not to old-timers like Bob Costas or John Smoltz). Here is the pitching decision statistic explained:

The winning pitcher is defined as the pitcher who last pitched prior to the half-inning when the winning team took the lead for the last time.

The losing pitcher is the pitcher who allows the go-ahead run to reach base for a lead that the winning team never relinquishes.

Often timing — particularly the timing of a team’s offense — affects the statistic more than a pitcher’s actual contribution to his team’s win or loss. In other words, the decision frequently fails to reflect which pitcher made the biggest difference for the winning team (or was most detrimental for the losing team). In these cases, it simply tags the pitcher lucky or unlucky enough to pitch at a certain time in the game.

In an effort to create a more accurate stat to reflect a pitcher’s contribution to his team’s win or loss, I’d like to propose new stats, which I’ll call the “WPA-Win” and “WPA-Loss.” Let’s start with the WPA-Win:

The “WPA-Win” is given to the pitcher on the winning team with the highest WPA for that game.

I’ll address how to calculate the “WPA-Loss” (which is more complicated) later in the article. For now, we’ll just assume it goes to the pitcher on the losing team with the lowest WPA. Read the rest of this entry »


The Slowest Pitcher of 2018

It is not a difficult task to recite some of the hardest throwers of 2018, such as Jordan Hicks, Luis Severino, and the like. The purpose of this article is to highlight the softest throwers of 2018. To do so, I will examine the pitcher(s) with the slowest curveball, slider, changeup, and fastball. We will ignore some less common pitches such as Steven Wright’s knuckleball (76 mph) and Hector Santiago’s rarely-used screwball (also 76 mph).

To put some modest restrictions on the analysis, the minimum is 30 innings pitched, so odd cases like Jose Reyes taking the mound are not counted.

Curveball: Kazuhisa Makita (60.0 mph)

Kazuhisa Makita signed a two-year contract with the Padres last offseason to come to the United States from Japan. Below is a clip of a 52-mph pitch in spring training. Yes, you read that correctly. 52 mph.

To add to his deceptive submarine delivery, Makita’s pitch defies the gravitational forces that would pull a pedestrian 52-mph offering to the ground, breaking just outside of the initial target. It comprises only 4.6% of his repertoire, but is at minimum a very entertaining pitch.

Slider: Kazuhisa Makita (70.6 mph)

Makita returns with a slider that edges out Brad Ziegler’s by a little under 4 mph, and he throws it just under 20% of the time. While it is interesting to see Makita take the top honor for both curveball and slider, this pattern will not perfectly hold.

Changeup: Dan Jennings (69.7 mph)

In case you were wondering, Makita comes in third, with his rarely-thrown changeup averaging 72.7 miles per hour. Here is an offering from a 2014 exhibition to Lucas Duda, then of the Mets, taken for a called third strike.

In contrast to Makita, Jennings heavily relies upon the ground ball (56.1 GB% with the Brewers last year). After bouncing around from the Marlins to the White Sox, Rays, and Brewers, he recently signed a minor-league contract with the Angels. Jennings’ most notable accomplishment last season was his one-batter start as an opener against the Cardinals, when he forced Matt Carpenter to ground out to second base.

Fastball: Kazuhisa Makita (81.2 mph)

Makita’s is king again, with a fastball that was his only pitch to register a positive value last season, so despite its pedestrian velocity, it proved to be his most effective weapon. He threw it 72.5% of the time, far beyond any other pitch. Here he is using it to strike out Trea Turner.

The location in the upper portion of the zone presents a nice contrast to the curveball from earlier.

Here again the fastball is used to complete a strikeout, this time of Ryan McMahon.

One major problem for Makita last year was his inability to keep the ball in the ballpark, even while playing half his games at Petco. He yielded a 40.4% fly-ball rate, a worse-than-average 18.4% HR/FB rate, and a resulting 5.40 ERA. As a result, he was designated for assignment this offseason and reassigned to Triple-A after clearing waivers. His 4.85 FIP and 3.71 SIERA leave some (albeit little) room for improvement, but given the modest contract he signed to come over from Japan, the Padres have little to lose in keeping the slowest pitcher in all of baseball around.