How Blake Treinen Dropped 3.15 from His ERA
Blake Treinen had an outstanding year. You know that, I know that, he knows that, and his 9-2 record, 0.78 ERA, 38 saves, and 100 strikeouts says that. But how exactly did a run-of-the-mill reliever drop more than three runs from his ERA to have one of the best reliever seasons in history? I don’t know about you, but I think that’s what this article is all about.
Let’s start with some comparable seasons. First up, we go to Hall of Famer Dennis Eckersley. He only had one season in his 24-year career that compares to the brilliance of this Treinen’s 2018 campaign. That was 1990, when Eckersley was 35 years old and compiled a 0.61 ERA in 73.1 innings pitched with, coincidentally, 73 strikeouts, as well as 48 saves in 50 opportunities.
Secondly, Zack Britton’s 2016. I’m sure you remember Britton’s amazing season: 0.54 ERA, 47 saves, 67 IP, 74 strikeouts, and zero blown saves. That season was exceptional, and I must say, better than Treinen’s.
Finally, Jonathan Papelbon’s 2006: 0.92 ERA, 35 saves, 86.1 IP, and 75 strikeouts.
And that’s it. After searching both Baseball-Reference and FanGraphs, these three seasons are the ones I can find similar to Treinen’s. None of Mariano Rivera, Lee Smith, Trevor Hoffman, or Aroldis Chapman had a season like this.
Enough with those numbers, let’s move on to other numbers.
In 2018, Trenien threw 18.3% four-seam fastballs, 11.5% cutters, 48.5% sinkers, and 21.3% sliders. That doesn’t mean much on its own, but let’s look at what he did in 2017, when he was more “decent” than “incredible” with a 3.93 ERA, 16 saves, 74 strikeouts, and 75.2 IP. Take a look at his pitch mix:

What you’re seeing is a 4% increase in fastballs as well as the introduction of a cutter, which he fired 11.5% of the time. There was a slight drop in sliders, but where did the changeups go? He completely dropped the pitch, which wasn’t a major offering in his repertoire before, in favor of the cutter.

Velocity doesn’t show much here except for a slow increase over the years, which would be expected with a pitcher who doesn’t get hurt. His cutter has premium velocity to it, and mind you, these are all averages over any given year. He picked up 1 mph on his fastball from 2017, which never hurts.
Let’s look at his heat maps. These are all from the catcher’s point of view:
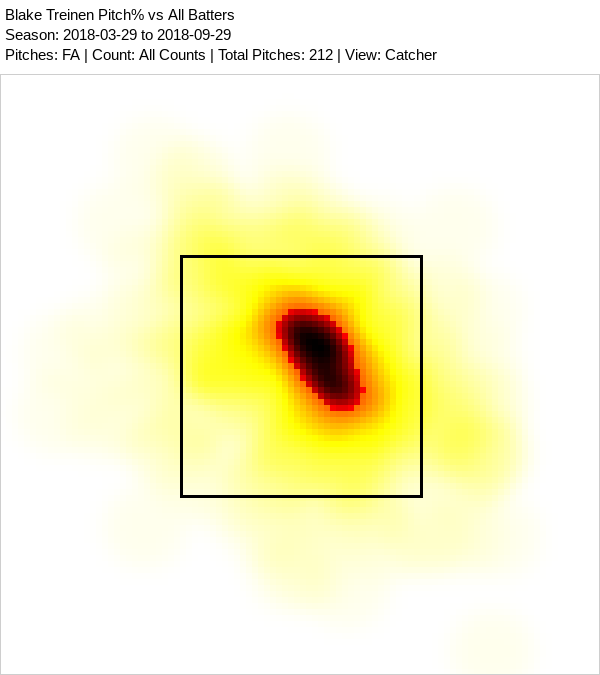
These are all his four-seam fastballs from 2018, featuring great location. A fastball at 98 mph high in the zone is almost impossible to square up. Next up is his cutter:

Again, excellent location. Some say the cutter is the hardest pitch to square up because of the late movement, which is why Mariano Rivera broke so many bats. Now his slider:

Obviously, anyone can hang a slider, but the amount of sliders that he didn’t hang is outstanding.
Here is a spray chart of his batted balls from 2017:
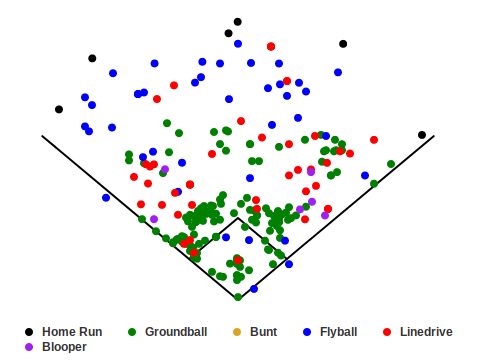
There is plenty of hard contact, line drives, fly balls, and home runs. Now his 2018 spray chart:

There are roughly the same amount of line drives, but the cutter seems to have affected the fly balls. Additionally, he allowed five home runs in 2017 but just two in 2018. This is again likely due to quality of contact.
His HR/FB rate in 2017 was 12%, and it dropped to 4.4% with the addition of the cutter. His BABIP in 2017 was a mediocre .344, and in 2018 it dropped all the way to .230.
In conclusion, I feel that the introduction of a cutter was fundamental in Blake Treinen creating weaker contact and lowering his ERA 3.15 runs on the way to a historic season.
AmbidextrousOutfielder is a journeyman writer who posts fanposts to any of the many SB Nation blogs that houses the player on whom he writes. You can find links to all his posts here.
Look at his stats before 2017 and you’ll see he was one of the most underrated players in baseball