Archive for bryce harper

The Income Tax Implications of Bryce Harper’s Choice of Next Team

At some point in the coming days or weeks or months, Bryce Harper, with an assist from Scott Boras, will make a choice as to which team he will sign a contract to play baseball with in 2019, and possibly beyond. A lot of factors will go into what his choice of team will be. It is almost certain that one of those factors will not be the city and state (i.e., local) income taxes he would be paying were he to choose this team or that.

Maybe I have that wrong. Maybe the local income tax burden will be high on a list of factors Harper considers. Maybe he’ll meticulously pore over a table showing each team’s possible effect on his overall tax bill. More likely, though, beyond the idea that a team he’s considering plays in a no-income-tax state or a super-high-income-tax state, I can’t imagine him or Boras actually stressing out over it.

That said, it is worth noting that the difference in local income taxes to be paid by Harper next year would vary widely depending on which team he chooses. And when I say “widely”, I’m talking a difference of millions. Mo’ money, mo’ taxes. Nice problem to have, amirite?

What follows is my attempt to quantify just what this difference might be, by team. Before diving in, two points.

The first point is to dispel any lingering notion that, if Bryce Harper were to choose the Texas Rangers or Seattle Mariners or Miami Marlins—come on now, stop laughing and pay attention, this is kind of important—or any other team in a no-income tax state, he would not have to pay any state income tax at all. That’s not true. In every place that levies income tax in which his team plays games, a ballplayer on a big league roster is responsible for paying them. Regardless of whether he plays 81 games at home as, for example, a member of the Astros in Houston, located in a state with no income tax, when the Astros play their 19 road games in California (top income tax rate: 13.3%), he would owe the Golden State tax on (19÷162 =) 11.7% of whatever his total salary for the year is. Same goes for all the other games in all the other taxing places his team plays in. So no matter what team Bryce Harper plays for, he’ll be paying a boatload in state income taxes to a bunch of states.

The other point is that, regardless of which team Harper ends up playing for, he’s going to pay the same in federal taxes no matter what, which makes sense. Why would his federal tax burden be any different playing in New York versus paying in Tampa Bay? Of course it wouldn’t be. Although you might be surprised to learn that even though one team plays in Canada, which obviously has a different federal income tax scheme than the US does, the tax brackets of the two countries are surprisingly similar, with Canada being even a touch lower at the top end than the US is. So, for this exercise, let’s assume that regardless of what team Harper ends up playing with, his federal tax burden to his team’s country will be the same. As such, our focus is not federal income tax; it’s only local income tax.

OK, now: to get at what the difference in local tax burden would be based given each of the thirty teams Harper could possibly play for, we had to determine how many games each team would be playing in each state in 2019. There are seventeen different states, one province and one District of Columbia (let’s call them all “states” for this piece) that are home to big league teams. Three of these states (FL, TX, WA) collect no income tax at all. Five others (CA, NY, DC, MN, Ontario) impose very high state income tax rates of at least 9% at the top end. The remaining eleven range from about 3% (PA) to 6% (GA). In addition, ten teams play in cities that levy their own income taxes, ranging from 1% (KC, STL) to a top end of 4.25% (NYC). It’s a veritable hodge-podge of Thanks For Playing Here, Now Pay Up.

To put actual numbers on this, let’s assume that Bryce Harper signs on to play for a base salary of $35 million next year. That seems as good a guess as any at this point. Personally, I think he’s probably going to sign a one-year deal for $35 million, tops. Given his inconsistent performance of the past three years, as well as testing positive for injury history, I don’t think he’ll be getting the terrain-adjusting 10/400 deal he and his agent have been craving. I think recency will make teams think twice before committing to him for so much money and so many years, so I can see Bryce wanting a shot at putting up an MVP level season in 2019 so he can get his 10/400, or even better, next winter. I won’t belabor this point anymore, since it belongs in another article anyway. Let’s just say in 2019, one way or the other, Bryce is going to sign for $35 million.

That’s not the income he’s going to be paying tax on—there will be write-offs and exemptions and deductions and the like that his first-rate tax attorneys will find, so let’s say all of that leads to an adjusted gross income for tax purposes of $30 million. That’s the number we’ll use as the basis of Bryce Harper’s state and city tax burden for next year.

Lastly, these tax estimates are based on the actual tax rates each of these states and cities levy on income earners in their jurisdictions, including the application of graduated rates where appropriate (mostly in high tax states, and in New York City). Even so, with only a few exceptions, the vast, vast majority of Bryce Harper’s income will be taxed in all these states and cities at the highest rate available.

Here’s the result, rounded off to the nearest $10,000 to make it easier to take in. Remember, these are not taxes he pays only to the city or state his team calls home—they’re taxes paid to all the jurisdictions he plays in during the season:

Potential Harper Team City Taxes State Taxes Total Local Tax
San Francisco Giants  $ 100,000  $ 3,070,000  $ 3,170,000
San Diego Padres  $ 110,000  $ 3,030,000  $ 3,140,000
Los Angeles Dodgers  $ 100,000  $ 3,000,000  $ 3,100,000
New York Yankees  $ 740,000  $ 2,250,000  $ 2,990,000
New York Mets  $ 750,000  $ 2,180,000  $ 2,930,000
Toronto Blue Jays  $ 160,000  $ 2,770,000  $ 2,930,000
Los Angeles Angels  $  80,000  $ 2,700,000  $ 2,780,000
Oakland Athletics  $ 100,000  $ 2,680,000  $ 2,780,000
Washington Nationals  $ 190,000  $ 2,200,000  $ 2,390,000
Minnesota Twins  $ 150,000  $ 2,180,000  $ 2,330,000
Baltimore Orioles  $ 580,000  $ 1,740,000  $ 2,320,000
Milwaukee Brewers  $ 170,000  $ 2,050,000  $ 2,220,000
Cincinnati Reds  $ 450,000  $ 1,680,000  $ 2,130,000
Cleveland Indians  $ 500,000  $ 1,600,000  $ 2,100,000
Philadelphia Phillies  $ 650,000  $ 1,380,000  $ 2,030,000
St. Louis Cardinals  $ 300,000  $ 1,740,000  $ 2,040,000
Kansas City Royals  $ 260,000  $ 1,720,000  $ 1,980,000
Atlanta Braves  $ 180,000  $ 1,800,000  $ 1,980,000
Pittsburgh Pirates  $ 550,000  $ 1,400,000  $ 1,950,000
Arizona Diamondbacks  $ 110,000  $ 1,810,000  $ 1,920,000
Colorado Rockies  $ 100,000  $ 1,810,000  $ 1,910,000
Boston Red Sox  $ 160,000  $ 1,660,000  $ 1,820,000
Detroit Tigers  $ 340,000  $ 1,490,000  $ 1,830,000
Chicago Cubs  $ 160,000  $ 1,570,000  $ 1,730,000
Chicago White Sox  $ 140,000  $ 1,590,000  $ 1,730,000
Tampa Bay Rays  $ 170,000  $ 1,070,000  $ 1,240,000
Miami Marlins  $ 190,000  $   940,000  $ 1,130,000
Seattle Mariners  $  90,000  $   940,000  $ 1,030,000
Houston Astros  $  90,000  $   900,000  $   990,000
Texas Rangers  $ 100,000  $   890,000  $   990,000

Holy Toledo, is this ever a huge difference. Choosing a California National League or a New York City team, just by itself and independent of anything else, will take an additional $2 million out of Bryce Harper’s pocket than choosing the Houston Astros. Are you scared yet, Yankees/Red Sox/Indians/Angels/A’s fans?

Now, to be clear, it’s not as though we should cry for Bryce Harper because of his heavy tax burden. Bryce Harper has been a multimillionaire ever since he was 17 years old. He is a very rich young man who is on his way to becoming a very wealthy young man. (If you’re unclear on the difference between being “rich” and being “wealthy”, here’s a very entertaining and very NSFW tutorial.) So let’s not feel as though we need to light any novena candles on behalf of Bryce Harper.

By the same token, even for a man as rich as Bryce Harper, $2 million is not nothing. It’s decidedly something. And remember, that’s $2 million based on one year of Bryce’s salary alone. Over the course of the kind of ten-plus year contract he’s looking for, that could well add up to over $20 million in wages lost just to local taxes, for no other reason than he might choose playing for the Dodgers over playing for the Astros. Or over playing for the Rangers or Mariners or Marlins.

You can laugh about that last one now, because math class is over.


BatCast the Bat Flip Tracker: Oh, How the Wood Was Chucked

“Make baseball fun again” is Bryce Harper‘s outcry against baseball fundamentalists who continue to police emotions and enforce baseball’s expressionless professionalism.  “Shut up and play the game right” might be something you’d hear uttered from the fundamentalist’s side — ideally through tobacco-glazed teeth — and maybe by Brian McCann.  The discourse is of course more involved than that, covering everything from retaliatory plunk balls to bat flips, and anytime something marginally inflammatory happens, it’s beaten so hard that we’re reminded how boring our lives are that we have to discuss the same things over and over and over.  I know you can picture the media package that accompanies the discourse: a young, brash, exquisitely coiffed, generational talent, who was hit in the ribs in his first ever plate appearance (then proceeded to steal home), is unabashedly passionate about a “fun” revolution in baseball.  His eye black is adorned like war paint; he has emojis on the bottom of his bats; his helmet never stays on his head when he runs the bases; and yes, he “pimps” his home runs.  Cut to Joey Bats‘ ALDS bat flip and the ensuing brawl and then connect it with Rougned Odor’s haymaker; cut to Brian McCann standing at home plate waiting for Jose Fernandez after his first career home run; then enter the commentator: “Is this wrong?”

While baseball’s moral code on gaining an edge is unpredictable, there’s always been the idea that individuals conform to the game, not the other way around.  Harper’s sermon won’t shatter the code of conduct, but it might move the needle, if it hasn’t already.  For example, I can’t think of a standout incident this season because of a bat flip.  That’s good! Because bat flips are really fun!  There’s really no need to overthink it.  There were plenty of memorable bat flips this year, and in an effort to make some fun out of baseball when there is no baseball being played, I’m breaking out my bat flip tracking equipment (a ruler, a stop watch, and a parabolic trajectory calculator) that I introduced last year, and booting up BatCast for a look back at the year’s most memorable wood-chucking moments.

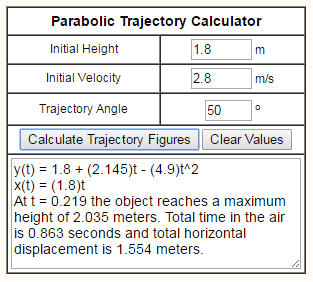
A brief recap: arriving at these numbers is a sloppy and wildly imprecise affair.  I pull videos, gifs, and stills of a bat flip and start by measuring the height of the player as he appears on my screen.  I convert that measurement into the player’s real-life size and reference this ratio, as well as measurements on the baseball field, and rough estimates, to arrive at some of the data I present to you in meters and feet: initial height, apex, and distance.  Using a stopwatch or the time stamp on YouTube, I can declare a fairly accurate hang time of the bat.  Angles are roughly noted using the batter and the ground to form a 90-degree angle and are adjusted in the parabolic trajectory calculator.

Let’s kick this off:

Exhibit A – The one that’s probably at the forefront of your mind:

Asdrubal Cabrera

Date Inning Leverage Index ΔWE% Implication
09/22/16 11 4.42 82.5% 0.5 gm ld in WC

Statcast

Exit Velocity Launch Angle Distance
102 mph 28.50 393 ft

Le Flip

asdrubalbatflip092216

How about in slow motion?

092216_asdrubal_walkoff_slomo_med_m9up6w4p 

Ejaculatory!

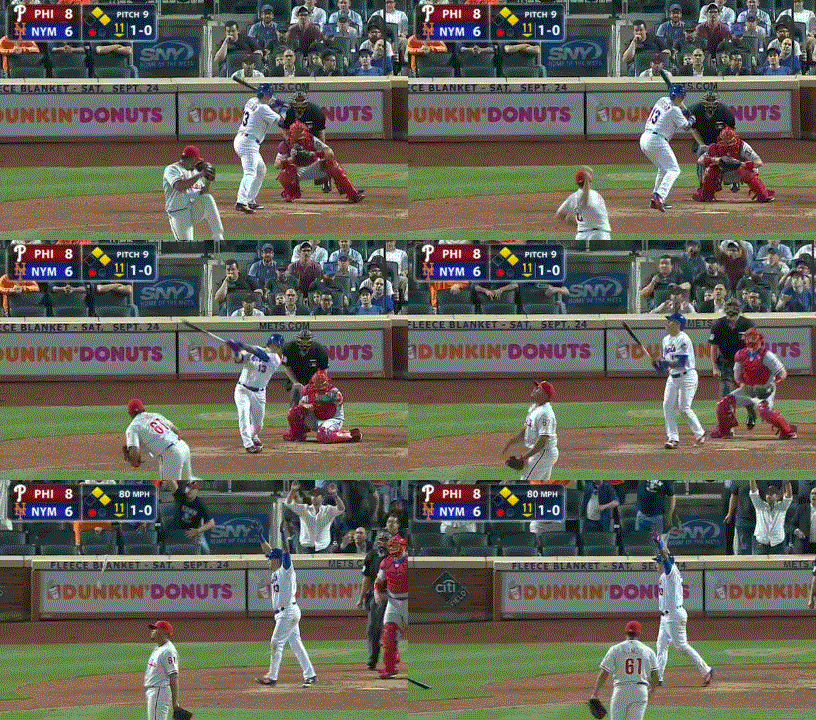
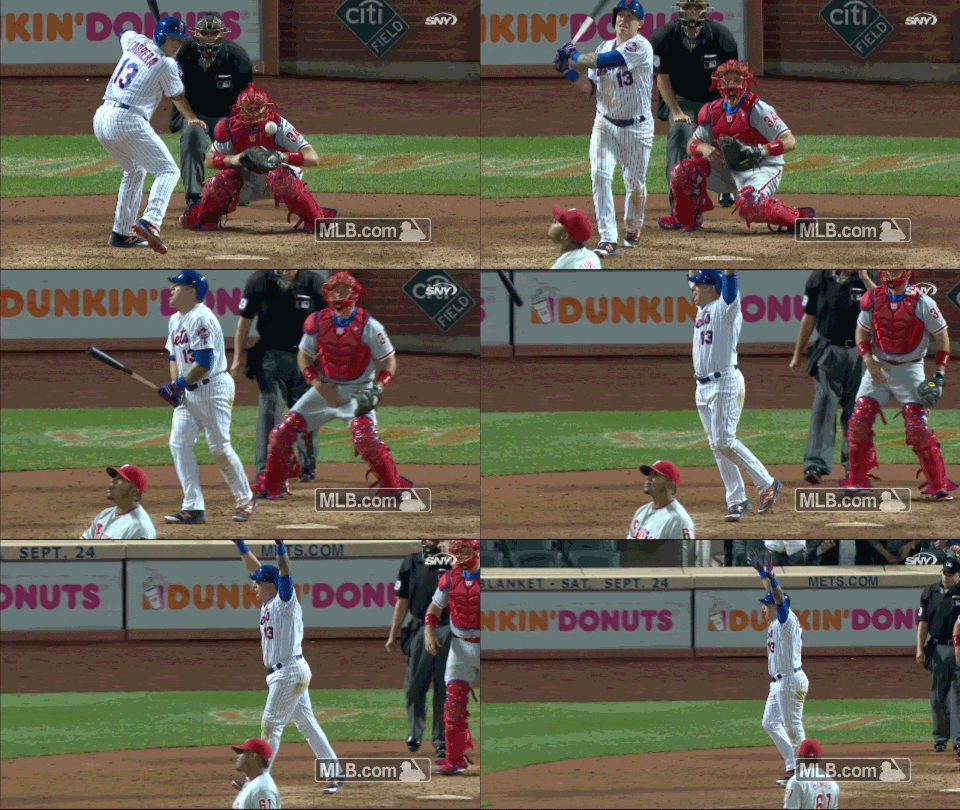
How many of his teammates do you think saw that flip?  They may have seen the tail end of it, but I’m willing to bet zero saw the flip in its entirety because everyone in the dugout was gazing at the ball in flight.  But this was a no-doubter.  Edubray Ramos resigned to the outcome likely before the ball had reached its apex.  The Phillies weren’t playing for anything at this point, but the Mets?  Before this pitch, the Mets were tied with the Giants and Cardinals for the top wild-card spot.  Before this pitch, in the 9th inning, Jose Reyes erased a two-run deficit with a home run of his own, only to see that lead given up again when Jeurys Familia and Jim Henderson allowed two runs to score in the top of the 11th.  After this pitch, this game ended and they had a half-game lead on any team in the National League for the first wild-card spot.  That bat flip is a team effort.  There’s some “I did it” in there, but the way he looks towards the dugout and offers his bat up towards his teammates makes this feel like “We did it!”

The numbers:

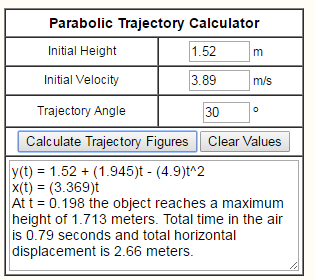
Cabrera is listed as 6′ tall.  On the freeze frame I measured, he’s 1.9″ tall.  So our key tells us that 1″ on the screen is 37.9″ in real life.  When he releases the bat, he does so from about shoulder height and we’ll call 5′ (1.52 m) in real life.  The acme is, it appears, not a great deal lower than the top of Asdrubal’s head, so we’ll tally that down at 5′-7″ (1.71 m).  To me, the launch angle looks to be right around 30 degrees, and we’ll refine this number once we get them in the parabolic trajectory calculator.  The duration of flight I’m using is the average number I’ve come up with through timing the video 10 times — 0.79 seconds.

Parabolic Trajectory Calculator:

ptraj

BatCast

Exit Velocity Launch Angle Acme Distance
8.7 mph 30 Deg 5’-7” 8’-9”

Exhibit B – A Man Possessed:

Matt Adams

Date Inning Leverage Index ΔWE% Implication
07/22/16 16th 1.71 42.7% 2nd straight walk-off for Cardinals

Statcast

Exit Velocity Launch Angle Distance
105.8 mph 28.34 444 ft

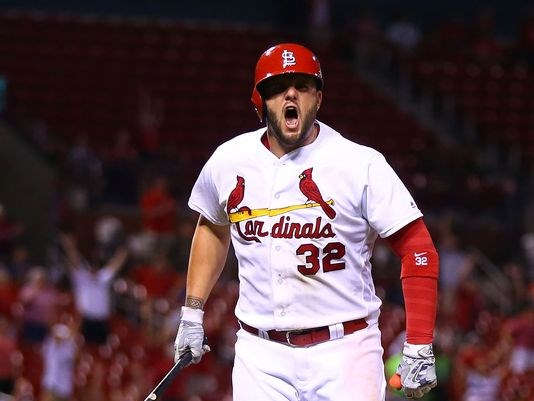
636048353090779282-gty-579171664-83514488_1469294083291_4281277_ver1-0

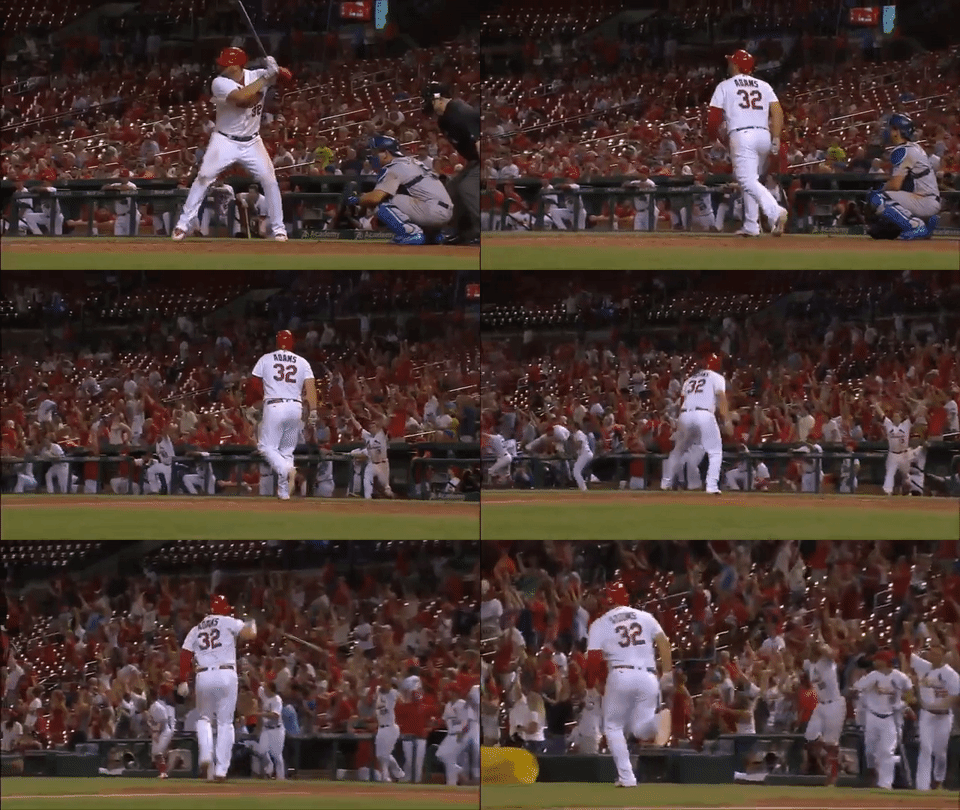
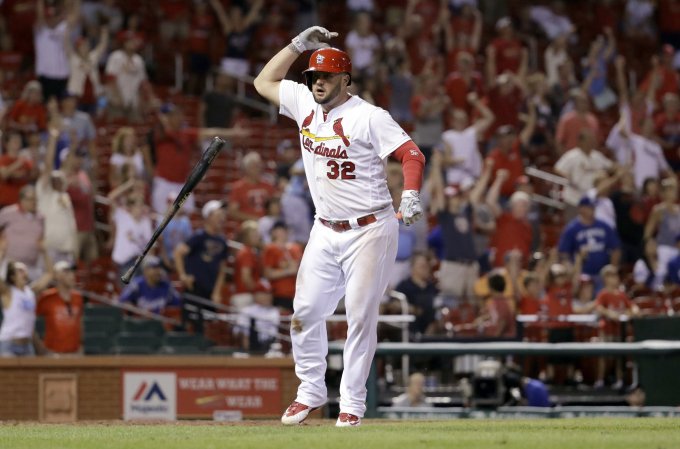
If this picture was part of an emotional intelligence quiz, I’m sure the answers given as to what facial expression is being displayed would vary greatly.  To accurately assess the information in this picture it may behoove one to understand that, in baseball, home teams wear white and that the man in the background is most likely a fan of the home team and that his hands are held high in jubilation.  If you’re only looking at the horrifying ogre in the foreground who appears to be screaming at 67 Hz+, the pitch only a dog can hear, you’d be hard-pressed to say that is a happy man.  In fact, he may not be happy yet — he’s likely evoking a form of relief, having just exorcised the demons one faces when up to bat in the 16th inning of a tie baseball game; he looks like pure adrenaline.  Most of us don’t get to experience a moment like this in our lifetime so we don’t have a really strong reference point for what he’s feeling, but luckily you know what this article is about and there’s a gif:

giphy

PUMP! PUMP! PUMP IT UP!

That’s all lizard brain right there.  It’s a little undignified, but that’s the beauty of it.  Matt Adams is a dense, hulking man, and that makes it a little scarier and a little sillier.  Look:

matt-adams-b809f422f7cc9370

Sassy.

The numbers:

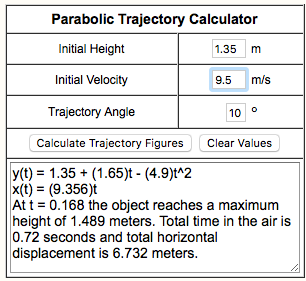
This one is especially hard to measure because of Adams’ primitive (yet graceful) movements.  I extracted these numbers using the still image and the video:

screen-shot-2016-11-28-at-10-04-38-pm

BatCast

Exit Velocity Launch Angle Acme Distance
20.6 mph 10 Deg 4’-11” 22’-1”

Exhibit C – Into the Batosphere

Yoenis Cespedes

Date Inning Leverage Index ΔWE% Implication
08/29/16 10th 1.23 47.0% The first baseball bat in outer space (for America – Korea has several).

Statcast

Exit Velocity Launch Angle Distance
101.9 mph 28.33 416 ft

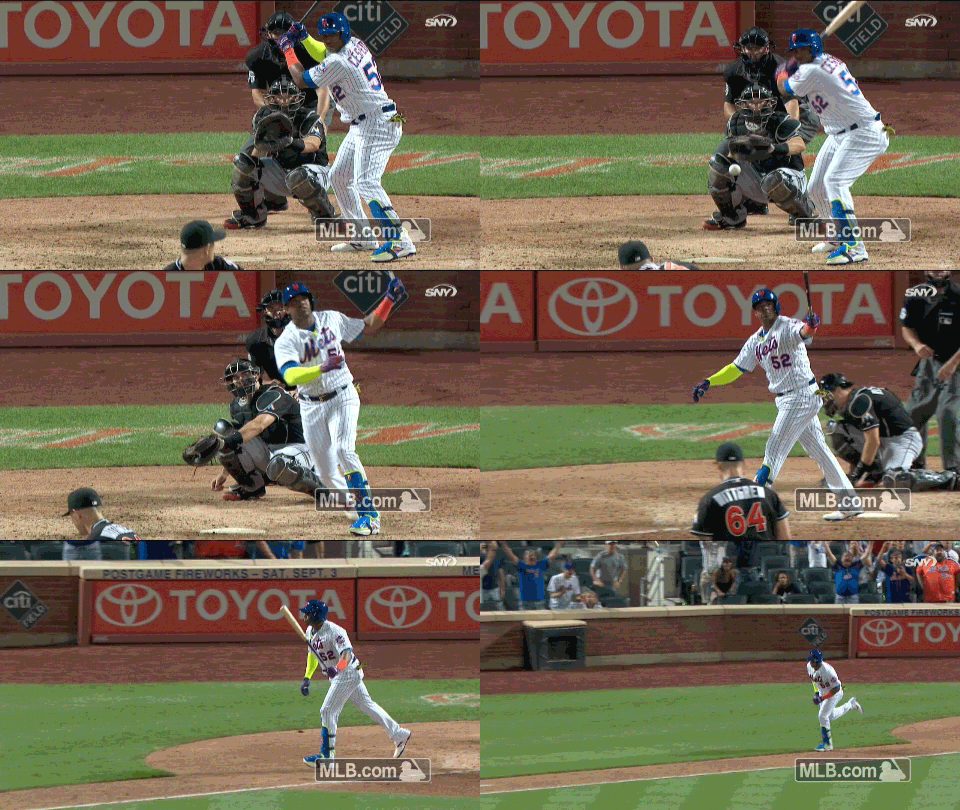
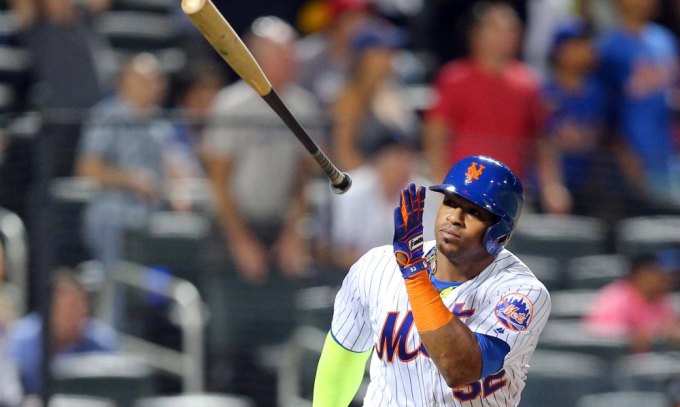
Yoenis Cespedes made it into my BatCast segment last year with his nifty flip in the NLDS.  This flip follows a similar trajectory but he varies his look this time with a cross-bodied toss.  It’s rude:

082916_cespedes_bat_toss_med_k3thrcyn (1).gif

“Hold my drink, bitch.”

While the lesson here is obvious, the mistake is not as easily avoided: get the fastball ball UP and in on Cespedes.

plot_h_profile

Because of the evidence we have, the numbers for this bat flip will be even more rough than the others — by the way, I hope you’re not a mathematician, and I apologize if you are.  The data we can gather is the launch angle and at what time stamp the bat reaches it’s highest point.  Here’s a better view of the angle:

USP MLB: MIAMI MARLINS AT NEW YORK METS S BBN USA NY

Can we agree on shoulder height for the initial launch height to make things easier?   Let’s call it 5′ since Cespedes is 5′-10″.  We’ll say the bat was launched at a 70-degree angle and in the gif the bat appears to reach it’s apex at just before 0.4 seconds.

BatCast

Exit Velocity Launch Angle Acme Distance
9.2 mph 70 deg 12’-6” 4’-11”

Exhibit D – The “I probably didn’t even need this bat to hit this home run” flip

Bryce Harper

Date Inning Leverage Index ΔWE% Implication
09/10/16 8th 3.63 30.5% Bryce’s helmet probably won’t fall off when he’s running the bases.
Statcast
Exit Velocity Launch Angle Distance
99.7 mph 26.39 377 ft

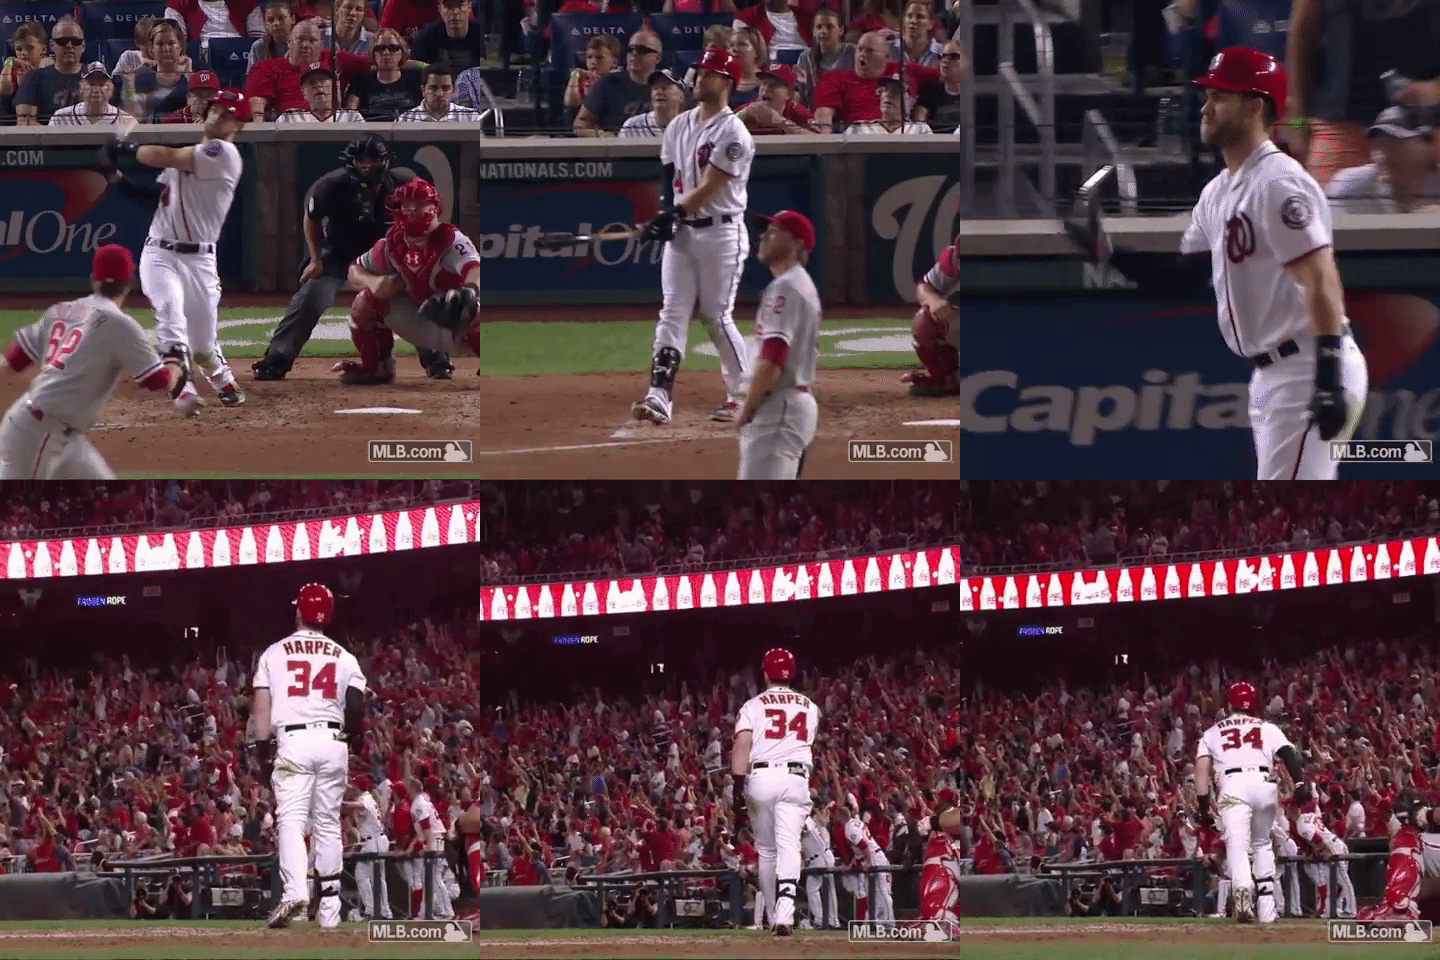
After my long-winded intro it’s fitting to get to feature Bryce Harper in this piece.  He probably didn’t have as much fun this year as he did in 2015, but he appears to have gotten some enjoyment out of this shot.
wp-1480462655679.gif

Correct me if I’m wrong, but I believe that is what the kids call “Swagadoscious.”  I’ll just get right to the point this time.

bharpflipp


BatCast

Exit Velocity Launch Angle Acme Distance
6.3 mph 50 deg 6’-8” 5’-1”

Those are the ones that stuck out to me as the best flips of the year and I hope you were able to move past the rough estimates and get some enjoyment out of that as well.  I should note that Joc Pederson’s bat flip in the NLDS is omitted because I cannot find substantial evidence of an acme or distance.  And while a lefty going across his body like he did is pretty exotic, the uncertainty he exudes, combined with his panicked sashay, makes this effort pretty uncool.

pedersonbattoss_echl1ngh_il9khrdi

(Scherzer looks super imposed here)

So what can we pretend to glean from this?  Based on WPA, it’s probably not surprising that Harper had the most disproportionate bat flip.  Looking at the Statcast data, Harper’s home run was also the “weakest” out of the group.  So I guess even if Bryce Harper says what he says just so he can get away with being a little douchey, he’s holding up his part of the deal.  Of course, bat flips aren’t what make baseball fun.  Baseball is fun because we can see so much of our own lives in the game — it’s the humanity.  It provokes endless curiosity and it will reward you if you know where to look.  It’s the only game that can end, not because of time, but with one swing, and flip, of the bat.

Don’t be afraid to clue me in to bat flips in the future — my Twitter handle is in my bio (below).


Should Bryce Harper Swing and Miss More?

Well, here we are: Over 100 games into the season and Bryce Harper has yet to break out of his slump. When Bryce came to the Majors back in 2012 he was one of the most hyped prospects since Alex Rodriguez broke into the bigs as a 19-year-old shortstop. The pressure, I’m sure, was immense, and through his first three seasons Harper had put up good numbers, but had yet to establish himself as the superstar we all thought he’d be. Something clicked in 2015 though, as he posted an amazing 9.5 WAR, 197 wRC+, and 0.461 wOBA, all best in the MLB by a fair margin. We all thought he’d done it, he had exceeded expectations and was ready to join Mike Trout as one of the most exciting, talented, and productive players in the game. His 1.5 WAR, 180 wRC+, and 0.443 wOBA through April of 2016 merely affirmed this sentiment.

Here we are. 2.8 WAR, 115 wRC+, and 0.346 wOBA. To be fair, these are by no means terrible numbers. He is still creating runs at a decently better rate than the average MLB player, with much of the credit going towards his MLB-leading 18.2 BB% and his 0.214 ISO. His defense has also been very good this year, helping to raise his WAR to 41st in the MLB. No, I am not saying Harper is a bad player, I’m just saying he is worse than the Bryce Harper we saw in 2015. We were all ready to call him a superstar (heck, we even voted him into a starting spot at this year’s All-Star Game), but now he’s taken this step back and we have no choice now but to start questioning his superstar status. Let’s take a look both at what might be causing this slump, and what Bryce could do to bust out of it (if anything at all).

The stat that jumps out at me most is his BABIP. The MLB average is exactly 0.300 this year, and Bryce has a career mark of 0.317. Bryce isn’t too far into his career, and while it’s possible that his 0.369 BABIP last season was an anomaly, it’s certainly safe to say that Bryce is definitively above average in this area. This season his BABIP has dipped down to 0.234, good enough for second to last in the MLB, ahead of only Todd Frazier (0.203). BABIP has a great degree of luck involved, in that some hitters with higher BABIPs might just get lucky (e.g. hit a little bloop into shallow right field that drops for a hit), or might be playing poor defenses (e.g. Jason Heyward would have caught that little bloop, but Jose Bautista was in right field and missed it by a foot). I believe, though, that going from 0.369 in 2015 to 0.234 in 2016 is enough of a differential to at least form the hypothesis that Bryce is struggling beyond just facing better defenses and getting less breaks.

One of the keys to figuring out this drop in production is figuring out what has changed from last year. Obviously his BABIP has declined, but why? For the  most part, pitchers are throwing him the same types of pitches at the same rates, and are throwing pitches in/out of the zone at the same rates as well. He has almost the exact same swing% on pitches outside the zone, but there’s about a 5% decrease in his swing% on pitches in the zone; nothing monumental, but something we ought take note of. The greatest changes that may be observed are in his batted ball numbers, shown here:

Year LD% GB% FB% IFFB% HR/FB GB/FB Pull% Center% Opposite% Soft% Medium% Hard%
2015 22.2 38.5 39.3 5.8 27.3 0.98 45.4 33.8 20.8 11.9 47.2 40.9
2016 14.3 41.4 44.4 11.0 16.9 0.93 40.9 33.5 25.7 22.7 45.4 32.0

We can almost construct a narrative from these numbers: He’s hitting balls soft significantly more often, and he’s also hitting less line drives. Soft ground balls and fly balls are easier to convert into outs, and his infield fly ball% increase implies that he is hitting fly balls with less power. This explains why his home run rate is down. Where he was previously hitting hard line drives and grounders, and turning fly balls into home runs, he is now hitting softer, more easily-fielded grounders and popups, resulting in a steep decline in BABIP.

But this isn’t a cause, it’s a symptom. Again, we are forced to ask why it is that Bryce isn’t hitting balls as hard, and why he’s hitting less line drives? Bryce has been known for having great plate discipline, something that generally hasn’t changed over the last two years. At the surface, we see that he still has a very high walk rate, lays off pitches outside of the zone, and is one of the more patient hitters in baseball. However, one stat that caught my eye was his contact% on pitches outside the zone (and even inside the zone). His O-contact% went from 60.9% to 67.4%, and even his Z-contact% increased from 84.4% to 87.7%. This can be visualized here:

For the 2015 season

Bryce Harper Contact% vs All Pitchers
Season: 2015-04-06 to 2015-10-04 | Count: All Counts | Total Pitches: 2619 | View: Catcher
100 %
44 %
50 %
39 %
51 %
61 %
75 %
72 %
80 %
88 %
100 %
70 %
59 %
66 %
78 %
80 %
88 %
91 %
95 %
77 %
77 %
78 %
84 %
87 %
91 %
98 %
97 %
71 %
71 %
79 %
83 %
87 %
90 %
90 %
93 %
96 %
75 %
85 %
88 %
88 %
88 %
92 %
88 %
82 %
76 %
80 %
83 %
84 %
84 %
85 %
81 %
77 %
81 %
74 %
79 %
76 %
79 %
78 %
75 %
52 %
73 %
64 %
66 %
68 %
70 %
73 %
60 %
25 %
27 %
26 %
0 %

And for the 2016 season

Bryce Harper Contact% vs All Pitchers
Season: 2016-04-04 to 2016-07-28 | Count: All Counts | Total Pitches: 1616 | View: Catcher
100 %
60 %
100 %
75 %
23 %
45 %
76 %
89 %
97 %
100 %
100 %
82 %
75 %
59 %
70 %
89 %
97 %
100 %
100 %
71 %
77 %
80 %
86 %
91 %
98 %
100 %
100 %
63 %
73 %
79 %
78 %
84 %
92 %
99 %
100 %
100 %
67 %
74 %
86 %
84 %
88 %
86 %
95 %
99 %
100 %
69 %
84 %
82 %
85 %
89 %
91 %
85 %
89 %
84 %
81 %
74 %
81 %
81 %
86 %
68 %
35 %
88 %
79 %
74 %
70 %
78 %
74 %
69 %
50 %
40 %
39 %
0 %

There are two ways to look at this: The types of pitches Bryce is seeing, and the counts he’s getting himself into. All of this revolves around where pitchers are throwing pitches, where he’s swinging, and where he’s making contact. As you can clearly see, Bryce has been making a tangibly higher amount of contact this season. Logically, it makes sense to say that he is taking more pitches in the zone, and making weak contact where he used to just swing and miss. But that can’t be the whole story, can it? In attempting to find differences between this season and last, I merely found that regardless of what the count was, Harper was always making more contact; it didn’t matter if he was ahead, behind, or even. He was also making more contact regardless of what pitches were being thrown.

Let’s start with the types of pitches Bryce sees. We’ll split it up into fastballs (which includes 4-seamers, 2-seamers, and cutters), and secondary pitches (curveballs, sliders, and changeups). With secondary pitches, pitchers have begun to come into the zone a bit more than they used to. These charts show where pitchers are throwing Bryce non-fastballs:

2015

Bryce Harper Pitch% vs All Pitchers
Pitches: CH, CU, SL
Season: 2015-04-06 to 2015-10-04 | Count: All Counts | Total Pitches: 877 | View: Catcher
0.5 %
0.2 %
0.2 %
0.6 %
0.4 %
0.2 %
0.3 %
0.4 %
0.3 %
0.2 %
0.1 %
0.7 %
0.7 %
0.5 %
0.4 %
0.5 %
0.5 %
0.3 %
0.2 %
0.8 %
0.9 %
1.1 %
0.9 %
0.6 %
0.7 %
0.5 %
0.2 %
1.2 %
1.0 %
1.4 %
1.6 %
1.6 %
1.1 %
0.7 %
0.5 %
0.3 %
0.1 %
1.5 %
1.6 %
2.0 %
2.0 %
1.4 %
1.0 %
0.7 %
0.3 %
1.7 %
2.1 %
2.0 %
1.9 %
1.7 %
1.2 %
1.0 %
0.7 %
1.8 %
2.1 %
2.3 %
2.3 %
1.8 %
1.3 %
0.8 %
0.7 %
1.6 %
1.9 %
2.0 %
2.0 %
2.1 %
1.4 %
0.8 %
0.5 %
2.9 %
3.0 %
2.1 %

2016

Bryce Harper Pitch% vs All Pitchers
Pitches: CH, CU, SL
Season: 2016-04-04 to 2016-07-28 | Count: All Counts | Total Pitches: 579 | View: Catcher
0.7 %
0.4 %
0.2 %
0.4 %
0.5 %
0.5 %
0.5 %
0.7 %
0.5 %
0.3 %
0.2 %
0.6 %
0.6 %
0.7 %
0.7 %
0.7 %
0.6 %
0.4 %
0.2 %
1.2 %
1.1 %
0.9 %
0.9 %
0.8 %
0.7 %
0.5 %
0.2 %
1.1 %
1.5 %
1.7 %
1.5 %
1.5 %
1.3 %
0.6 %
0.6 %
0.4 %
0.2 %
2.0 %
2.4 %
2.2 %
2.0 %
2.0 %
1.2 %
0.5 %
0.4 %
2.0 %
2.9 %
2.9 %
2.4 %
2.0 %
1.4 %
0.7 %
0.5 %
1.5 %
2.3 %
2.8 %
2.5 %
2.0 %
1.3 %
1.1 %
0.9 %
1.3 %
2.0 %
2.5 %
2.6 %
2.0 %
1.3 %
1.1 %
1.1 %
2.4 %
3.1 %
0.9 %

It is by no means a huge difference, but it’s still there. Obviously, pitchers are still mostly throwing him non-heaters down and away, they’re just getting them in the zone more frequently. How does Bryce respond to this change? Well, he’s been laying off the low pitch a bit more, and instead has attempted to hit the inside pitch. These are his swing percentages on secondary pitches:

2015

Bryce Harper Swing% vs All Pitchers
Pitches: CH, CU, SL
Season: 2015-04-06 to 2015-10-04 | Count: All Counts | Total Pitches: 877 | View: Catcher
0 %
14 %
0 %
19 %
30 %
33 %
37 %
13 %
40 %
43 %
0 %
22 %
44 %
47 %
52 %
42 %
41 %
53 %
22 %
27 %
60 %
71 %
60 %
61 %
61 %
50 %
27 %
12 %
33 %
69 %
79 %
76 %
73 %
83 %
78 %
50 %
0 %
50 %
67 %
82 %
77 %
77 %
84 %
88 %
58 %
57 %
65 %
81 %
88 %
77 %
72 %
75 %
69 %
45 %
64 %
75 %
82 %
79 %
67 %
53 %
49 %
25 %
53 %
61 %
65 %
60 %
68 %
43 %
44 %
20 %
33 %
13 %

2016

Bryce Harper Swing% vs All Pitchers
Pitches: CH, CU, SL
Season: 2016-04-04 to 2016-07-28 | Count: All Counts | Total Pitches: 579 | View: Catcher
8 %
0 %
0 %
7 %
19 %
24 %
22 %
50 %
80 %
67 %
0 %
16 %
28 %
30 %
34 %
60 %
75 %
85 %
33 %
36 %
41 %
52 %
56 %
71 %
89 %
89 %
60 %
8 %
40 %
55 %
66 %
76 %
72 %
83 %
93 %
60 %
50 %
39 %
60 %
73 %
75 %
73 %
58 %
64 %
77 %
44 %
56 %
73 %
69 %
72 %
67 %
56 %
53 %
52 %
50 %
67 %
70 %
71 %
59 %
56 %
47 %
54 %
52 %
50 %
58 %
54 %
46 %
51 %
53 %
13 %
30 %
18 %

This also means that those non-fastballs are being called as strikes more frequently (assuming that umpires are generally going to call pitches in the zone as strikes). As we can see in his contact% charts, this season Bryce has been making contact at an extremely high rate on those high and inside pitches, and softer pitches have been absolutely no exception. In fact, he’s been making contact with the high and inside non-heaters more than he is with high and inside fastballs. What are the implications of this? Let’s look at his slugging% against secondary pitches:

2015

Bryce Harper SLG/P vs All Pitchers
Pitches: CH, CU, SL
Season: 2015-04-06 to 2015-10-04 | Count: All Counts | Total Pitches: 877 | View: Catcher
.000
.000
.000
.000
.000
.000
.000
.000
.000
.000
.000
.000
.044
.059
.065
.121
.091
.000
.000
.154
.151
.244
.222
.196
.217
.077
.000
.000
.254
.477
.357
.458
.173
.113
.062
.000
.000
.160
.469
.503
.503
.282
.111
.047
.000
.209
.218
.349
.475
.285
.109
.042
.000
.176
.207
.222
.353
.201
.061
.018
.000
.049
.098
.108
.246
.147
.024
.000
.000
.009
.040
.000

2016

Bryce Harper SLG/P vs All Pitchers
Pitches: CH, CU, SL
Season: 2016-04-04 to 2016-07-28 | Count: All Counts | Total Pitches: 579 | View: Catcher
.000
.000
.000
.000
.000
.000
.056
.100
.200
.333
.000
.000
.000
.030
.094
.143
.083
.308
.167
.045
.122
.214
.146
.146
.056
.056
.200
.042
.085
.084
.325
.203
.069
.029
.000
.000
.000
.039
.040
.065
.108
.062
.000
.000
.000
.093
.091
.105
.101
.175
.077
.000
.000
.190
.152
.113
.203
.167
.094
.000
.000
.086
.116
.078
.067
.092
.037
.000
.000
.000
.014
.000

Slugging% is by no means a perfect measure of a hitter’s ability. Yet, in this case, it gives us a decent idea of which locations a hitter is making solid contact. In his 2015 campaign he was able to get his arms extended and drive curveballs with great power. This season he is attempting to pull the ball more, and it’s resulting in weaker contact. While he is able to drive the inside breaking ball at a pretty decent rate, I suspect that he’s opening up his stance, which can occasionally result in a hard-hit ball, but will often result in a weak fly ball to the opposite field, or a weak grounder to the pull side. The fact that he’s swinging so much more frequently at inside pitches would also be reason to guess that as he’s swinging at breaking balls out over the plate he is still attempting to pull them, as opposed to going with the pitch. Further evidence of this comes from looking at how he hits breaking balls from lefties (curving away from him), versus how he hits them from righties (curving towards him).

2015

Bryce Harper SLG/P vs L
Pitches: CH, CU, SL
Season: 2015-04-06 to 2015-10-04 | Count: All Counts | Total Pitches: 287 | View: Catcher
.000
.000
.000
.000
.000
.000
.000
.000
.000
.000
.000
.067
.111
.182
.118
.000
.000
.000
.400
.238
.345
.450
.320
.067
.000
.000
.000
.667
.846
.417
.711
.345
.154
.000
.000
.000
.214
.727
.444
.450
.314
.300
.095
.000
.070
.174
.279
.417
.188
.182
.120
.000
.083
.042
.130
.508
.361
.133
.077
.000
.028
.020
.000
.219
.320
.071
.000
.000
.000
.000
.000


Bryce Harper SLG/P vs R
Pitches: CH, CU, SL
Season: 2015-04-06 to 2015-10-04 | Count: All Counts | Total Pitches: 590 | View: Catcher
.000
.000
.000
.000
.000
.000
.000
.000
.000
.000
.000
.033
.040
.000
.125
.222
.000
.000
.095
.115
.184
.116
.077
.500
.182
.000
.000
.164
.361
.333
.341
.077
.074
.182
.000
.000
.136
.379
.525
.520
.265
.000
.000
.000
.292
.248
.390
.500
.314
.068
.000
.000
.234
.310
.272
.278
.148
.048
.000
.000
.067
.145
.163
.255
.108
.015
.000
.000
.027
.048
.000

He even seems to do better against lefties. Against both of them, however, he clearly is able to see the pitch that will eventually break across the middle/outer half of the plate, and drive it with power. Let’s head over to 2016:

Bryce Harper SLG/P vs L
Pitches: CH, CU, SL
Season: 2016-04-04 to 2016-07-28 | Count: All Counts | Total Pitches: 180 | View: Catcher
.000
.000
.000
.000
.000
.000
.000
.500
.500
.000
.000
.000
.000
.000
.000
.100
.571
.200
.000
.087
.211
.125
.000
.000
.100
.333
.000
.000
.059
.312
.400
.118
.000
.000
.000
.000
.033
.071
.121
.059
.000
.000
.000
.029
.057
.096
.027
.000
.000
.000
.000
.029
.096
.109
.053
.000
.000
.000
.000
.000
.037
.077
.045
.000
.000
.000
.000
.000
.000
.000


Bryce Harper SLG/P vs R
Pitches: CH, CU, SL
Season: 2016-04-04 to 2016-07-28 | Count: All Counts | Total Pitches: 399 | View: Catcher
.000
.000
.000
.000
.000
.000
.167
.200
.000
.000
.000
.000
.045
.214
.294
.071
.000
.000
.083
.154
.217
.156
.222
.091
.000
.000
.053
.125
.102
.333
.102
.049
.043
.000
.000
.000
.052
.043
.062
.103
.065
.000
.000
.000
.150
.109
.109
.129
.222
.129
.000
.000
.393
.192
.115
.257
.205
.120
.000
.000
.158
.153
.078
.072
.108
.043
.000
.000
.000
.016
.000

While his production has decreased against both righties and lefties, it is clear that the disparity is much larger when it comes to lefties. This is because Bryce is able to get away with trying to pull the ball against righties, as the ball is curving towards him. This makes pulling the ball a much more natural motion. Against lefties, the only breaking balls he is hitting are the ones that start inside and break right to the inside part of the plate, and the pitches that break to be right down the middle. It is the non-fastballs that are low and on the outer part of the plate that he is unable to drive, especially the ones being thrown by lefties. He’s opening up more, which also explains why his pull% hasn’t gone up (in fact it’s gone down). When he’s open, it’s hard to drive the outside pitch even if you make contact with it intending to hit it to the opposite field. Instead, he’s making that weak contact that results in outs.

Looking solely at secondary pitches, the narrative becomes: Bryce is taking the pitches that are out over the plate, and is instead swinging at pitches that are high and inside. He has a tendency to attempt to open up to the ball, and while he can sometimes get away with it against righties, lefties have been able to essentially shut him down. He is also making much more contact with all of these pitches, meaning that he’s putting more balls in play, yes, but they are weak balls that are easy to field, and are thus resulting in outs. With this mindset, even trying to hit the ball to the opposite field becomes more difficult, and all of this culminates in a lower BABIP.

Next, let’s look at how he’s handling fastballs. One thing that quickly becomes evident is the fact that Harper has been swinging at fastballs a lot less this year, especially ones up in the zone.

2015

Bryce Harper Swing% vs All Pitchers
Pitches: FA, FC, FT
Season: 2015-04-06 to 2015-10-04 | Count: All Counts | Total Pitches: 1443 | View: Catcher
3 %
26 %
11 %
38 %
67 %
77 %
90 %
88 %
59 %
33 %
22 %
45 %
65 %
79 %
89 %
91 %
78 %
56 %
38 %
34 %
66 %
79 %
87 %
88 %
78 %
56 %
52 %
7 %
35 %
63 %
78 %
80 %
81 %
75 %
54 %
46 %
0 %
37 %
52 %
70 %
70 %
70 %
61 %
46 %
43 %
27 %
43 %
51 %
59 %
59 %
52 %
31 %
25 %
12 %
28 %
42 %
45 %
51 %
47 %
29 %
11 %
11 %
13 %
30 %
31 %
29 %
30 %
26 %
9 %
6 %
6 %
7 %

2016

Bryce Harper Swing% vs All Pitchers
Pitches: FA, FC, FT
Season: 2016-04-04 to 2016-07-29 | Count: All Counts | Total Pitches: 888 | View: Catcher
4 %
25 %
9 %
6 %
27 %
50 %
54 %
66 %
58 %
50 %
22 %
32 %
46 %
67 %
75 %
77 %
68 %
58 %
35 %
42 %
66 %
80 %
72 %
74 %
74 %
59 %
32 %
7 %
42 %
61 %
78 %
76 %
68 %
73 %
64 %
35 %
0 %
35 %
53 %
66 %
76 %
79 %
72 %
59 %
38 %
24 %
45 %
52 %
63 %
67 %
57 %
35 %
21 %
12 %
34 %
45 %
48 %
42 %
30 %
15 %
3 %
4 %
23 %
33 %
42 %
43 %
26 %
20 %
6 %
0 %
13 %
0 %

His swing% on fastballs in other areas of the zone is roughly the same; it’s really just those high and down-the-middle fastballs that he’s suddenly laying off of more. And yet, just as with non-fastballs, Harper still has been managing to make more contact this year, especially on pitches high and inside, as well as pitches low and out of the zone. How has that translated in terms of his slugging%?

2015

Bryce Harper SLG/P vs All Pitchers
Pitches: FA, FC, FT
Season: 2015-04-06 to 2015-10-04 | Count: All Counts | Total Pitches: 1443 | View: Catcher
.017
.070
.000
.013
.000
.037
.206
.155
.297
.154
.000
.094
.189
.136
.117
.234
.176
.187
.088
.046
.247
.466
.236
.257
.257
.140
.167
.011
.018
.088
.239
.319
.226
.236
.176
.162
.000
.034
.116
.227
.279
.303
.169
.176
.092
.027
.082
.246
.234
.265
.135
.050
.056
.055
.063
.181
.214
.217
.105
.011
.000
.022
.044
.118
.137
.095
.086
.000
.000
.016
.028
.000

2016

Bryce Harper SLG/P vs All Pitchers
Pitches: FA, FC, FT
Season: 2016-04-04 to 2016-07-29 | Count: All Counts | Total Pitches: 888 | View: Catcher
.000
.000
.000
.000
.000
.000
.000
.000
.060
.100
.000
.018
.169
.115
.000
.000
.038
.226
.176
.063
.145
.277
.067
.000
.012
.057
.107
.000
.090
.161
.103
.077
.068
.107
.062
.019
.000
.099
.143
.161
.101
.135
.336
.148
.042
.096
.107
.248
.318
.256
.318
.167
.032
.027
.040
.173
.352
.196
.101
.067
.000
.000
.000
.034
.170
.159
.018
.000
.000
.000
.000
.000

What immediately jumps out at you is the large hole in the top part of the zone this year where Bryce is generating virtually no production. His production on low fastballs is closer to on par with last season, but up in the zone (the same area where he isn’t swinging nearly as often) he can’t get anything going. Why is this? With fastballs it’s a little more simple than with breaking balls in some aspects: For whatever reason he’s laying off fastballs in the zone, and he’s making weak contact with fastballs both high and inside, and down and away (which is where pitchers throw him fastballs most frequently). He’s giving pitchers more opportunities to throw fastballs out of the zone too. The big question mark comes at why he can’t do anything with those high fastballs specifically?

The answer isn’t too straightforward, but I do think that a large part of it is what types of pitches Bryce swings at in which counts. See, there is a very large differential in Bryce’s swing% in counts with no strikes between last year and this year, whereas in two-strike counts his swing% is about the same. He is taking more pitches when he has no strikes against him, especially the high fastball:

2015

Bryce Harper Swing% vs All Pitchers
Pitches: FA, FC, FT
Season: 2015-04-06 to 2015-10-04 | Count: 0 Strikes | Total Pitches: 611 | View: Catcher
0 %
21 %
33 %
29 %
52 %
56 %
75 %
73 %
20 %
38 %
50 %
30 %
51 %
68 %
79 %
83 %
58 %
40 %
33 %
23 %
56 %
71 %
79 %
80 %
58 %
49 %
33 %
7 %
28 %
56 %
72 %
68 %
71 %
65 %
40 %
23 %
0 %
30 %
36 %
58 %
57 %
60 %
55 %
49 %
20 %
25 %
28 %
31 %
41 %
45 %
40 %
32 %
18 %
8 %
21 %
27 %
27 %
35 %
31 %
24 %
15 %
9 %
9 %
21 %
17 %
15 %
16 %
11 %
14 %
3 %
8 %
0 %

2016

Bryce Harper Swing% vs R
Pitches: FA, FC, FT
Season: 2016-04-04 to 2016-07-28 | Count: 0 Strikes | Total Pitches: 301 | View: Catcher
0 %
0 %
0 %
5 %
14 %
24 %
19 %
43 %
38 %
13 %
0 %
22 %
28 %
39 %
38 %
61 %
35 %
10 %
0 %
20 %
46 %
55 %
44 %
68 %
64 %
32 %
0 %
11 %
25 %
43 %
58 %
53 %
51 %
70 %
55 %
27 %
0 %
24 %
39 %
45 %
50 %
58 %
55 %
31 %
17 %
18 %
42 %
40 %
41 %
55 %
39 %
7 %
0 %
7 %
34 %
44 %
50 %
42 %
26 %
5 %
0 %
0 %
15 %
29 %
36 %
48 %
17 %
7 %
0 %
0 %
0 %
0 %

He seems to be swinging at less pitches overall, and his focus has shifted from the top of the zone to the inside part of the zone. It should be noted, too, that he is swinging significantly less at breaking pitches with no strikes as well, which highlights something that’s a little less tangible. With fastballs the narrative becomes this: Bryce is taking more fastballs early in the count, which means he isn’t capitalizing on those fastballs. Once he has two strikes on him, it would reason to guess that he would have more trouble making square contact, right? Well, not quite…

Against fastballs in two-strike counts Bryce is actually hitting decently, but he’s still missing the ones across the middle of the plate. One thing I noticed is that, in two-strike counts, he’s getting thrown more breaking pitches than before, and less fastballs. In 2015, 258 out of 719 two-strike pitches were breaking balls (36%). In 2016, the mark has been 189 out of 448 (42%). With two-strike pitches in 2015, 383 out of 719 were fastballs (53%), whereas 2016 has only seen 220 out of 448 (49%). Bryce has become more aware of the outside pitches, both fastballs and breaking balls, and this has something to do with it.

With two strikes, Bryce is swinging at around the same rate in 2016 as he was in 2015. The pitches he is hitting successfully are: High and inside fastballs, away fastballs, away breaking pitches from righties, all breaking pitches in the middle of the plate, and high and inside breaking pitches from lefties. Ok, that’s pretty tedious. Let’s show all of that visually, looking just at 2016:

First, fastballs with two strikes

Bryce Harper SLG/P vs All Pitchers
Pitches: FA, FC, FT
Season: 2016-04-04 to 2016-07-29 | Count: 2 Strikes | Total Pitches: 220 | View: Catcher
.000
.000
.000
.000
.000
.000
.000
.000
.400
.400
.000
.000
.333
.190
.000
.000
.143
.889
.667
.138
.258
.500
.114
.000
.000
.182
.250
.000
.195
.360
.209
.147
.000
.045
.071
.000
.000
.261
.242
.189
.093
.038
.038
.125
.045
.226
.182
.211
.179
.040
.000
.050
.045
.050
.077
.225
.720
.294
.000
.000
.000
.000
.000
.048
.300
.471
.111
.000
.000
.000
.000
.000

Again, he’s gearing up for away pitches, and he’s swinging at almost anything, so he has success against away fastballs. We know that he’s been very keen on high and inside pitches of all kinds and in all counts this year, and that is also the easiest pitch to see. He has a reactionary eye for that pitch, and is able to catch up and drive it. High fastballs out over the plate can be somewhat easy to react to but he a) isn’t as keen on hitting them, b) isn’t seeing them that often in two-strike counts anyways, and c) isn’t expecting them. Thus, he’s most likely popping them up, which explains his high increased infield fly ball%. This is supported by the fact that his ground-ball rates on high fastballs with two strikes is quite low:

Bryce Harper GB/P vs All Pitchers
Pitches: FA, FC, FT
Season: 2016-04-04 to 2016-07-29 | Count: 2 Strikes | Total Pitches: 220 | View: Catcher
0 %
0 %
0 %
0 %
0 %
0 %
0 %
0 %
0 %
0 %
0 %
11 %
0 %
0 %
0 %
0 %
0 %
0 %
0 %
17 %
6 %
0 %
3 %
8 %
8 %
0 %
0 %
0 %
12 %
14 %
5 %
9 %
25 %
36 %
21 %
0 %
0 %
13 %
16 %
11 %
14 %
31 %
35 %
31 %
9 %
3 %
7 %
11 %
11 %
28 %
22 %
15 %
9 %
0 %
3 %
13 %
24 %
24 %
24 %
5 %
0 %
0 %
0 %
5 %
15 %
29 %
22 %
7 %
0 %
0 %
0 %
0 %

Next, let’s look at slugging% against breaking pitches from righties with two strikes

Bryce Harper SLG/P vs R
Pitches: CH, CU, SL
Season: 2016-04-04 to 2016-07-29 | Count: 2 Strikes | Total Pitches: 126 | View: Catcher
.000
.000
.000
1.000
1.000
.000
.000
.333
.600
.714
.500
.000
.000
.091
.357
.429
.250
.000
.000
.200
.000
.000
.000
.063
.167
.125
.000
.000
.000
.077
.059
.190
.308
.000
.000
.000
.444
.143
.310
.294
.593
.500
.000
.000
.625
.313
.286
.656
.310
.286
.000
.000
.143
.133
.083
.200
.263
.000
.000
.000
.000
.045
.000

Again, it appears that because the ball is curving towards him it’s going to be easier to drive. He is then able to pull the breaking pitches that are up and out over the plate, and is able to drive the low and outside pitches with authority. His lack of success on up and away pitches is a little perplexing, but could be attributed to anything from bad luck, to him possibly not seeing that exact pitch as well, to the fact that the sample size here is pretty small and he hasn’t seen a ton of pitches in that area.

Finally, let’s check out breaking pitches from lefties

Bryce Harper SLG/P vs L
Pitches: CH, CU, SL
Season: 2016-04-04 to 2016-07-29 | Count: 2 Strikes | Total Pitches: 63 | View: Catcher
.000
.000
.000
1.000
1.000
.000
.000
.000
.000
.333
.800
1.000
.000
.000
1.000
2.000
.000
.000
.167
.500
.000
.000
.000
.286
1.333
.667
.000
.000
.000
.000
.000
.000
.400
.222
.000
.000
.000
.000
.000
.000
.000
.000
.000
.000
.000
.000
.000
.000
.000
.000
.000
.000
.000
.000
.000
.000
.000
.000
.000
.000
.000
.000
.000
.000

Nothing monumental in this aspect, especially as it’s not too different from how he hits breaking pitches against lefties in all counts. Regardless, it still fits our narrative as the up and inside pitches are right in his wheelhouse, and the pitches that breaking out over the plate are easier to hit than any other breaking pitch coming from a lefty.

Whew. That is a lot of heat maps to take in. Let’s review a bit: Bryce has a tendency to take more pitches early in the count, something he hasn’t done before. He’s also opening up, which makes him susceptible to breaking pitches and causing him to make weaker contact. The fact that he’s making more contact on pitches outside of the zone doesn’t help much either. He’s taking more fastballs as well, and once he has two strikes on him he’s seeing less of them, and is most likely expecting them less. He then begins to swing much more frequently, which actually reaps pretty good rewards, though there are some holes in his swing against certain pitches. He can’t get the high fastball, and struggles with breaking pitches against lefties. The result of all of this? Lower BABIP, lower wRC+, lower wOBA, you name it.

Obviously there are factors involved with this that go far beyond what heat maps and stats can show us. Baseball is an incredibly mental game, and once you realize you’re in a slump it can sometimes just drive you deeper into that slump. Statistics also can almost never tell the whole story, and as I mentioned earlier the sample size here is small enough that none of this is much of a predictor for future behavior. There’s a good chance that, on many of the situations mentioned above, Bryce has just gotten unlucky (or heck, maybe even lucky) and thus the heat map doesn’t reveal much. Overall though, when looking at everything in a holistic manner it allows us to construct an idea as to why Bryce is failing where he previously succeeded. We can never know everything for sure, but we know more than we did.

I’ve been hearing for months now that Bryce will be just fine, slumps happen to everyone, he will soon return to form, etc., and I’m not here to disagree with that. Although, I will ask (and I ought add that I am a big supporter of Bryce’s): What if he doesn’t break out of it? Odds are his 2015 will be one of the best seasons of his career, and 2016 (if it continues like this) will be one of his worst, and he will find himself somewhere in between for the rest of his career. It’s just that the deeper he drives himself into this rut the more compelled I am to find the source of problem as best I can, from a purely analytical standpoint.

Love him or hate him, the more that Bryce (and the many young superstars like him) thrives, the more baseball thrives.

(Note: All statistics and heat maps taken from Bryce’s page on FanGraphs.com)


Started From the Bottom, Now We’re…Average

2015 was the year of Bryce Harper. He led qualified hitters with a 197 wRC+, the highest since the turn of the century among players not named Barry Bonds. This was a vast improvement on his already-impressive 2014 season, in which he totaled a 115 wRC+.

Depending on how you look at things, you could say Bryce Harper was the most improved batter in 2015. I choose not to for two reasons: 1) it’s too easy, and 2) it makes this article more fun. There’s also another more objective reason: with only 395 plate appearances in 2014, Harper didn’t qualify for the batting title.

This poses a question: what minimum do we set to determine who improved the most between 2014 and 2015? If we say that the player needed to qualify for the batting title each year, we get Chris Davis as the most improved batter, who increased his wRC+ from 94 in 2014 to 147 in 2015. If we set no minimum, our wonder-boy is none other than notorious slugger Carlos Torres, the Mets pitcher who upped his wRC+ from -100 to 491.

Clearly, there needs to be some minimum. For the purpose of the article, I’ve decided to set it at 100 PA. This seems a reasonably small enough number to include a wide array of players, but large enough to get rid of anomalies (I’m looking at you Carlos). When we set this minimum, we discover that the batter whose wRC+ increased the most between 2014 and 2015 is… Ryan Raburn. However, since Jeff Sullivan already talked about Raburn, I decided to go with the next name on the list: J.B. Shuck.

If you don’t know who that is, I don’t blame you. I didn’t until I started this research. If you do know him, I’m going to guess that you’re either a White Sox, Indians, or Angels fan. Either that, or you have more time to watch baseball than a college student taking a full course-load of credits. Who’s to say?

The reason the casual fan might not know Shuck is because, well, he’s not exactly a star player. Here are the players with the lowest wRC+ in 2014 of those with at least 100 PAs:

That’s right, he was literally the worst batter that year. Almost as bad as if I were to join the majors. It should be no surprise, then, that he was able to improve so much — he had the lowest starting point. Even so, he still had needed to improve quite drastically in order to surpass Harper’s wRC+ improvement. And that’s exactly what he did:

In 2015, Shuck improved so much that he almost managed to be an average player. But how did he manage to do it? Was it a matter of luck, or did he actually get better?

The number that stands out the most in Shuck’s 2014 season is his .146 BABIP (batting average on balls in play). For those of you that don’t know, that number is quite bad. Like, less than half of what it should be. His BABIP in other seasons is right around league average, so something must have gone amiss last year. Looking at the underlying numbers, some things showed up:

So. His FB% and Pull% numbers were way up as compared to other years. For some context, the league-average FB% has been approximately 34% the past two years, while Pull% has been approximately 40%. These numbers suggest that Shuck spent too much time trying to pull the ball over the fence two years ago, and the video suggests the same thing. Here’s an example of him trying to do just this to a pitch on the outside corner, but instead weakly grounding to first. You can see how he opens his hips before he even starts his swing, forcing him to simply slap at the ball if he wants to make any contact:

And here he is in 2015, driving a similar pitch into left field:

The cause of his change in approach is hard to say. He did get a new hitting coach to start off the year, switching from Jim Eppard to Don Baylor. From 2013 to 2014, the Angels as a team increased their FB% from 33% to 34% and their Pull% from 37% to 42%, so that argument does have some merit. Regardless of the reason, it’s clear that it had an effect. Here’s Shuck’s ISO by zone:


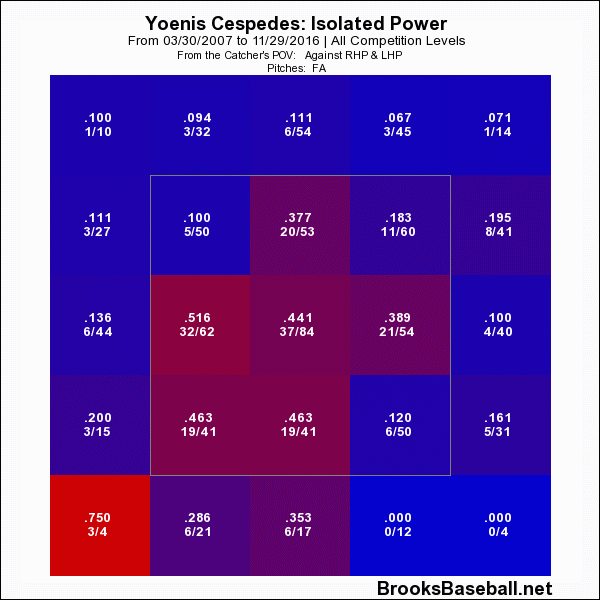
As can be seen on the left, Shuck had trouble hitting anything not on the inside edge of the plate in 2014. This past year, he learned to control more of the strike zone, and even though there’s less red than there was in 2014, there’s also a lot less dark blue. Shuck drove the ball from all parts of the zone to all parts of the field, and his numbers improved because of it.

While Shuck may not be an All-Star anytime soon, his year-to-year improvement is truly remarkable. If he can go from being the worst hitter in baseball to an average one, anyone can. And if that doesn’t inspire the Brendan Ryans of the world, I don’t know what will.


$500 Million Man

A few days ago, Joe Posnanski wrote about the possibility of Bryce Harper getting the first $500m contract ever. I agree with him on how both amazing and ridiculous it would have sounded 2 or 3 years ago. I also agree it is possible, almost likely, to happen. I might not be a Bryce Harper fan but he is so young that is he is on track to accomplish big things. He is not Mike ‘King’ Trout but he is very good.

Harper’s current contract runs through the end of 2018, which is when I assume he would get the big fat check. The Nationals will try to extend his contract before he is a free agent, just like the Marlins and the Angels did with Giancarlo Stanton and Mike Trout. However, in this post we will assume Harper will not pursue that path, making him a highly-coveted free agent in 2018. I will also exclude the possibility of 9- or 10-year contracts, which would make the mark easily achievable. Let’s run the numbers for Harper’s future:

Year Open market ($m/WAR) Age WAR Projected Value ($m) Cumulative value ($m)
2016 8.4 23 6.8 54.4
2017 8.8 24 7.1 59.2
2018 9.3 25 7.3 64.4
2019 9.7 26 7.6 69.9 73.4
2020 10.2 27 7.8 75.8 153.1
2021 10.7 28 7.8 79.6 236.7
2022 11.3 29 7.8 83.6 324.5
2023 11.8 30 7.8 87.8 416.7
2024 12.4 31 7.3 86.3 507.3
2025 13.0 32 6.8 84.4 595.9
2026 13.7 33 6.3 82.1 682.1
2027 14.4 34 5.8 79.4 765.4

We have here Harper’s projected value profile. As usual, I am using FanGraphs’ model, which has a player’s aging curve that follows +0.25 WAR/year (Age 18-27), 0 WAR/year (Age 28-30),-0.5 WAR/year (Age 31-37),-0.75 WAR/year (38 and older). It also assumes that open-market WAR sits at $8.4m in 2016 and grows at 5% per year. The starting point is Steamer’s 2016 projection: 6.8 WAR.

Three years from now, in the winter of 2018, he will be negotiating his new contract that includes his theoretical peak 27-30 years at ~7.8 WAR/year. The truth is that a 7-year / $500m+ contract would only be likely if by 2018 he can position himself as a player who consistently accounts for almost 8 wins per year. That is the only reason a team would be eager to invest half a billion dollars in a single player, marketing-related reasons aside.

Now, the question comes down to what he needs to do by 2018 in order to cement that positioning. The model needs him to be a 21.2-win player during the next 3 seasons. While Harper might have taken a significant step up performance-wise, we need to remind ourselves that before 2015 he was “just” a ~4-5 WAR guy. In order to meet the model’s expectations he needs to double those numbers, and remain at that level  for 3 years in a row (i.e.: Between 8-9 WAR for that 3-year period). If he meets those marks, Harper would have accrued 40 WAR during his career by 2018. While that is entirely possible, it is not easy. This is the list of highest cumulative WAR by age-25:

Player Cumulative WAR by age 25
Ty Cobb 56.3
Mickey Mantle 52.5
Jimmie Foxx 47.3
Rogers Hornsby 46.9
Mel Ott 45.9
Alex Rodriguez 42.8
Eddie Mathews 39.4
Arky Vaughan 39.4
Tris Speaker 38.7
Mike Trout 38.5

So, two conclusions can be quickly drawn. First, Mike Trout is not human. He is only 24 years old and is already on this list with guys like Cobb, Mantle, Foxx and company. Second, no, it is not an easy task for Harper. I know that you are thinking that he just put up a 9.5 WAR season, why can’t he do it again? Another season like that and he should get to his target easily but, truth be told, those Trout-esque seasons are unlikely to happen. I say this for three main reasons. First, Harper is not an elite defender and has gotten worse every year. For the last 3 seasons (2013-2015), he ranks 37th in UZR/150 out of 60 qualified OF. In 2015, he compiled -8.5 on Defense (Def) metric, per FanGraphs, which is position-adjusted, in his case for RF. Out of the 69 individual seasons with 8 or higher WAR from players 25 or younger, only 5 players (Hank Aaron, Ted Williams, Stan Musial, Mike Trout (!) and Bryce Harper) had -8 or worse Defense. No, it is not impossible but it is hard.

Second, he is an above-average baserunner, but not an awesome one. Lastly, Harper has not exhibited good health over his career. He has had injuries in 2 out of 4 seasons, which may not seem many but in 2013 and 2014 he only played 67% of Nationals games. Predicting health is tough, especially because there are unforeseeable events. You cannot control a hit by pitch at your wrists or a concussion sliding in second base but your health track record is your best bet on your future injury report. Those three things are vital to get to 21.2 WAR during the next 3 years. Harper needs those factors to come in play in order to get to the 7yr/$500m contract. Harper’s advantage is his age – just like Jason Heyward this offseason.

We have implicitly talked about Mike Trout. He is arguably the best player in baseball right now and was on track to smash the contract record, until he negotiated a 6yr/$144.5m contract extension. That will keep him locked up from ages 24 to 29 at LAA. Now, the question is what type of contract will he command in 2020? Mind you, it is hard enough to try to predict what a Free Agent might get in 2016, but still we took a stab a it.

Year Open market ($m/WAR) Age WAR Projected Value ($m) Cumulative value ($m)
2016 8.4 24 9.2 73.6
2017 8.8 25 9.5 79.4
2018 9.3 26 9.7 85.6
2019 9.7 27 10.0 92.1
2020 10.2 28 10.0 96.8
2021 10.7 29 10.0 101.6 101.6
2022 11.3 30 10.0 106.7 208.3
2023 11.8 31 9.5 106.4 314.6
2024 12.4 32 9.0 105.8 420.4
2025 13.0 33 8.5 104.9 525.3
2026 13.7 34 8.0 103.6 628.9
2027 14.4 35 7.5 101.9 730.8

Here is Trout’s projection. Again, 2016 WAR is courtesy of Steamer. We might think the aging curve slightly benefits Trout because it forecasts a ~10% increase in WAR, and he has not posted those 10 WAR seasons since 2 years ago. Then again, let’s toy with the idea. The $500m contract here seems more feasible for three reasons. First, in MLB, you get paid for what you did and not for what you will do.  By 2020, Trout could have ~85 WAR under his belt –he would be 28 years old. That is just ridiculous and will not happen, right? No one, ever, has done that by age 28 (Ty Cobb is the leader with 78.6 WAR). But what if he does? What if Trout is around the 70 WAR mark with 8 or 9 great seasons on his resume? Second, he needs to do what he has already done e.g. Trout has posted two +10 WAR already. The other two seasons were 8 and 9. This guy runs well and plays above-average defense. Trout does it all and will not stop. Third, unlike Harper, Trout has been very much healthy. During the 2013-2015 period, he played 157, 157 and 159 games, respectively. Again, injuries are hard to predict but we will take what he has shown so far as a given, which is good health. Fourth, fair to say, time value of money. A dollar today is not worth the same as a dollar tomorrow. Therefore, getting a $500m contract in 2020 should be easier than in 2018.

In summary, I think Harper can do it but I would not bet on it. From my perspective this is a long shot. If you ask me today on who is more likely to become baseball’s first 500-million-dollar man, I would put my money on Mike Trout to beat Bryce Harper on this as well.

Note: This analysis is also featured in our emerging blog www.theimperfectgame.com


Losing My Religion: Changing Approach and Changing Results

Every year, we hear about batters taking a new approach at the plate that they expect to generate better outcomes. But, as has often been shown, a lot of player tendencies are hard-wired. Players generally don’t change that much. What happens when they do?

In June, I looked at hitters who were pulling the ball a lot less or a lot more than they had in 2014. The conclusion was that it didn’t really make much of a difference, in aggregate, on offensive performance, although some players did markedly better and some did markedly worse. Now that the full season’s in the books, I decided to take another look at the comparison to see how a change at the plate affects hitting.

To look at this, I selected hitters with 350 or more plate appearances in both 2014 and 2015, corresponding roughly to at least half-time play. There were 173 such players. Using that sample set, I evaluated three observations you hear a lot about modern hitters:

  • They pull too much, allowing infielders to get extra outs by shifting. If they’d hit to the opposite field, they’d do better.
  • They try to hit everything into the seats, resulting in too many infield flies and lazy fly balls to the outfield instead of hitting sharp grounders that can become singles.
  • They’re too passive, getting behind the count by watching pitches.

I looked for changes in pull tendency, ground vs. air batted balls, and aggressiveness at the plate, measured by net pull percentage (i.e., percentage of balls pulled minus percentage hit to the opposite field), ground ball/fly ball ratio, and swing percentage as proxies. To gauge the impact of the changes, I looked at change in wRC+, since it is a park- and season-normalized comprehensive measure of hitting.

It’s important, I think, to make a distinction between a change in outcomes to a change in approach. Take pulling the ball. If a batter pulls the ball less from one year to the next, it could be because he’s consciously trying to spray the ball over the field more in order to become less predictable and therefore harder to defend. Mike Moustakas comes to mind. But a batter may pull less because of the effects of age and/or injury, making his bat slower and unable to turn on inside fastballs. Since we can’t divine approach from full-season statistics, we’ll have to satisfy ourselves with outcomes. Among the 173 players in the sample, Victor Martinez had the largest decline in hitting the ball hard, and his wRC+ decline of 90 points was similarly the largest in the group. That doesn’t mean that he went into the season deciding to hit the ball softer, and that his strategy backfired. Rather, it was a reflection of Martinez’s health. A change in outcomes isn’t necessarily reflective of a change in approach.

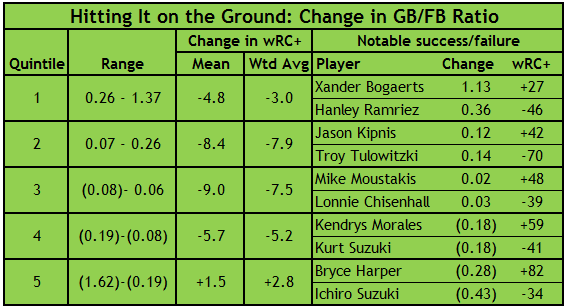
I ranked the 173 players by their change in pull tendency, ground vs. air batted balls, and aggressiveness at the plate, and divided them into quintiles based on plate appearances. As an example, for pull tendency, the quintiles were players who went the opposite way a lot more (net pull percentage down 7.5% to 25.9%), those who went the opposite way somewhat more (net pull percentage down 3.6% to 7.4%), those who hit about the same (net pull percentage down 3.5% to up 0.1%), those who pulled somewhat more (net pull percentage up 0.2% to 5.0%),and those who pulled a lot more (net pull percentage up 5.0% to 17.8%). I also selected examples of players whose wRC+ was considerably better or worse in 2015 for each quintile. Generally, these were the players at the top or bottom of the rankings, though I did ignore obviously injured underperformers like Martinez and Jayson Werth.

In the tables I’m going to display, there are a lot of negative numbers for change in wRC+. The reason is that among the 173 players with 350 or more plate appearances in 2014 and 2015, the average wRC+ declined by 5.2 points (from 109.6 to 104.4), or 4.3 points (110.9 to 106.6) weighted by plate appearances. While that may be a topic for future research, it’s not a shock, given aging curves, regression, and the emergence of young talent in the majors.

Players who pulled a lot more or went the other way a lot more in 2015 than in 2014 did better than their peers. (Again, the average player’s wRC+ declined by 5.2 points, or 4.3 weighted by plate appearances). Those who went the opposite way a lot more improved relatively, and those who pulled a lot more improved both relatively and absolutely. If there’s a benefit to hitting to the opposite field for pull-happy sluggers who make too many outs by hitting the balls to shifted infielders, we’d see the change in wRC+ decline as the net pull percentage increases. That’s not what happened. Bryce Harper, Chris Davis, and Shin-Soo Choo, among others, benefited from pulling more, not less.

Players’ ground ball tendencies, similar to their pull tendencies, resulted in positive variance at both extremes. Players who hit the ball on the ground a lot more improved relative to their peers, and those who hit it in the air a lot more improved relatively and absolutely. Harper’s an outlier again—he pulled a lot more, hit the ball in the air a lot more, and produced a lot more runs. It’s amusing to see Red Sox teammates Xander Bogaerts and Hanley Ramirez as prime examples of what can go right or wrong if you hit a lot more ground balls.

 The outcomes for players who changed their pull tendency or proportion of balls hit on the ground were equivocal: Players did better at the extremes, but not in the middle. That wasn’t the case for aggression at the plate. In aggregate, batters who swung more did worse than batters who swung less. However, there’s a considerable outcomes vs. approach component here. The players in the bottom quintile—those who swung a lot less in 2015 than 2014—didn’t always have complete choice in the matter, as pitchers rationally chose to pitch more cautiously to hitters like Harper (percentage of pitches in the strike zone declined from 45.0% in 2014 to 41.5% in 2015) and Eric Hosmer (42.7% to 41.1%). But others in that lowest quintile, including Manny Machado, Curtis Granderson, and even A.J. Pierzynski, saw more pitches in the strike zone in 2015 than 2014, but chose to swing less, in and out of the zone, with improved results.

This project turned out to be murkier than I would’ve liked. Did batters who pulled a lot less, or those who it the ball on the ground a lot more, do better in 2015 than they did in 2014? Yes, but so did those who pulled a lot more and hit the ball in the air a lot more. And those are only aggregate figures; in every quintile, there are examples of batters who were a lot better or a lot worse. And we can’t completely tease out the change in approach from the change in a batter’s health or age or the way he’s pitched. About the only thing that seems to be safe to say is that swinging more is a dubious strategy. If a player goes into spring training talking about getting more aggressive at the plate and taking a lot more hacks, we might hope that his batting coach can talk him out of it.


Your One-Stop Shop for Postseason Narrative Debunking

I, like you, have been hearing and reading a lot about the postseason and which teams are best positioned to go deep into October. The rationales aren’t always based on more tangible factors — like, say, which teams are good — but rather on “hidden” or “insider” clues (use of scare quotes completely intentional) drawn from other qualities. I decided to test each of the factors I’ve heard or read about.

Full disclosure: This isn’t exactly original research. Well, it is, in that I made a list of various hypotheses to test, decided how to test them, and then spent hours pulling down data from Baseball-Reference and FanGraphs in order to create an unwieldy 275×23 spreadsheet full of logical operators. But it isn’t original in that some of the questions I’m addressing have been addressed elsewhere. For example, I’m going to consider whether postseason experience matters. David Gassko at the Hardball Times addressed the impact of players’ postseason experience on postseason outcomes in 2008, and Russell Carleton at Baseball Prospectus provided an analysis recently. I’m not claiming to be the first person to have thought of these items or of putting them to the test. What I’ve got here, though, is an attempt to combine a lot of narratives in one place, and to bring the research up to date through the 2013 postseason.

I’m going to look at seven questions:

  • Does prior postseason experience matter?
  • Do veteran players have an edge?
  • How important is momentum leading into the postseason?
  • Does good pitching stop good hitting?
  • Are teams reliant on home runs at a disadvantage?
  • Is having one or more ace starters an advantage?

For each question, I’ll present my research methodology and my results. Then, once I’ve presented all the conclusions, I’ll follow it up with a deeper discussion of my research methodology for those of you who care. (I imagine a lot of you do. This is, after all, FanGraphs.) In all cases, I’ve looked at every postseason series since the advent of the current Divisional Series-League Championship Series-World Series format in 1995. (I’m ignoring the wild card play-in/coin flip game.) That’s 19 years, seven series per year (four DS, 2 LCS, 1 WS), 133 series in total.

DOES POSTSEASON EXPERIENCE MATTER?

The Narrative: Teams that have been through the crucible of baseball’s postseason know what to expect and are better equipped to handle the pressures–national TV every game, zillions of reporters in the clubhouse, distant relations asking for tickets–than teams that haven’t been there before.

The Methodology: For each team, I checked the number of postseason series they played over the prior three years. The team with the most series was deemed the most experienced. If there was a tie, no team was more experienced. I also excluded series in which the more experienced team had just one postseason series under its belt, i.e., a Divisional Series elimination. I figured a team had to do more than one one-and-done in the past three years to qualify as experienced. In last year’s NLCS, for example, the Cardinals had played in five series over the past three years (three in 2011, two in 2012), while the Dodgers had played in none. So St. Louis got the nod. In the Dodgers’ prior Divisional Series, LA played an Atlanta team that lost a Divisional Series in 2010, its only postseason appearance in the prior three years, so neither team got credit for experience.

The Result: Narrative debunked. There have been 101 series in which one team was more experienced than the other, per my definition. The more experienced team won 50 of those series, or 49.5%. There is, at least since 1995, no relationship between postseason experience and success in the postseason.

DOES VETERAN PLAYERS HAVE AN EDGE?

The Narrative: The pressure on players grows exponentially in October. A veteran presence helps keep the clubhouse relaxed and helps players perform up to their capabilities, yet stay within themselves. Teams lacking that presence can play tight, trying to throw every pitch past the opposing batters and trying to hit a three-run homer with the bases empty on every at bat. (Sorry, I know, I’m laying it on thick, but that’s what you hear.)

The Methodology: For each team, I took the average of the batters’ weighted (by at bats + gamed played) age and the pitchers’ weighted (by 3 x games started + games + saves) age. I considered one team older than the other if its average age was 1.5 years older than that of its opponent. For example, in the 2012 ALCS, the Yankees’s average age was 31.5, and the Tigers’ was 28.1, so the Yankees had a veteran edge. When the Tigers advanced to the World Series against San Francisco, the Giants’ average age was 28.9, so neither team had an advantage.

The Result: Narrative in doubt. There have been 51 series in which one team’s average age was 1.5 or more years greater than the other. The older team won 27 of those series, or 53%. That’s not enough to make a definite call. And if you take away just one year–2009, when the aging Yankees took their most recent World Series–the percentage drops to 50%–no impact at all.

HOW IMPORTANT IS MOMENTUM LEADING INTO THE POSTSEASON?

The Narrative: Teams that end the year on a hot streak can carry that momentum right into the postseason. By contrast, a team that plays mediocre ball leading up to October develops bad habits, or forgets how to win, or something. (Sorry, but I have a really hard time with this one. We’re hearing it a lot this year–think of the hot Pirates or the cold A’s–but there are other teams, like the Orioles, who have the luxury of resting their players and lining up their starting rotation. I have a hard time believing that the O’s 3-3 record since Sept. 17 means anything.)

The Methodology: I looked up each team’s won-lost percentage over the last 30 days of the season and deemed a team as having more momentum if its winning percentage was 100 or more percentage points higher than that of its opponent. For example, in one of last year’s ALDS, the A’s were 19-8 (.704 winning percentage) over their last 30 days and the Tigers were 13-13 (.500), so the A’s had momentum. The Red Sox entered the other series on a 16-9 run (.640) and the Rays were 17-12 (.586), so neither team had an edge.

The Result: Narrative in doubt, and then, only for the Divisional Series. There have been 64 series in which one team’s winning percentage over its past 30 days was 100 percentage points higher than that of its opponent. In those series, the team with the better record won 33, or 51.5% of the time. That’s not much of an edge. And when you consider that a lot of those were in the Divisional Series, where the rules are slanted in favor of the better team (the team with the better record generally gets home field advantage), it goes away completely. Looking just at the ALCS, NLCS, and World Series, the team with the better record over the last 30 days of the season won 13 of 27 series, or 48%, debunking the narrative. In the Divisional Series, the hotter team over the last 30 days won 20 of 37 series, or 53%. That’s an edge, but not much of one.

DOES GOOD PITCHING STOP GOOD HITTING?

The Narrative: Pitching and defense win in October. Teams that hit a lot get shut down in the postseason.

The Methodology: I struggled with a methodology for this one. I came up with this: When a team whose hitting (measured by park-adjusted OPS) was 5% better than average faced a team whose pitching (by park-adjusted ERA) was 5% better than average, I deemed it as a good-hitting team meeting a good-pitching team. For example, the 2012 ALCS featured a good-hitting Yankees team (112 OPS+) against a good-pitching Tigers team (113 ERA+). The Yankees were also good-pitching (110 ERA+), but the Tigers weren’t good-hitting (103 OPS+).

The Result: Narrative in doubt. There have been 65 series in which a good-hitting team faced a good-pitching team, as defined above. (There were four in which both teams qualified as good-hitting and good-pitching; in those cases, I went with the better-hitting team for compiling my results.) In those series, the better-hitting team won 32 times, or 49%. That is, good hitting beat good pitching about half the time. That pretty much says it.

ARE TEAMS RELIANT AT HOME RUNS AT A DISADVANTAGE?

The Narrative: Teams that sit back and wait for home runs are at a disadvantage in the postseason, when better pitching makes run manufacture more important. Scrappy teams advance, sluggers go home.

The Methodology: I calculated each team’s percentage of runs derived from home runs. In every series, if one team derived 5% more of its runs from homers than another, I deemed that team as reliant on home runs. For example, in last year’s NLCS, the Cardinals scored 204 of their 783 runs on homers (26%). The Dodgers scored 207 of their 649 via the long ball (32%). So the Dodgers were more reliant on home runs. In the ALCS, the Red Sox scored 36% of their runs (305/853) on homers compared to 38% for the Tigers (301/796), so neither team had an edge.

The Result: Narrative in doubt. There have been 60 series in which one team derived a 5% or greater proportion of its runs from homers than its opponent. In those series, the more homer-happy team won 27 series, or 45% of the time. So the less homer-reliant team won 55%, which is OK, but certainly not a strong majority. And if you remove just one year–2012, when the less homer-reliant team won six series (three of those victories were by the Giants)–the percentage drops to 50%.

IS HAVING ONE OR MORE ACE STARTERS AN ADVANTAGE?

The Narrative: An ace starter can get two starts in a postseason series (three if he goes on short rest in the seventh game of a Championship or World Series.) Assuming he wins, that means his team needs win only one of three remaining games in a Divisional Series and only two of five or one of four in a Championship or World Series. A team lacking such a lights-out starter is at a disadvantage.

The Methodology: This is another one I struggled with. Defining an “ace” isn’t easy. I arrived at this: I totaled the Cy Young Award points for each team’s starters. If one team’s total exceeded the other’s by 60 or more points — the difference between the total number of first- and second-place votes since 2010 — I determined that team had an edge in aces. (The difference was half that prior to 2010, because the voting system changed in 2010, when the voting went from three deep to five deep and the difference between a first and second place vote rose from one point to two.) For example, in last year’s Boston-Tampa Bay Divisional Series, the only starter to receive Cy Young consideration was Tampa Bay’s Matt Moore, who got four points for two fourth-place votes. That’s not enough to give the Rays an edge. But in the other series, Tigers Max Scherzer (203 points) and Anibal Sanchez (46) combined for 249 points, while the A’s got 25 points for Bartolo Colon. That gives an edge to the Tigers.

The Result: Narrative in doubt. There have been 82 series in which one team’s starters got significantly more Cy Young Award vote points than its opponents’. The team with higher total won 44 series, or just under 54%. That’s not much better than a coin flip. And again, one year — in this case, 2001, when the team with the significantly higher Cy Young tally won six series — tipped the balance. Without the contributions of Randy Johnson, Curt Schilling, Roger Clemens, Freddy Garcia, Jamie Moyer, and Mike Mussina to that year’s postseason, the team with the apparent aces has won just 38 of 76 series, exactly half.

Conclusion: None of the narratives I examined stand up to scrutiny. Maybe the team that wins in the postseason, you know, just plays better.


Now, About the Methodology: I know there are limitations and valid criticisms of how I analyzed these data. Let me explain myself.

For postseason experience, I feel pretty good about counting the number of series each team played over the prior three years. One could argue that I should’ve looked at the postseason experience of the players rather than the franchise, but I’ll defend my method. There isn’t so much roster and coaching staff turnover from year to year to render franchise comparisons meaningless.

For defining veteran players, there are two issues. First, my choice of an age difference of 1.5 years is admittedly arbitrary. My thinking was pretty simple: one year doesn’t amount to much, and there were only 35 series in which the age difference was greater than two years. So 1.5 was a good compromise. Second, I know, age isn’t the same as years of experience. But it’s an OK proxy, it’s readily available, and it’s the kind of thing that the narrative’s built on. Bryce Harper has more plate appearances than J.D. Martinez, but he’s also over five years younger–whom do you think the announcers will describe as the veteran?

For momentum, I think the 30-day split’s appropriate. I could’ve chosen 14 days instead of 30 — FanGraphs’ splits on its Leaders boards totally rock — but I thought that’d include too many less meaningful late-season games when teams, as I mentioned, might be resting players and setting up their rotations. As for the difference of 100 points for winning percentage, that’s also a case of an admittedly arbitrary number that yields a reasonable sample size. A difference of 150 points, for example, would yield similar results but a sample size of only 39 compared to the 64 I got with 100 points.

For good hitting and good pitching, I realize that there are better measures of “good” than OPS+ and ERA+: wRC+ and FIP-, of course, among others. But I wanted to pick statistics that were consistent with the narrative. When a sportswriter or TV announcer says “good pitching beats good hitting,” I’ll bet you that at least 99 times out of a hundred that isn’t shorthand for “low FIP- beats high wRC+.” If you and I were asked to test whether good pitching beats good hitting, that’s probably how we’d do it. But that’s not what we’re looking at here OPS and ERA are more consistent with the narrative.

For reliance on home runs, it seems pretty clear to me that the right measure is percentage of runs scored via the long ball. Again, my choice of a difference of five percentage points is arbitrary, but it’s a nice round number that yields a reasonable sample size.

Finally, my use of Cy Young voting to determine a team’s ace or aces: Go ahead, open fire. I didn’t like it, either. But once again, we’re looking at a narrative, which may not be the objective truth. Look, Roger Clemens won the AL Cy Young Award in 2001 because he went 20-3. He was fourth in the league in WAR. He was ninth in ERA. He was third in FIP. He was, pretty clearly to me, not only not the best pitcher in the league, but also only the third best pitcher on his own team (I’d take Mussina and Pettite first). But I’ll bet you that when the Yankees played the Mariners for the ALCS that year (too far ago for me to remember clearly), part of the storyline was how the Yankees got stretched to five games in the Divisional Series and therefore wouldn’t have their ace, Roger Clemens, available until the fourth game against the Mariners. Never mind that Pettite was the MVP of the ALCS. The ace narrative is based on who’s perceived as the ace, not who actually is. (And a technical note: Until the Astros moved from the NL to the AL, the difference between first- and second-place votes in the two leagues were different, since there were 28 voters in the AL and 32 in the NL. The results I listed aren’t affected by that small difference. I checked.)


Young Power / What Could Have Been if Miguel Sano Didn’t Need Tommy John Surgery

Twenty-two players have hit 150 home runs or more by the age of 25 (Per baseball reference, the last season included is when a player is no older than 25 on June 30th of that season).  The list below is a who’s who of players that hit for power at a young age. You’ll notice a large number of active players have accomplished this feat, and that 10 of the 17 retired players are in the Hall of Fame.

Rk Player HR From To Age
1 Alex Rodriguez

241

1994

2001

18-25
2 Eddie Mathews

222

1952

1957

20-25
3 Jimmie Foxx

222

1925

1933

17-25
4 Mel Ott

211

1926

1934

17-25
5 Mickey Mantle

207

1951

1957

19-25
6 Frank Robinson

202

1956

1961

20-25
7 Albert Pujols

201

2001

2005

21-25
8 Orlando Cepeda

191

1958

1963

20-25
9 Ken Griffey

189

1989

1995

19-25
10 Andruw Jones

185

1996

2002

19-25
11 Johnny Bench

179

1967

1973

19-25
12 Hank Aaron

179

1954

1959

20-25
13 Miguel Cabrera

175

2003

2008

20-25
14 Joe DiMaggio

168

1936

1940

21-25
15 Juan Gonzalez

167

1989

1995

19-25
16 Jose Canseco

165

1985

1990

20-25
17 Prince Fielder

160

2005

2009

21-25
18 Tony Conigliaro

160

1964

1970

19-25
19 Adam Dunn

158

2001

2005

21-25
20 Bob Horner

158

1978

1983

20-25
21 Hal Trosky

155

1933

1938

20-25
22 Willie Mays

152

1951

1956

20-25


A few more active players look like they are about to join the club

Three favorites are Giancarlo Stanton, Mike Trout and Bryce Harper. According to the Oliver five year projection system, each of these players will reach over 150 home runs by the end of his age 25 season.

Player CareerHR Born Age Oliver HR-25 Career +Oliver average projected HR Average needed to reach 150
Giancarlo Stanton

117

1989

20-23

73

190

36.5

16.5

Mike Trout

62

1991

19-21

108

170

27

22

Bryce Harper

42

1992

19-20

159

201

31.8

21.6

This chart shows each player’s current home run totals, the seasons played through so far, the number of additional home runs Oliver projects through the 25 season, the projected total runs by the age of 25 (Career HR + Oliver projected), and finally what each player would need to average to hit 150 runs by the age of 25. This last measure is interesting because it gives you an idea of what level each player would need to fall below to miss the mark.

Minor league players might knock out A-Rod for #1

Miguel Sano, Joey Gallo and Javier Baez make up a trio of minor leaguers who Oliver believes could also make the list.  Not only does Oliver project these three players will to fly past 150 home runs, he predicts Sano and Gallo could pass A-Rod for the most home runs by age 25.

Name BDAY Oliver hr25 Oliver K 25
Miguel Sano

5/11/1993

247

1030

Joey Gallo*

11/19/1993

228

1277

Javier Baez

12/1/1992

209

963

*the Gallo projections are only through his age 24 season so if he kept up the home run pace he would be in the 270s at the age of 25

While Sano, Gallo and Baez have a high number of projected home runs, they also have a high number of projected strikeouts. Adam Dunn shows that you can be very successful as a player who strikes out & hits home runs frequently. But the three minor league players could be even more extreme. Dunn struck out 26% of the time and homered 5.7% of the time through his age 25 season.  The minor league trio are predicted to strike out between 32 and 43% of the time and homer between 7 and 8% of the time. Could these three players redefine the all or nothing hitter, or are they somehow breaking projection systems?


Reasons to be skeptical

The Oliver model is complex and would take a long time to completely dissect, but from what I can tell it has the following limitations (these limitations are intentional because they add other value to the projections system):

#1 The Assumption of Games – Oliver projections assume a player gets 600 major-league plate appearances every year. This is not necessarily a given because top minor league players will likely spend part of a season in the minors before moving up to the majors, or in Sano’s case miss games rehabbing an injury.

#2 Inherent Uncertainty –  First, projections based off minor league numbers have more uncertainty than those based off major league numbers. Second, each additional year projected in the future adds more uncertainty because each year you go out you are guessing what happened the previous year – vs. knowing what happened the previous year. Compounded, these two stated effects create a good deal of inherent uncertainty.


So, what does this all mean?

If the projections are anywhere close to correct, it looks like we are going to see a new breed of power hitter in the major league soon. Although the projections are far from foregone conclusions, it’s another great reason why we watch the game of baseball.


Putting Manny Machado’s 2013 in Context

Even as a fan of a different AL East team, seeing Manny Machado go down with a knee injury this Monday saddened me. Fortunately, reports indicate the injury is not as serious as originally feared, and Machado could return for spring training. Machado is part of a class of young stars that have simultaneously taken baseball by storm and wrecked the grading curve for everyone to come after them. People are already giving up on Jurickson Profar because he isn’t a star at an age when most players are in Low-A ball. Bryce Harper ranks in the top 20 in the MLB in wRC+ at the age of 20, and hardly anybody notices.  Anyways, I digress. So where does Machado’s age-20 season rank?

Machado compiled 6.2 WAR in 2013, good for 10th in the MLB. In the last 55 years, only Alex Rodriguez in 1996 and Mike Trout in 2012 have posted a higher WAR in their age-20 season. Of course, there were some better seasons before then, but Machado probably wouldn’t have been allowed to play in those days.

Unlike Rodriguez and Trout, Machado’s offensive numbers, while impressive for a 20 year-old are league average overall. A-rod had a 159 wRC+ in ’96, and Trout had a 166 wRC+ last year. Machado managed a 101 wRC+, providing most of his value with the glove. UZR credited him with 31 runs saved, best in the majors. After a very hot start that was fueled by an inflated BABIP, Machado slowed down.

Month wRC+ BABIP
Mar/Apr 122 0.355
May 156 0.387
June 107 0.372
July 42 0.210
Aug 122 0.340
Sept/Oct 39 0.227
1st Half 119 0.361
2nd Half 73 0.260

So what can Orioles fans expect from Machado going forward?

Machado is an aggressive contact hitter. His walk rate of 4.1% is one of the lowest in the MLB, and his strikeout rate of 15.9% is well below the MLB average. While Machado will never be Joey Votto, the walk rate will improve as he matures. His minor league walk rate was above 10%. Additionally, Machado should hit for more power. I could just say that he hit 51 doubles and those will turn into home runs. But, that would be lazy, and doubles don’t always turn into home runs as a player develops. Sometimes they turn into singles. Just ask Nick Markakis.

However, there are other reasons to believe Machado will hit for power. First of all, he has excellent bat speed, and there’s no lack of raw power. Some of the home runs he has hit are very impressive. Of the 14, ESPN Home Run Tracker classifies 10 of them as either No Doubters or Plenty.  The average speed off the bat was just a shade behind Robinson Cano. Furthermore, despite playing in one of the best home run ballparks in the league, and having an average fly ball distance on par with Nick Swisher, Machado’s HR/FB ratio of 7.9% is in the bottom third of the MLB. Bet on this ratio improving. While he does have a very high rate of infield flies (9th in MLB), he should be able to bring that down with improved discipline.

Hopefully for Orioles fans and baseball fans, Machado will have a complete recovery from his knee injury. It might be hard to live up to expectations after producing a 6.2 WAR season at age 20, but with improved offense Machado could be up to the task. Expect the plate discipline and power to improve, as the defense inevitably regresses from a season that stretched the upper bounds of UZR. It’s a very small group he’s in, but star players at age 20 tend to be stars at 25.