Losing My Religion: Changing Approach and Changing Results
Every year, we hear about batters taking a new approach at the plate that they expect to generate better outcomes. But, as has often been shown, a lot of player tendencies are hard-wired. Players generally don’t change that much. What happens when they do?
In June, I looked at hitters who were pulling the ball a lot less or a lot more than they had in 2014. The conclusion was that it didn’t really make much of a difference, in aggregate, on offensive performance, although some players did markedly better and some did markedly worse. Now that the full season’s in the books, I decided to take another look at the comparison to see how a change at the plate affects hitting.
To look at this, I selected hitters with 350 or more plate appearances in both 2014 and 2015, corresponding roughly to at least half-time play. There were 173 such players. Using that sample set, I evaluated three observations you hear a lot about modern hitters:
- They pull too much, allowing infielders to get extra outs by shifting. If they’d hit to the opposite field, they’d do better.
- They try to hit everything into the seats, resulting in too many infield flies and lazy fly balls to the outfield instead of hitting sharp grounders that can become singles.
- They’re too passive, getting behind the count by watching pitches.
I looked for changes in pull tendency, ground vs. air batted balls, and aggressiveness at the plate, measured by net pull percentage (i.e., percentage of balls pulled minus percentage hit to the opposite field), ground ball/fly ball ratio, and swing percentage as proxies. To gauge the impact of the changes, I looked at change in wRC+, since it is a park- and season-normalized comprehensive measure of hitting.
It’s important, I think, to make a distinction between a change in outcomes to a change in approach. Take pulling the ball. If a batter pulls the ball less from one year to the next, it could be because he’s consciously trying to spray the ball over the field more in order to become less predictable and therefore harder to defend. Mike Moustakas comes to mind. But a batter may pull less because of the effects of age and/or injury, making his bat slower and unable to turn on inside fastballs. Since we can’t divine approach from full-season statistics, we’ll have to satisfy ourselves with outcomes. Among the 173 players in the sample, Victor Martinez had the largest decline in hitting the ball hard, and his wRC+ decline of 90 points was similarly the largest in the group. That doesn’t mean that he went into the season deciding to hit the ball softer, and that his strategy backfired. Rather, it was a reflection of Martinez’s health. A change in outcomes isn’t necessarily reflective of a change in approach.
I ranked the 173 players by their change in pull tendency, ground vs. air batted balls, and aggressiveness at the plate, and divided them into quintiles based on plate appearances. As an example, for pull tendency, the quintiles were players who went the opposite way a lot more (net pull percentage down 7.5% to 25.9%), those who went the opposite way somewhat more (net pull percentage down 3.6% to 7.4%), those who hit about the same (net pull percentage down 3.5% to up 0.1%), those who pulled somewhat more (net pull percentage up 0.2% to 5.0%),and those who pulled a lot more (net pull percentage up 5.0% to 17.8%). I also selected examples of players whose wRC+ was considerably better or worse in 2015 for each quintile. Generally, these were the players at the top or bottom of the rankings, though I did ignore obviously injured underperformers like Martinez and Jayson Werth.
In the tables I’m going to display, there are a lot of negative numbers for change in wRC+. The reason is that among the 173 players with 350 or more plate appearances in 2014 and 2015, the average wRC+ declined by 5.2 points (from 109.6 to 104.4), or 4.3 points (110.9 to 106.6) weighted by plate appearances. While that may be a topic for future research, it’s not a shock, given aging curves, regression, and the emergence of young talent in the majors.

Players who pulled a lot more or went the other way a lot more in 2015 than in 2014 did better than their peers. (Again, the average player’s wRC+ declined by 5.2 points, or 4.3 weighted by plate appearances). Those who went the opposite way a lot more improved relatively, and those who pulled a lot more improved both relatively and absolutely. If there’s a benefit to hitting to the opposite field for pull-happy sluggers who make too many outs by hitting the balls to shifted infielders, we’d see the change in wRC+ decline as the net pull percentage increases. That’s not what happened. Bryce Harper, Chris Davis, and Shin-Soo Choo, among others, benefited from pulling more, not less.
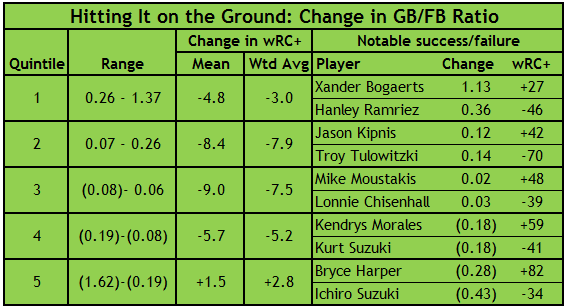
Players’ ground ball tendencies, similar to their pull tendencies, resulted in positive variance at both extremes. Players who hit the ball on the ground a lot more improved relative to their peers, and those who hit it in the air a lot more improved relatively and absolutely. Harper’s an outlier again—he pulled a lot more, hit the ball in the air a lot more, and produced a lot more runs. It’s amusing to see Red Sox teammates Xander Bogaerts and Hanley Ramirez as prime examples of what can go right or wrong if you hit a lot more ground balls.

This project turned out to be murkier than I would’ve liked. Did batters who pulled a lot less, or those who it the ball on the ground a lot more, do better in 2015 than they did in 2014? Yes, but so did those who pulled a lot more and hit the ball in the air a lot more. And those are only aggregate figures; in every quintile, there are examples of batters who were a lot better or a lot worse. And we can’t completely tease out the change in approach from the change in a batter’s health or age or the way he’s pitched. About the only thing that seems to be safe to say is that swinging more is a dubious strategy. If a player goes into spring training talking about getting more aggressive at the plate and taking a lot more hacks, we might hope that his batting coach can talk him out of it.
Writer for Baseball Prospectus
“In aggregate, batters who swung more did worse than batters who swung less.”
While I agree with you, I view it differently. My perspective is that batters that are better hitters naturally swing LESS because when they do swing, they make more contact with the baseball to begin with. The bat colliding with the baseball is more important than players who swing hard hoping the ball collides with the bat, if you get my drift.
To that end, I created 3 new stats, HEWCO, CCR, and BSM. These stats completely replace batting AVErage, OBP, SLG, and OPS, in fact it renders them utterly useless, because essentially they account for the entirety of all the positive things that are done on offense.
HEWCO states that the better players and the better teams will have LESS total strikeouts and LESS total walks and less non-competitive plate appearances overall. HEWCO believes that walks are completely overrated. If you decrease BOTH walks and strikeouts, all other plate appearances involve contact, a higher value proposition in terms of runs and RBI. Whereas AVE, OBP, SLG, and OPS do not give credit for contact outs and errors, HEWCO does so, accounting for more. It has led me to conclude that the Royals of 2015 had the highest HEWCO, the Blue Jays the second highest, 150 points behind the Royals.
CCR, or contact consistency rate, evaluates contact on its true consistency level, by taking into account the non-competitive plate appearances and the game ratio of true contact.
BSM, is bases moved. This takes into account the true nature of value in the sequence that it happens. HEWCO identifies contact outs and errors as valuable to offense, whereas the traditional metrics do not. Errors are NOT included in OBP, sacrifice flies lower your OBP, contact outs are included in the denominator of AVE, OBP, SLG, and OPS but NOT in the NUMERATOR like HEWCO, because HEWCO recognizes that you can move runners over on the base paths via a contact out, a positive thing.
These three stats together are why Matt Carpenter’s career has cratered as he made the conscious decision to sell out for power the last two years, over having 199 hits instead, like in 2013. It is also why 1980’s baseball is kicking the butt of the modern game, and in part why the Royals won the World Series and had the most contact of any other team in MLB over the last three years with the LEAST amount of walks and strikeouts.
Let me know if you want to see this in action and I can send you some data an spreadsheets. thecrazybaseballcoach@gmail.com
Thanks for reading and commenting, Eric. I think I’m generally in agreement that baseball in the 1980s was more fun–I’m always concerned about selective memory, but man, I loved me some Henderson and Raines–but while strikeout rates are obviously a lot higher today, there have been fewer walks over the past ten years (8.2% of plate appearances) than in 1980-89 (8.5%). Royals notwithstanding–I’m not going to assume one team, one year is indicative of a trend–over the past ten years the correlation between scoring runs and drawing walks is +0.56, so walking more definitely does augment scoring. That’s a pretty decent correlation coefficient. The correlation coefficient between strikeouts and runs is -0.33, which isn’t as significant.
I’d take issue with the idea that Matt Carpenter’s career has cratered. His wRC+ progression since 2012 is 124, 146, 117, 139. The year he clearly started to sacrifice contact for power was 2015, not 2014 (he had a career-low SLG and HR rate in 2014), and 2015 was his second-best year in terms of offensive performance. (See Dave Cameron’s excellent JABO article on Carpenter dated Sept. 10 for a much more thorough discussion.)