Author Archive

Dellin Betances’s Jedi Mind Tricks

Before his June 6th appearance, Dellin Betances had thrown his knuckle curve 255 times, and it had amassed a value of 8 runs above average(according to FanGraphs), but that is not the point of this post. Betances throws the knuckle curve a lot (48% of the time), batters can’t hit it (74% zone contact, 20% out of zone contact!, for a total contact rate of 42%), and when they do it’s very weakly (15% line drives, 55% ground balls, 10% popups, 0 home runs). It’s impressive  but not what I’m interested in.

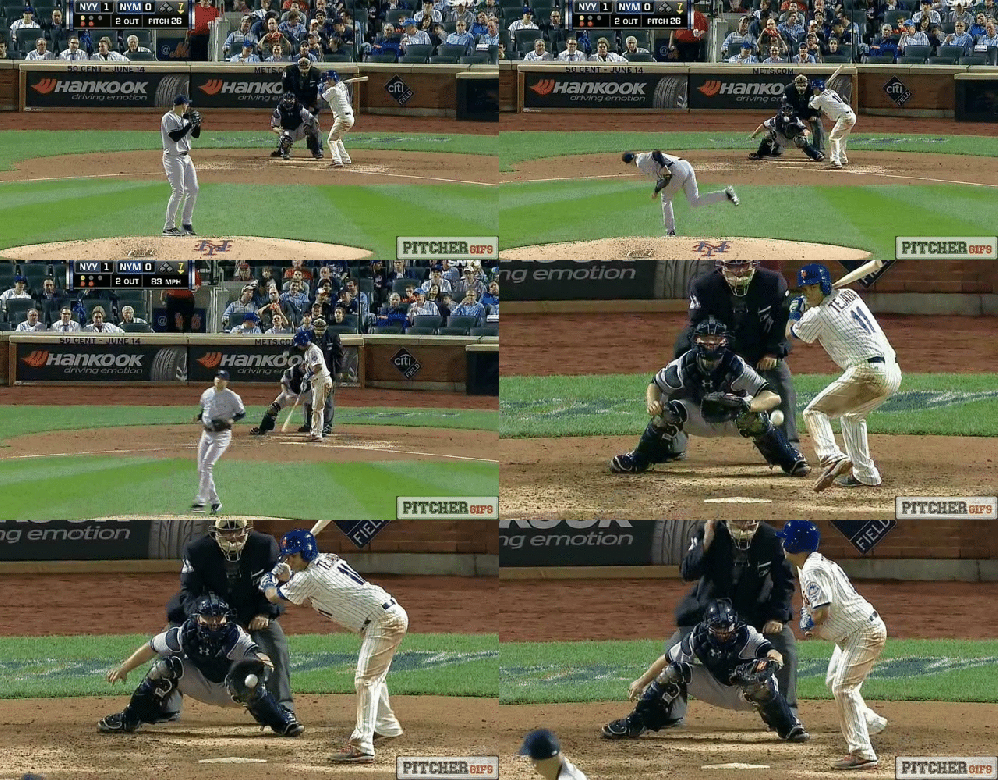
Here’s a hint, in gif form

DBKC

Batters take the pitch for a called strike all the time. They swing at the curve in the strike zone a measly 29.3% of the time. This is where it gets really crazy, they swing at it out of the strike zone 36% of the time! I’ll let that sink in. This may sound hyperbolic (it’s actually hypergeometric) but a literal blind person would be expected to do better than these pros have.  There is an 83.96% chance swinging at random would beat current major league performance.

For a little math aside, you can think of this like one of those marble problems. You have a jar filled with 116 red marbles (pitches in the strike zone) and 139 green marbles (pitches outside the zone), and you pick 84 (swing at) at random. What are the chances that out of the 84 marble you chose more than 34 are red (in the strike zone)?  You can determine the probability of picking more than 34 red marbles using a hypergeometric distribution.

How is it even possible to make major league players look so confounded (see gif above)?

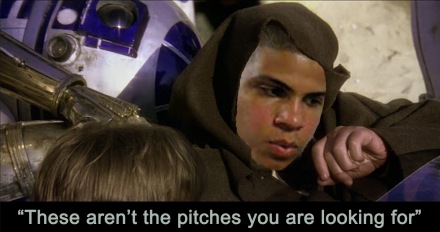
The worst approach at the plate (other than sabotaging yourself) is just swinging at random.  There is an 84% chance that the approach of  these players is worse than random. A possible explanation is hitters are actually trying to swing at more of the pitches outside the strike zone. This sounds like a really stupid strategy, because it is. The only reason hitters should do this is if they were able to crush the knuckle curve when it’s outside the strike zone. Hitters haven’t crushed any of the knuckle curves (an anemic .029 ISO), and they are barely ever hitting it when it’s outside the zone. It makes you wonder if Betances is using Jedi mind tricks.

draft4

Assuming that Betances is not a Jedi (if he was wouldn’t he use his powers on his fastball as well?), then something else has to be going on. From the batter’s reaction you can tell that the batter thought the pitch was going to hit him. So, maybe the batters are just so worried about the 95MPH heater that they are getting surprised by the knuckle curve? Still Betances threw the pitch 48% of the time; it’s not a surprise pitch.  Whatever it Betances is doing is definitely making hitters look dumbfounded. I don’t know of any other pitch that gets a higher swing rate out of the zone than in it (if you can think of a pitch that gets more swings out of the zone than in leave it in the comments).

Thanks to Pitcher Gifs for this great gif.

Also and unrelated useless fact, hitter have exactly a .000 wOBA on plate appearances ending with DB’s knuckle curve.

This is definitely something to keep an eye on and look into further.  What makes a pitch look like a ball to the batter when its in the strike zone and look like its going to be a strike when it is out of the zone. This is the only pitch I know of that can do both.

I challenge any reader to find a pitch thrown more than 200 times that has a higher O-Swing% than Z-swing%, and leave the name of the pitcher and the pitch in the comments.

All stats are from FanGraphs PITCHf/x

This article was originally posted at GWRamblings.


Peter O’Brien’s Raw Power: Estimating Batted-Ball Velocities in the Minor Leagues

On May 20th Peter O’Brien hit a massive home run to straight away center clearing the 32 foot tall batter’s eye at Arm & Hammer Park more the 400 feet from home plate.  O’Brien is currently 1 home run behind Joey Gallo, in what looks to be an exciting competition for the minor league home run title.  O’Brien isn’t as highly touted a prospect as Gallo, but he still has some of the most impressive power in the minor leagues.  Reggie Jackson saw O’Brien’s home run and said it was one of hardest hit balls in the minor leagues that he had ever seen (and Reggie knows a thing or two about tape measure home runs).

How hard was that ball actually hit?  It is impossible to figure out exactly how hard and how far the ball was hit from the available information.  You can however use basic physics to make a reasonable estimation.

Below I explain the assumptions and thought process I used to get to an estimate of how hard the ball was hit.  If that does not interest you, then just skip to the end to find out what it takes to impress Reggie Jackson. But, if you’re curios or skeptical stick around.

OBSERVATIONS

I started off by watching the video to see what information I could gather (O’Brien’s at bat starts at the 37 second mark in the video).

TIME OF FLIGHT From the crack of the bat, to the ball leaving the park – it appears to take 5 seconds. If you watched the video, you can tell this is not a perfect measurement since the camera doesn’t track the ball very closely. If you think you have a better estimation, let me know and I’ll rework the numbers.  

LOCATION LEAVING THE PARK  The ball was hit to straight away center. From the park dimensions we know when it left the park it was 407 feet from home plate and at least 32 feet in the air to clear the batter’s eye.

ASSUMPTIONS

COEFFICIENTS OF DRAG (Cd) – The Cd determines how much a ball will slow down as it moves through the air. I chose 0.35 for the Cd because it is right in the middle of the most frequently inferred Cd values for the home runs that Allan Nathan was looking at in this paper.In looking at the Cds of baseballs, Allan Nathan showed there is reason to believe that there is some significant (meaning greater than what can be explained by random measurement error) variation in Cd from one baseball to another.

ORIGIN OF BALL I assume the ball was 3.5 feet off the ground and 2 feet in front of home plate when it was hit.  These are the standard parameters in Dr. Nathan’s trajectory calculator. But what if the location is off by a foot? The effects of the origin on the trajectory are translational. One foot up, one foot higher. One foot down, one foot lower. The other observations and assumptions are more significant in determining the trajectory of the home run.

Using these assumptions and the trajectory calculator, I was able to determine the minimum speed and backspin a ball would need in order to clear the 32 foot batter’s eye 5 seconds after being hit at different launch angles.  The table below shows the vertical launch angle (in degrees), the back spin (in RMPs) and the speed of the balled ball (in MPH).

Vertical launch angle Back spin Speed off Bat
19 14121 101
21 6817 101.9
23 4155 102.75
25 2779 103.69
27 1940 104.7
29 1375 105.89
30 1156 106.5
32 805 107.88
34 536 109.4
36 322 111.1
38 149 112.99
40 4 115.1

The graph shows a more visual representation of the trajectories in the table above (with the batter’s eye added in for reference).

Looking at the graph you will notice that all of these balls would be scraping the top of the batter’s eye.  This makes sense because the table shows the minimum velocities and back spins needed for the ball to exactly clear the batter’s eye.

What is the slowest O’Brien could have hit the ball?

If you were in a rush, looking at the table you would think the slowest O’Brien could have hit the ball would be 101 MPH at 19o. But, not so fast! The amount of backspin required for the ball to travel at that trajectory is humanly impossible.

What is a reasonable backspin?

I am highly skeptical of backspin values greater than 4,000 rpm based on the Baseball Prospectus article by Alan Nathan “How Far Did That Fly Ball Travel?.” The backspin on home runs Nathan examined ranged from 500 to 3,500 rpm, with most falling in around 2,000. The first 3 entries in the table have backspins of over 4,000 and can be eliminated as possibilities. If the ball with the 19o launch angle only had 3,500 rpm of back spin it would have hit the batter’s eye less than 11 feet off the ground instead of clearing it.  Maybe you’re skeptical that I eliminated the 3rd entry because it’s close to the 4,000 rpm cut off.  Think about it this way, if a player was able to hit a ball with over 4,000 rpm of back spin, they would have to be hitting at a much higher launch angle than 23o (Higher launch angles generate greater spin while lower launch angles generate less spin).

The high launch angle trajectories with very little back spin (like the bottom three in the table) are also not very likely.  A ball hit with a 40o launch angle would almost certainly have more than 4 rpm of back spin.  If the ball hit with the 40o launch angle had 1,000 rmp of back spin (instead of 4) it would have been 70 feet off the ground, easily clearing the 32 foot batter’s eye.

Accounting for reasonable back spin, the slowest O’Brien could have hit the ball is 103.69 MPH at 25o with 2,779rpm of backspin.

So what do all these observations and assumptions get us?

We can say that the ball was likely hit 103.69 MPH or harder, with a launch angle of 25o or greater.  103.69 MPH launch velocity is not that impressive, it is essentially the league average launch velocity for a home run.  Distance wise, how impressive of a home runs was it? Unobstructed the ball would have landed at least 440 feet from home plate (assuming the 25o scenario).  The ball probably went further than 440 because it did not scrape the batter’s eye. So, how rare is a 440+ foot home run? Last year during the regular season there were 160 home runs that went 440 feet or further, there were a total of 4661 home runs that season, meaning only 3.4% of all home runs were hit at least that far.

For those of you who wanted to just skip to the end. My educated guess is that the ball went at least 440 feet and left the bat at at least 103.69 MPH.

If you like this, you can read other articles on my blog GWRamblings, or follow me on twitter  @GWRambling

None of this would have been possible without Alan Nathan’s great work on the physics of baseball.  I used his trajectory calculator to do this, and I referenced his articles frequently to make sure I wasn’t way making stupid assumptions. The information on major league home run distance is based off of hittrackeronline.com


Will-power?

Will Middlebrooks is a popular pick for a breakout player (at least according to the local Boston media).  Now breakouts aren’t really something you can predict, but I will not go into that whole can of worms.  On the surface Will Middlebrooks seems like an obvious choice, a young player with power, coming off a down year with no serious injury history.  The hopes for a Middlebrooks breakout upon closer inspection seem to be driven by hope and optimism rather than actual facts.

Middlebrooks’s glaring flaw last season was his sub .300 OBP (.271), which was driven in large part by his low walk rate (5.3%) and high strikeout rate (26.2%).  Believing that Middlebrooks can improve those numbers is central to any hope that he will have a breakout season.  Alex Speier  showed that it’s not unprecedented for young power hitters with sub .300 OBPs to see a large improvement in the OBP area, but it’s also not guaranteed.  Of the players Speier looked at only 18% saw their OBP increase by 30 points or more (which is what it would take to get Will over .300), so why does the Boston media believe that Middlebrooks will experience this rare transformation?

The main driving narrative behind this optimism is that Middlebrooks was over aggressive and had terrible plate discipline last year, and this allowed pitchers to dominate him. But now that he has worked on his approach at the plate during spring training everything will come together.

This “Willpower” narrative goes all the way to the top

Red Sox manager John Farrell told reporters “I think last year we saw some at-bats where maybe he was pressing a little bit, maybe trying to make up for some previous at-bats where it would cause him to be a little overaggressive or expand the strike zone, That willingness to swing, pitchers didn’t have to challenge him all that much” when explaining Middlebrooks past struggles.  We are led to believe that this former Achilles heel is no more after his successful spring training, as Middlebrooks told reporters “The one thing that sticks out to me is I’ve swung at one pitch outside of the zone this spring.”

Will Middlebrooks had a great spring training ( .353/.389/.667) but spring training stats are useless for predicting regular season success.  And, as it turns out, are far from the only problems with this “Willpower” narrative.  The idea that Will Middlebrooks was overly aggressive and had bad plate discipline is something that can be checked very easily by looking at Middlebrooks’s plate discipline stats vs the league average for last season.

Did Middlebrooks have poor plate discipline last season?

2013

pitches/PA Swing% 1stP Swing Contact O-Swing% Z-Swing% Z-Contact Zone% Swstr%
Will

4.11

46.6%

26.2%

75%

30.8%

64.5%

81.4%

47%

11.5%

Lg ave

3.86

46.4%

25.3%

79.5%

30.9%

65.8%

87.2%

44.5%

9.2%

Will Middlebrooks plate discipline compared to the average major leaguer.

Checking the number reveals the surprising fact that Will Middlebrooks’s plate discipline was not terrible but surprisingly average.  He appeared to be a little bit aggressive, swinging a bit more at the first pitch but those 0.9 percentage points translated three more plate appearances with Will swinging at the first pitch hardly enough to ruin his triple slash line.  The next surprising thing that the numbers reveal is that pitchers were actually throwing Middlebrooks more strikes than the average hitter (and more compared to what he saw the previous season), so while pitcher might not have had to challenge him, they didn’t shy away from throwing him pitches in the zone.  Middlebrooks actually saw a lot more pitches in the strike zone than other power hitters.  For players with at least a 0.190 ISO and at least 350 PA only Jayson Werth saw more pitches in the strike zone .  These facts throw the whole premise of this “Willpower” out the window.

How does the image of Will Middlebrooks the aggressive hacker persist when it’s clearly untrue?

Well whenever you see such a low walk rate coupled with such a high strike out rate the easy first assumption is that the player swings at everything, this is a fare guess if didn’t have better data, but we do.  But what about some on who watched every single Middlebrooks plate appearance such as his manager, how could they have such a distorted view.  Well everything is relative, relative to an average major-leaguer Middlebrooks’s plate discipline and his approach were average but compared to other players on the Red Sox Middlebrooks was aggressive and undisciplined.  The Red Sox as a team swung at the first pitch less often than any other team in the majors.  So when not watching Middlebrooks, John Farrell was watching some of the most patient and disciplined hitters in baseball so this is an understandable bias.

The highly improbable feat of chasing only one pitch out of the strike zone over 26 plate appearances.

Now let’s look at Will’s assertion that he only chased one pitch out of the strike zone over his first 26 plate appearances (that’s the number he had prior to his quote).  This would be incredible and might even be meaningful if it were true.  We don’t have spring training plate discipline numbers so we will do a Gedankenexperiment (what Einstein called thought experiments because he was German) and assume the Will saw 100 pitches over those 26 plate appearances (lower than his career average rate and a bit below league average) and half of those were out of the strike zone (also generous considering that usually more than half of pitches are out of the strike zone and in spring pitcher are rusty and of a lower talent pool) this would give Will Middlebrooks a 2% chase rate ( chances are it would have to be lower than that for him to only chase one pitch over 26 plate appearances but we are giving him the benefit of the doubt).  This would be really impressive for a guy who normally chased around 30% of pitches (it would actually be impressive for anyone), and it’s a number that no one has ever sustained for a full season.

How rare is 2% chase rate over that short a time frame?  It’s so rare that no one even came close to it last year.  The closest was Shane Robinson, when last year in the month of June he had 27 plate appearances and only swung at 7.7% of pitches outside the strike zone, that was the lowest chase rate any player had during any month last season (assuming they had at least 20 plate appearances).

Given our prior knowledge about Will Middlebrooks and major-league hitters in general I will go out on a limb and say that I believe Middlebrooks swung at more than one pitch out of the zone.  I bet Middlebrooks believes he only swung at one pitch out of the zone, and this more than anything might point to a flawed understanding of the strike zone.  So while any player can improve by improving their plate discipline (case in point that Joey Votto can still benefit from it) its not a cure-all for baseball problems, and Will Middlebrooks’s problems extend beyond his plate discipline.

If plate discipline wasn’t the reason Middlebrooks was terrible last year then what was the problem?

Part of Middlebrooks’s problem was his abysmal .263 BABIP, this will likely be closer to league average in 2014 and is probably one of the best reasons to believe that Middlebrooks will be better than he was last year.  Unfortunately it sounds much better to say you are working on your plate discipline in spring training than to say you are hope your BABIP will regress towards the mean.  But BABIP is only part of the picture it doesn’t explain his 5.3% walk rate and 26.2% strikeout rate (the low BABIP and therefore production might have led pitcher to throw Will more strikes thus diminishing his walk rate, but this would only be a small effect).

Middlebrooks’s real problem seems to be with making contact, especially when it comes to pitches in the strike zone. He was 212th out of the 237 players with at least 350 PA last year in terms of zone contact (that means 89% of players are better than him), making contact only 81.4% of the time when he swung at a pitch in the strike zone.  This low zone contact rate is probably a large part of the reason pitchers felt comfortable throwing him so many pitches in the zone.  This issue was further compounded by the fact that when Will did make contact the ball went foul slightly more than half of the time (50.4% compared to the league average of 48.1%).  This leads to his high strike out rate.

Look at it this way:

a)      when Middlebrooks swung his chance of making contact with the ball was below average, and

b)      when he did make contact the chance of that ball going in fair territory was below average, and

c)       if that ball was put in play the chance of it being a hit was well below average.

These issues meant pitchers could throw Will lots of strikes, and if a player with average discipline sees fewer balls than average then they are going to walk less than average.

Will Middlebrooks will most likely be better than he was last season (more of a bounce-back than a breakout), and he might even have a breakout season but it will take more than improved plate discipline for that to happen.


All stats are from FanGraphs (used the regular plate discipline stats not the pitch f/x ones) with the exceptions of pitches per PA, 1st pitch swing%, and foul ball stats which are all from baseball-reference.com

Also the quotes are from the Alex Speier article, although I believe they were given to the media in general.
Young Power / What Could Have Been if Miguel Sano Didn’t Need Tommy John Surgery

Twenty-two players have hit 150 home runs or more by the age of 25 (Per baseball reference, the last season included is when a player is no older than 25 on June 30th of that season).  The list below is a who’s who of players that hit for power at a young age. You’ll notice a large number of active players have accomplished this feat, and that 10 of the 17 retired players are in the Hall of Fame.

Rk Player HR From To Age
1 Alex Rodriguez

241

1994

2001

18-25
2 Eddie Mathews

222

1952

1957

20-25
3 Jimmie Foxx

222

1925

1933

17-25
4 Mel Ott

211

1926

1934

17-25
5 Mickey Mantle

207

1951

1957

19-25
6 Frank Robinson

202

1956

1961

20-25
7 Albert Pujols

201

2001

2005

21-25
8 Orlando Cepeda

191

1958

1963

20-25
9 Ken Griffey

189

1989

1995

19-25
10 Andruw Jones

185

1996

2002

19-25
11 Johnny Bench

179

1967

1973

19-25
12 Hank Aaron

179

1954

1959

20-25
13 Miguel Cabrera

175

2003

2008

20-25
14 Joe DiMaggio

168

1936

1940

21-25
15 Juan Gonzalez

167

1989

1995

19-25
16 Jose Canseco

165

1985

1990

20-25
17 Prince Fielder

160

2005

2009

21-25
18 Tony Conigliaro

160

1964

1970

19-25
19 Adam Dunn

158

2001

2005

21-25
20 Bob Horner

158

1978

1983

20-25
21 Hal Trosky

155

1933

1938

20-25
22 Willie Mays

152

1951

1956

20-25


A few more active players look like they are about to join the club

Three favorites are Giancarlo Stanton, Mike Trout and Bryce Harper. According to the Oliver five year projection system, each of these players will reach over 150 home runs by the end of his age 25 season.

Player CareerHR Born Age Oliver HR-25 Career +Oliver average projected HR Average needed to reach 150
Giancarlo Stanton

117

1989

20-23

73

190

36.5

16.5

Mike Trout

62

1991

19-21

108

170

27

22

Bryce Harper

42

1992

19-20

159

201

31.8

21.6

This chart shows each player’s current home run totals, the seasons played through so far, the number of additional home runs Oliver projects through the 25 season, the projected total runs by the age of 25 (Career HR + Oliver projected), and finally what each player would need to average to hit 150 runs by the age of 25. This last measure is interesting because it gives you an idea of what level each player would need to fall below to miss the mark.

Minor league players might knock out A-Rod for #1

Miguel Sano, Joey Gallo and Javier Baez make up a trio of minor leaguers who Oliver believes could also make the list.  Not only does Oliver project these three players will to fly past 150 home runs, he predicts Sano and Gallo could pass A-Rod for the most home runs by age 25.

Name BDAY Oliver hr25 Oliver K 25
Miguel Sano

5/11/1993

247

1030

Joey Gallo*

11/19/1993

228

1277

Javier Baez

12/1/1992

209

963

*the Gallo projections are only through his age 24 season so if he kept up the home run pace he would be in the 270s at the age of 25

While Sano, Gallo and Baez have a high number of projected home runs, they also have a high number of projected strikeouts. Adam Dunn shows that you can be very successful as a player who strikes out & hits home runs frequently. But the three minor league players could be even more extreme. Dunn struck out 26% of the time and homered 5.7% of the time through his age 25 season.  The minor league trio are predicted to strike out between 32 and 43% of the time and homer between 7 and 8% of the time. Could these three players redefine the all or nothing hitter, or are they somehow breaking projection systems?


Reasons to be skeptical

The Oliver model is complex and would take a long time to completely dissect, but from what I can tell it has the following limitations (these limitations are intentional because they add other value to the projections system):

#1 The Assumption of Games – Oliver projections assume a player gets 600 major-league plate appearances every year. This is not necessarily a given because top minor league players will likely spend part of a season in the minors before moving up to the majors, or in Sano’s case miss games rehabbing an injury.

#2 Inherent Uncertainty –  First, projections based off minor league numbers have more uncertainty than those based off major league numbers. Second, each additional year projected in the future adds more uncertainty because each year you go out you are guessing what happened the previous year – vs. knowing what happened the previous year. Compounded, these two stated effects create a good deal of inherent uncertainty.


So, what does this all mean?

If the projections are anywhere close to correct, it looks like we are going to see a new breed of power hitter in the major league soon. Although the projections are far from foregone conclusions, it’s another great reason why we watch the game of baseball.


Gravity (Not the Movie)

One of the great things about baseball is that it’s played in so many different ballparks, each with their own quirks and different dimensions. Much has been written about how different ballparks affect the game: the different distances of the fences, the size of the foul area, the altitude, and even what days the locals hang their laundry outside. These various park factors affect more than just the results of batted balls. They also influence the number of walks and strike outs. I want to take a look at a more esoteric park factor that has to my knowledge been ignored up to this point. Gravity. In high school you were probably told that gravity on Earth was a constant 32 ft/s2 (or 9.8 m/s2), which was actually a white lie.  To be exact, the Earth’s gravity is 32.1740 ft/s2 (or 9.80665 m/s2), but more importantly gravity is not constant.

There are several reasons the Earth’s gravity as we experience it is not constant. First, the Earth is not a perfectly uniform sphere. When mathematically approximating gravity we make the assumption that the Earth is a perfectly uniform sphere. But, since the Earth is not perfectly round and uniform, this assumption leads to a small error in the approximations and does not account for gravitational variations in different locations.

Second, gravity is dependent on your distance from the center of the Earth. Gravity is inversely proportional to the square of the distance between two objects, say between you and the Earth. The further away from the Earth you are, the weaker gravity is, g = g0 (re /(re+h)) where re is the radius of the Earth, g0 is gravity at sea level, and h is how high you are above sea level. For example, at Coors Field g=g0(20,925,524.9/(20,925,524.9+5,219.82)) this equation tells us that gravity is 32.157913 ft/s2  at Coors Field, or  0.05% less than gravity at sea level (32.1740 ft/s2).

The third reason why the Earth’s gravity as we experience it is not constant is related to the centrifugal forces caused by the Earth spinning. The fact that the Earth is rotating does not actually change gravity (well this is a lie according to relativity there will be some rotational frame dragging but this effect is extremely hard to detect and surely won’t have a measurable effect on baseball). Centrifugal forces appose gravity and make items feel lighter. These forces are strongest near the equator (where you are the furthest from the Earth’s axis and therefore moving the fastest) and weakest near the poles (where you are closer to the Earth’s axis and rotating more slowly).  An easy way to remember this is gravity will be weaker the closer you are to the equator.

Let’s take a break from all this math for a bit. Here is the juicy part, the table below shows the gravity at all the different major league ballparks and the percent increase or decrease in gravity compared to the average gravity at all the ballparks (this is based on EGM2008, made easily available thorough wolfram alpha). Negative percentages indicate a decrease in gravity, while positive percentages indicate an increase in gravity.

Team g (ft/s2) % change
Miami Marlins

32.11348

-0.126%

Tampa Bay Rays

32.11936

-0.108%

Houston Astros

32.12558

-0.088%

Texas Rangers

32.13392

-0.062%

Arizona Diamondbacks

32.13474

-0.060%

San Diego Padres

32.13553

-0.057%

Atlanta Braves

32.13608

-0.056%

Los Angeles Dodgers

32.13887

-0.047%

Angeles

32.14466

-0.029%

Colorado Rockies

32.14466

-0.029%

Oakland Athletics

32.15333

-0.002%

Giants

32.15341

-0.002%

Average

32.15395

0.000%

St. Louis Cardinals

32.15517

0.004%

Kansas City Royals

32.15538

0.004%

Cincinnati Reds

32.15677

0.009%

Washington Nationals

32.15742

0.011%

Baltimore Orioles

32.15886

0.015%

Pittsburgh Pirates

32.16099

0.022%

Philadelphia Phillies

32.16119

0.023%

New York Mets

32.16435

0.032%

New York Yankees

32.16442

0.033%

Cleveland Indians

32.16511

0.035%

Chicago White Sox

32.16655

0.039%

Chicago Cubs

32.16697

0.041%

Detroit Tigers

32.1684

0.045%

Boston Red Sox

32.17023

0.051%

Milwaukee Brewers

32.17096

0.053%

Toronto Blue Jays

32.1744

0.064%

Minnesota Twins

32.17764

0.074%

Seattle Mariners

32.18997

0.112%


(If you are paying close attention: 1) you might have noticed the average gravity in the table is lower than our conventional constant for gravity, 32.1740 ft/s2. The average gravity in the table above is the average gravity at major-league ballparks only, not  the average gravity of all points around the world. 2) The table value for gravity at Coors Field does not exactly match what we calculated earlier. This is because the measure we calculated earlier did not account for centrifugal force or the effects of a non-uniform Earth. The gravity for Coors Field in this table allows for those factors.

The difference between the two most extreme ballparks is 0.07649 ft/s2.   Alone this number seems small and is hard to conceptualize. I’ve gone ahead and explored a few different baseball scenarios to illustrate its effects.

So, what does 0.07649 ft/sreally mean for the game of baseball?

1. Players are measurably lighter at lower gravity ballparks.

CC Sabathia feels just a little lighter while pitching in Miami than when in Seattle, a whole whopping 0.69 lbs lighter!  (Perhaps this is why when so many players travel to Florida for Spring Training they report feeling in the best shape of their life…)

2. An outfielder will have slightly longer to catch a fly ball in a lower gravity ballpark.

A fly ball with 4.5 second hang time at an average park would stay in the air 5.7 milliseconds longer in Miami, and in Seattle it would be in the air for 5 fewer milliseconds. That almost 11 millisecond difference in hang time between Miami and Seattle would mean that a running out fielder might cover 2 more inches in Miami, not enough to make any reel difference but interesting nonetheless.

3. Pitches will sink less in a lower gravity ballpark.

Pitches will sink less in Miami than they will in Seattle, but how much less? On a 65 mph slow curve it takes the ball about 0.650 seconds to reach the plate. This ball will drop 0.2 inches lower in Seattle vs. Miami. An average pitch taking 0.45 seconds to reach home plate, will only drop an addition 0.09 inches in Seattle vs. Miami. For comparison the diameter of a baseball bat is 2.6 inches or less.  A 0.2 inch difference is 1/13 the diameter of a baseball bat, which is too small of a difference to turn a hit into a swing and miss.

4. Home runs will travel farther in a lower gravity ballpark.

When it comes to home runs one would think differences in gravity would start to play a bigger role. Because home runs are in the air longer, gravity is bound to have a greater effect on them than it does on pitched balls. The hang time of a home run is usually a full order of magnitude longer than that of a pitch. Assuming identical weather conditions, a baseball hit 120 MPH at a 26o angle would travel 13 inches (THAT’S MORE THAN 1 FOOT!) farther in Miami than it would in Seattle. That could make a difference, not in the actual score, but in what seat in the bleachers the ball would land. Although a foot is the largest difference we have talked about so far, practically it doesn’t really matter much for a no-doubt home run that’s traveling over 460 feet.

5. Just for Fun…

On the surface of the Earth if we wanted to look for extremes we would see the highest gravity at the South Pole, which would be 32.26174 ft/s2 or 0.335% higher than the average gravity at a major league ball park (this and a few other factors would lead me to believe that playing in the South Pole would really suppress home runs). The other extreme would probably be in Quito, the capital of Ecuador (there is actually a volcano in Ecuador with slightly lower gravity but let’s look at one plausible hypothetical) where gravity is 32.04248 ft/s2 or -0.347% below average. In Quito Sabathia would be 1lb lighter than he would at an average ball park and 1.3 pounds lighter than he would in Seattle. That same hypothetical 120 mph home run would go 0.9 feet farther in Quito than it would a an average ball park, and 1.3 feet shorter at the South Pole. This is of course completely hypothetical because we are assuming all other conditions are the same at these two ball parks such as air density and temperature, and this definitely not the case.

Thanks to

National Geospatial-Intelligence Agency for publicly releasing the Earth Gravitational Model EGM2008

Alan Nathan for providing the trajectory calculator tool, which I used to calculate difference in batted ball distances, the calculator can be found on his website http://baseball.physics.illinois.edu/trajectory-calculator.html


Another Look at Tom Glavine’s Generous Strike Zone

Jeff Sullivan recently suggested that despite his reputation Tom Glavine did not pitch to a significantly more generous strike zone. Sullivan points out Glavine did not get significantly more called strikes than other pitchers, even during the peak of his career. Sullivan’s analysis piqued my interest and made me wonder if Glavine’s reputation for getting a wider strike zone helped him succeed in ways beyond called strikes.

Glavine’s reputation alone likely influenced a batter’s behavior at the plate, encouraging batters who were behind the count to swing at questionable pitches. Batters believed if they did not swing these pitches would be called strikes for Glavine (when a batter swings at a pitch out of the zone when the batter is ahead of the count that has more to do with a pitchers stuff than the batter giving the pitcher an expanded zone). So, what would we expect from a pitcher who is getting batters to expand the strike zone? You would expect batters to make poor contact, yielding a lower BABIP. The batter would most likely swing at pitches outside the zone when the batter is behind the count.

Based on this reasoning, I hypothesize that Tom Glavine will see a greater reduction in quality of contact when he gets ahead of the count than a league-average pitcher. I’m going to look at the time span from 1991 to 2002 because that was the time span Jeff looked at and because I like palindromes.

To measure quality of contact I will be looking at BACON (batting average on contact). BACON is slightly different than BABIP because BACON includes home runs. If batters are expanding the strike zone when Glavine is ahead in the count we should see the quality of contact decrease. To measure the decrease in quality of contact, I will look at the ratio of BACON when Glavine is ahead to BACON to when Glavine is behind (the lower the number the greater improvement the pitcher experiences by getting ahead in the count). I will refer to this measure as EXP (a lower EXP shows a greater decrease in quality of contact, an EXP above 100 shows an increase in quality of contact).  The graph below compares Glavine’s EXP to the league average EXP for each season during the 11-year span.

 The league-average EXP is consistent year to year, hovering around 91, which suggests batters expand the strike zone for most pitchers when batters are behind in the count. Glavine’s EXP is not always better than the league-average EXP. In ‘94 and ‘96 Glavine was actually worse when ahead in the count than when he was behind.  This is to be expected because BACON takes a while to stabilize. Looking at Glavine’s data for a single season is subject to a fair amount of random noise because you have a relatively small sample of data. One season for Glavine gives us about 170 fair balls with Glavine ahead and 280 fair balls with Glavine behind. However, over a larger sample BACON stabilizes. At around 2,000 fair balls (more than in a single season for Glavine) BACON stabilizes. For example, when looking at the league-average EXP for a full year BACON is stable — with 3,500 fair balls with the pitcher ahead of the count and 4,600 fair balls with pitcher behind the count.

To make sure we are not just attributing skill to some random variation we need to look at a larger sample for Glavine. Over the 11 year span form 1991-2002 Glavine induced weaker contact (lower BACON) than the league average both when he was ahead of the count and behind the count. This is not surprising as we would expect a good pitcher to be better than average ahead and behind the count.  What’s interesting is Glavine has better than league-average EXP  (87 vs. 92) which suggests Glavine is better at expanding the strike zone than league-average pitchers. This comes with the caveat that while we have 3,056 fair balls when Glavine is behind the count, we only have 1,853 fair balls when Glavine is ahead — just shy of the 2000 at which the measure should stabilize.  Even so, the difference between Glavine’s EXP and the league-average EXP is very convincing.

Glavine (1991-2002)

MLB ave (1991-2002)

Ahead Behind EXP Ahead Behind EXP
BACON

0.266055

0.304319

87.42626

0.303134

0.330999

91.58153

To stabilize BACON, I increased the sample by looking at all the balls put in play. I compared balls put in play when the pitcher had two strikes to balls put in play when the pitcher had fewer than two strikes, which led to EXP2: the ratio of BACON when a pitcher has two strikes, to when he has fewer than two strikes. The table bellow shows a comparison of the quality of contact in two strike counts to non-two strike counts.

Glavine (1991-2002)

MLB ave (1991-2002)

2 Strikes Not 2 Strikes EXP2 2 Strikes Not 2 Strikes EXP2
BACON

0.275

0.302

91.22

0.3118

0.331

94.19

Even with this larger sample size Glavine’s BACON is still lower than the league average in respective counts. More importantly, his EXP2 is still better than league average (although higher than his EXP).  Pitchers in general try to induce weaker contact when they are ahead of the count, but the data shows Glavine is doing something special to induce even weaker contact.

Is Glavine getting batters to give him a wider strike zone? We cannot definitively say what is causing this pattern in the data, but we are seeing the type of numbers we would expect to see if the batter was giving him a wider strike zone.


All splits number are from Baseball-Reference.