Luis Castillo is Going to Be Just Fine

Following what was a great debut season in 2017, Luis Castillo has been disappointing. The young righty sported the third-hardest average Fastball (97.5 mph) of all major league starters last season, trailing only Noah Syndergaard and Luis Severino. This year, his average velocity on the heater is 95.8 mph — Almost two ticks below what it was in 2017, which is surprising when considering that he is only 25 years old. This is a young pitcher that recently broke into the league, whose fastball velocity has dropped for no real apparent reason, as far as public information has indicated.

Diving into the data, the first aspect of Castillo’s game that stands out as changed is his Four-Seam Fastball usage, which has gone down from 50.6% last year, to 34.9% in 2018. Instead he’s opted to throw his Sinker 22.2% of the time, in contrast with his 11.6% rate throwing the pitch in last year’s campaign. Castillo is also using his Changeup slightly more often this year, while backing off from utilizing his Slider somewhat, in comparison with his reliance on each pitch last season.

When a pitcher has a blistering Fastball like Castillo does, it usually makes a lot of sense for them to use it to challenge hitters with frequency. In throwing his Four-Seam Fastball about half the time last year, Castillo was quite successful. Fellow high-velocity righty Luis Severino was a Cy Young candidate whilst throwing his own Four-Seam Fastball in 51.7% of his pitches.

The question of why the velocity has decreased is effectively up in the air for now, though perhaps Castillo has been throwing it with less frequency because he knows it’s not the same as it was last year. Regardless, it’s hard to say whether his drop in velocity would be able to facilitate the same usage and success of his Four-Seamer this season, as during the last one — Due to its loss in velocity.

What can be examined to better understand his recent changes, are Castillo’s mechanics — And more specifically his release point, as it relates to his arm action. First off, is a Four-Seamer he threw in a July 2017 start basically middle-up in the zone at 96 mph:

Animated GIF

The next is a middle-up located Four-Seamer thrown at 94 mph, in his April 11th Start against the Phillies:

Animated GIF

These are nearly identical pitch locations, just thrown in different starts, with two strikes. Notice anything different between the two? Looking at the gifs is not sufficient for understanding what’s changed in Castillo’s mechanics since last season.

Take a look at the freeze frame of the release points on each pitch:

His arm slot is higher on the right than on the left, which could be the culprit of his struggles. He threw the Four-Seamer with an average vertical release point of 5.90 feet in his April 11th start against the Phillies, despite his average being 5.71 feet on the pitch last season. What’s puzzling is that his arm slot has actually been lower on average this season in comparison with where it was during the last.

What’s changed between his starts in 2017, and first three outings in 2018 — Is that his arm slot has been very inconsistent between games this year. For example his vertical release of the Four-Seamer was on average 5.58 feet above the ground, during his opening three starts in 2018. Could his variation in arm slots be to blame for his loss in velocity?

Perhaps, though what’s important is that Castillo bumped his velocity up in his last start. His Four-Seamer averaged 96.1 mph on April 16th versus the Brewers, in comparison with the Four-Seamer’s average velocity of 95.5 mph in earlier outings. His velocity is trending in the right direction! He’s certainly on the right track towards getting back to his 2017 form. There are further signs of his improvement, as well…

Here’s the comparison between Castillo’s start last year, and his most recent April 16th start against the Brewers:

His arm slots here are definitely closer, and the data on his start indicated that his vertical release point on Fastballs was 5.68 feet in his April 16th start — Nearly identical to the 5.73 foot vertical release point on it in 2017. The recent signs in his last start provide evidence that he’s going to be fine.

In the box score, his last start doesn’t look great. He gave up four earned runs, but when watching the final inning in which he was charged with the runs, it’s clear he really just ran into some bad luck. Quickly getting the first two outs, Castillo gave up a slowly hit single up the middle, and the Brewers’ pitcher got a two-RBI hit on a pitch that jammed him. It was an unfortunate ending to an outing that should have resulted in him throwing 7 shutout innings. Context is always important, and in the case of his last start, this holds especially true.

There should be little worry about Castillo moving forward, despite his rough beginning to the season. Finding his release point has been difficult to be consistent with, though with the kind of velocity he has, it isn’t surprising. This is a rare power pitcher even in the context of many pitchers’ newfound increases in velocity. Some bumps in the road shouldn’t slow Castillo, who is ultimately a front of the rotation starter.

All Data taken from Brooks Baseball, Fangraphs, and Statcast – Video from MLB.com


The Coors Field Hangover?

Recently, a brief exchange I had sparked some renewed interest in Coors Field. It’s the most offensively generous park in baseball by a good margin and because of that, people tend to cite context-neutral stats to assign less significance to phenomenal performances by Rockies’ players if they don’t outright Nerf their stat lines without a second thought.  But those context-neutral stats like wRC+ aren’t perfect. The most relevant imperfection to consider here is that the park adjustments are somewhat unrefined in their application.

For this thought experiment, I’ll consider Nolan Arenado as an example, and I’ll mainly be using wRC+ and fWAR to measure his value, so we need to first determine how FanGraphs applies their park factors (PF).

  1. They use a 5-year regressed value in their calculations, so if a stadium happens to play drastically different one year, that value won’t have as extreme an effect on stat calculations. Coors Field’s 5-year PF (116) is close to its 1-year PF (115), and Arenado plays relatively few games in other stadiums outside his division so we won’t consider this to be a real issue in evaluating him.
  2. When applied, park factors are divided in half to account for players only playing half of their games in their home park. In my calculations, I am splitting Arenado’s stats by the stadium he played in so I will not need to adjust park factors initially.
  3. Third, players are assumed to play their away games in a league average setting, meaning when calculating wRC+, etc. for Arenado in San Diego, for instance, Petco Park is considered a neutral park.

Surely, Petco and other parks don’t magically become neutral environments for visiting teams, so why not account for that? Let’s consider the case where Arenado does get more credit for playing outside of Coors Field.

I started by splitting Arenado’s offensive stats by stadium and finding wRC+ and fWAR, as they are typically calculated to make sure that if my numbers are ultimately off, it’s not because they started wrong.

Statistic FanGraphs My Calculation
fWAR 5.6 5.67
wRC+ 129 129.14
wRAA 42.6 42.82

There is some rounding error here, and given that I entered a good amount of data by hand, there is a chance I made some manual mistakes, but the results are close enough for me to feel like I can move forward.

Now, the fun part. Let’s change every PF to its “correct” mark, including an adjustment for Arenado only playing 78/81 possible games at home.

The Coors Field PF becomes 1.3081, and the weighted average of away PFs for Arenado is .9773. After applying these, we find somewhat of a lackluster result:

Statistic New Calculation
fWAR 5.81
wRC+ 130.33

There’s some improvement, but it’s about as “some” as “some” can get. Regardless, this is an adjustment that could (and arguably, should) be made for every player in the league, so it’s not really the difference maker I’m trying to uncover.

But wait. There’s more!

Isn’t there some kind of Coors hangover? I mean, Coors Field hangover? As in, don’t Rockies hitters tend to perform worse than expected on the road due having to adjust to pitches moving differently at a lower altitude? Maybe. Or probably depending on how you want to look at it.

Consider this slightly dated article by Jeff Sullivan. In this piece, Sullivan admits to reading some compelling reasoning in favor of the Coors Field hangover being real, but in compiling his own data, he found that the Rockies do not tend to improve their batting line as a team as their road trips continue. So if the hangover is real, it looks like it doesn’t ebb and flow. If anything, it is a persistent detriment — a “disease” as Sullivan says rather than a “hangover.”

Assuming the effect is real, we still can’t really project how much more productive batters would be if they were left unaffected by atmospheric changes, especially because the magnitude of this effect likely varies greatly from player to player. What we can do though is adjust the park factors of the stadiums Arenado visits so that whatever results he actually produced there are worth more when we calculate his advanced stats.

Because I can’t definitively say how much we should adjust each park factor, I’ll simply change the weighted average we calculated earlier in small increments. For Arenado (and Rockies in general), let’s make our away PFs 1 to roughly 8 percentage points lower (more favorable when adjusting values) so that the most generous case is equivalent to assuming Arenado plays all of his away games in Citi Field or Petco Park with no hangover effect (both have 95 PF/10% worse than league average).

Change in PF (in percentage points) New Away PF New wRC+ New fWAR
-1 .9673 130.81 5.85
-2 .9573 131.28 5.90
-3 .9473 131.75 5.94
-4 .9373 132.23 5.98
-5 .9273 132.70 6.02
-6 .9173 133.18 6.07
-7 .9073 133.65 6.11
~ -7.73 .9000 134.00 6.14

Here, we’re seeing what may be an upper limit to what essentially is a Coors Field hangover adjustment.

It is possible that the proposed hangover effect is even more detrimental to Rockies hitters on the road than this though. Over the last three years, in NL West parks, the Rockies here is how the Rockies have performed compared to the rest of the league according to xwOBA:

Venue Rockies xwOBA League xwOBA % Difference Rockies xwOBA Ranking
AT&T Park  .294  .310  -5.16%  20/25
Chase Field  .324  .323  0.31%  13/25
Dodger Stadium .267 .299 -10.70% 17/25
Petco Park .277 .296  -6.42% 13/25
Coors Field .320 .318  0.63% 11/25

Among the parks they’ve played in the most, the Rockies have had the most trouble in Dodger Stadium. Of course, these xwOBA measures do not account for the quality of competition so your Kershaws and Jansens might be putting a damper on things here, but given that Dodger Stadium is about 267 ft. above sea level, visiting LA gives us a good mix of changing atmosphere, typically competitive pitching, and about the largest sample size possible. So if we’re of the mind to translate that roughly 11% decrease in expected production to an 11% more favorable run environment (by PF), that seems like it would function well as an upper bound on a season-long, league-wide statistical “advantage” of the Coors Field hangover adjustment.

If we adjust our previously adjusted away PFs for Arenado one last time to a value 11% more favorable (roughly 87 PF), we land on 6.27 fWAR with a 135.42 wRC+. Arenado isn’t suddenly giving Mike Trout a run for his money, but he looks up to a half-win better when we give him credit for the fields he actually plays on and when we attempt to make a correction for the alleged Coors Field hangover.

Based on this data it would appear that the hangover only works one way — that is, Rockies players do not seem to suffer upon moving back to Coors Field — but given their substandard lineups since 2015, some of the Rockies’ roughly average xwOBAs, particularly at home, surely warrant some consideration. Still, we could be robbing select Rockies players of up to a half-win per season (per FanGraphs) and a handful of points on their wRC+ simply by assuming that changing altitudes doesn’t create additional difficulties while batting. I don’t advocate a total shift in perspective, particularly because I didn’t seek to change my opinion on the existence of the hangover while writing this, but at the very least, we should approach the evaluation of Rockies hitters with a little more thoughtfulness.


An Early Look at Adam Duvall’s Struggles

Disclaimer: I started writing this post prior to Duvall’s on Friday night, right about the time he decided he was going to make me look silly. Stats do not include games on Monday 4/15.

A quick glance at the Reds offensive production so far in 2018 provides some context for a horrendous start.  Jumping down towards the bottom of stat sheet, we find 2016 All-Star Adam Duvall, who has been off to a terrible start at the plate. He leads the team in both home-runs and RBI (not saying much at this point) but has struggled to get much going other than that and currently owns a 59 wRC+. And that follows two strong performances since I started writing this, when he had a 29 wRC+. He is not the only reason the Reds offense is struggling , but he is among the biggest culprits.

Duvall’s calling card is no secret; he is a slugger. Over the 2016 and 2017 seasons, he ranks 15th in the MLB with an ISO of .244. He hits the ball harder than average and pulls the ball more than average. So while a high pull rate isn’t necessarily a bad thing, it is interesting that he is currently well above his own normal.

View post on imgur.com

League average is just under 40% while Duvall’s career average is just under 48%. So far in 2018 he is pulling almost 63% of balls, highest in the league among qualified hitters. Even for power hitters, there is an optimal amount of pulling the ball, and Duvall is way above it. Presumably, this is not something he is trying to do, but rather has been influenced in part by pitch location.

View post on imgur.com

Not surprisingly, the highest concentration of pitches Duvall saw in 2017 (left) were on the outside part of the plate as pitchers try to avoid playing to Duvall’s strength. In 2018 (right), he has seen a more even distribution of pitches across the strike zone. So if more balls are coming closer to where he can pull them, why is he not having success?

The easiest answer is that is has not been catching any breaks. While his BABIP as of Sunday night was a .156, it had been down to a .091 just a couple days earlier. The small sample of the young season shows how quickly a couple balls here or there can change things. Still though, a low BABIP indicates that there are better days ahead.

However, in addition to the high pull rate, other components of Duvall’s batted ball profile are not ideal. He is creating more soft contact than normal and is also hitting more groundballs than normal. It is not to a level he has not been before, but his soft contact was increasing in the latter half of 2017 and could be a larger trend. And the increase in ground balls has been accompanied by an all-time low line drive rate, which is generally the result of weak contact.

View post on imgur.com

Duvall has always gotten the ball in the air, as his career average 20.1-degree launch angle and 47% fly ball rate will attest to. So far this year, it has pretty much either been in the air or on the ground. And of the balls in play to the left side of the field this year, his launch angle is 4.6 degrees, compared to 9.8 degrees last year. Even though he has gotten pitches to the inside of the plate, he has not been able to drive them as he has in the past.

View post on imgur.com

Even with a high concentration of balls hit to 3B in 2017 (left), Duvall still made good use of left and center field. 2018 (right) has been way more concentrated to the infield, with very few balls going anywhere besides 3B or LF.

On top of his batted ball profile, plate discipline metrics also tell an interesting story.

View post on imgur.com

So far this year, 42% of pitches to Duvall have been in the strike zone, just below is career average of 43.4%. While that number may be a bit low, it is nothing compared to the drop off in Swing% which is 41.8% and well below his career average of 49%. Improving selectivity is something that players are always striving to do, so this makes sense, especially at the start of a new season. And while his BB% is slightly up, so is his K%, even despite a lower SwStrike%. Dvuall is taking too many pitches in the zone, most likely as he is not yet comfortable with his new approach. However, it could be an effect of not seeing the ball well out of the gate, which could also explain the weaker contact.

It is not like pitchers have figured out a magical way to always get Adam Duvall out. There is some variance at the pitch type level, specifically more sinkers and less four-seamers, but the overall breakout between hard, breaking and offspeed pitches is very much in line with what Duvall saw in 2016 and 2017. The only variation is with how Duvall has performed against the pitches.

View post on imgur.com

Higher whiffs per swing on breaking and offspeed pitches could be another indication that he is just not seeing the ball well at this point in the year. Even though he is swinging less and swinging and missing less overall, he is really struggling with non-fastballs.

Add it all up and Duvall is getting decent pitches to hit, but he is either taking them more so than before, swinging and missing on breaking/offspeed stuff, or swinging and not making solid, hard contact, leading to a lot of grounders to third base. Time will tell if he maintains and improves upon his newfound patience and starts connecting with and driving good pitches, utilizing the power that got him here.


Momentum-Controlled and Season-Adjusted Controlled Runs Averages

                There are no current baseball statistics that truly measure a pitcher’s value. There is nothing inherently wrong with the statistics that have stood the test of time. They tell us part of the story. They are comfortable. They are easily understood. The newer sabermetrics that rely on advanced statistics or a derivative understanding of the game’s events are also good indicators of success and failure of particular aspects of baseball. This is exciting for some; unnecessary window dressing for others. They tell us our understanding of the game is evolving—even today. Perhaps most importantly, these new statistical interpretations have come from contemporaries within our lifetime. We are living in a time where we are changing the understanding of baseball for future generations. While the sport may simply be—to paraphrase Leo Durocher—running and throwing and catching and hitting, how we understand baseball is constantly changing.

I ended up developing two related metrics that have changed how I look at pitchers. What I contend is that they will make the game more accessible for you. They will help you evaluate pitchers using new metrics that focus only on what really matters, instead of being distracted by fancy peripheral numbers that do not translate into game control and seasonal dominance.

Background

Last summer, while flipping between channels to watch a couple of different ballgames, I was both frustrated and intrigued by how the broadcast crews focused on different peripheral stats—such as strikeouts-per-nine-innings, or first-pitch strike percentage—that this pitcher or that one dominated against the league. Needless to say, this was clearly an effort by each broadcast crew to show why the incoming pitcher was the obvious and correct choice for his team.

The more I thought about what I was seeing, the more I realized that everything we talk about and measure to determine a pitcher’s mettle or worth dances around the issue without addressing their primary job—controlling runs. Pitchers get paid varying degrees of fortune to control the momentum of an inning, of a game, and of a season. Controlling momentum means limiting the damage from the opposing offense. Periphery numbers are a good barometer or benchmark of being on the road to success; and having good numbers tend to accompany good game-control. However, this is nothing more than the dashboard gauges in your car telling you that it’s running properly. And anyone who has owned more than one car can tell you, each runs a bit differently, despite them all performing the same basic functions.

It quickly became apparent that most traditional methods of evaluating pitchers simply could not be correlated to measuring their ability to control the momentum of a game.

Methodology

The process of selecting which variables—raw statistics—should be included started with defining what the two hypothesized metrics were intended to measure. The first—Momentum-controlled runs—is concerned with identifying the extent to which a pitcher limits the amount of runs the opposition scores. Because this metric is focused solely on shutting down the opposition once the pitcher-in-question enters the game, we would hypothesize that relief pitchers will be overrepresented in this data set. For example, among qualified pitchers (minimum of 45 innings), Craig Kimbrel and Kenley Jansen led the league in 2017 with an MRA of 1.43 and 1.45, respectively. At the bottom of this category is Tyler Glasnow, who had a league worst MRA of 8.85, among qualified pitchers.

The second—Season-adjusted controlled runs—is concerned with quantifying how much a pitcher’s MRA helped his team over the course of a season. Because this metric is focused on a season-long effort—which suggests that a pitcher’s ability to control momentum needs to be balanced against how many innings he actually pitched for his team in a given season—we would hypothesize that starting pitchers will be overrepresented in this data set. For example, among qualified pitchers (minimum of 45 innings), Corey Kluber and Max Scherzer led the league in 2017 with an SRA of 1.97 and 2.24, respectively. At the bottom of this category is Tyson Ross, with an SRA of 27.93, among qualified pitchers.

The population sample of pitchers included everyone with at least 45 innings pitched. This was chosen to eliminate statistical outliers who did not have enough sample size to validate their inclusion in either data set. For the 2017 season, this sample included 382 pitchers. It should be noted that the size of the population sample of pitchers with at least 45 innings pitched has grown since 1995, which is the first year I included in this study. For the record, the sample in 1995 included 292 pitchers.

The next step was to determine which raw statistics would correlate to controlling the momentum of a game through limiting runs allowed. Comparing the correlation of typical or popular raw statistics—strikeouts, walks, hits, homeruns, runs allowed, etc.—to the possible formulas used to define MRA, it was determined that any raw statistics that did not show a strong correlation would not, and should not, be recognized as a major contributing factor towards controlling the momentum of a baseball game. The minimum threshold for an acceptable correlation coefficient was +/- 0.8. This was selected as the threshold because it is above the widely-accepted +/- 0.7 threshold needed to establish a strong linear relationship.

The raw statistics that met the minimum threshold of +/- 0.8, when correlated to the final formula used to calculate Momentum-controlled Runs Average (MRA), were baserunners-per-run, WHIP, and runs-allowed-per-inning. The correlation coefficient of these were -0.81, 0.83, and 1.0, respectively over a 23-year average of the seasonal correlation coefficients for the 1995 – 2017 MLB seasons. It should be noted that no other raw statistic established anything close to a strong linear relationship with the final formula.

To calculate the formula for Momentum-controlled Runs Average, a pitcher’s WHIP (walks-plus-hits divided by innings-pitched) was divided by his baserunners-per-run, with the corresponding value multiplied by 9. This yields a final MRA value that demonstrates how many momentum-controlled runs each pitcher allowed for a 9-inning game. This follows the same basic conception used to determine a pitcher’s Earned-Runs-Average (ERA), his Deserved-Runs-Average (DRA, a metric compiled by Baseball Prospectus), and his Fielding-Independent-Pitching (FIP). It was decided that calculating MRA to mirror metrics already in existence (ERA, DRA, FIP) would offer the easiest understanding for the average baseball fan.


(WHIP/(BR/R)) * 9 = MRA


It is important to establish that pitchers were held accountable for all runs allowed because their primary responsibility is to keep the opposition from scoring, whether those runs are deserved, earned, or not.

The next step was to determine how to translate MRA into a season-adjusted metric that took into consideration how many innings a pitcher controlled the momentum of each game. The obvious reason for expanding on MRA was that pitchers who control the momentum of 45 individual innings should be compared to pitchers who control the momentum of 200+ individual innings. This metric was intended to enumerate the value of a top-end closer as he compares to a starting pitcher.

To calculate the formula for Season-adjusted controlled Runs Average, a pitcher’s MRA was divided by the value of his innings-pitched divided by 162. This yields a final SRA value that demonstrates how effective that pitcher was at controlling momentum over an entire season of baseball. This also follows the same conception of ERA, DRA, and FIP; and SRA likewise mirrors those metrics in how it is scored.


(MRA/(Inn/162)) = SRA


After creating these metrics, it was determined that an adjusted version of each would provide the benefit of comparing a pitcher’s MRA or SRA from one season to that of a different season. This allows us to compare pitchers relative to their own seasonal performance from different seasons, but also to compare pitcher A from one season to pitcher B from another season. These metrics are reported as MRA+ and SRA+, respectively.


100 * ((2-(MRA/Lg. Avg. MRA))*(1/(PPF*.01))) = MRA+


100 * ((2-(SRA/Lg. Avg. SRA))*(1/(PPF*.01))) = SRA+


Results

                For the 2017 MLB season, the pitchers who led the league in MRA and SRA were household names that could be expected to demonstrate this type of dominance. What stood out were the number of pitchers who had not been properly evaluated using other traditional metrics—be they ERA or WAR. For example, Josh Hader posted the 11th best MRA in 2017 at 2.08, despite posting a WAR of 0.73 wins—which tied him for 197th best among qualified pitchers. Furthermore, Lance Lynn posted the 18th best SRA in 2017 at 3.36, despite posting a WAR of 2.15 wins—which tied him for 67th best among qualified pitchers. These are not just anecdotal examples. Instead, they are exemplary of how traditional metrics have incorrectly valued pitchers’ worth. In fact, what is most telling is not the names above these examples, but the names below them.

As mentioned previously, the raw statistics that were most closely correlated with MRA were baserunners-per-run (BR/R), WHIP, and runs-allowed-per-inning (R/Inn), using the 23-year averages of these correlations. The correlation between BR/R and MRA was -0.81. This is evidence of a strong negative relationship between the two. Basically, as the number of baserunners-per-run-scored increased for a pitcher, his MRA demonstrated a corresponding decline. A correlation coefficient of this magnitude indicates that nearly 66% of the variance in MRA is explained or predicted by BR/R.

The correlation between WHIP and MRA was 0.83. This is evidence of a strong positive relationship between the two. As a pitcher allowed fewer hits or walks per inning, his MRA demonstrated a similar decline. A correlation coefficient of this magnitude indicates that nearly 69% of the variance in MRA is explained or predicted by WHIP.

The correlation between R/Inn and MRA was 1.0. This is evidence of the strongest possible positive relationship between the two. As the number of runs-allowed-per-inning decreases, a pitcher will see an equivalent decline in his MRA. A correlation coefficient of this magnitude indicates that 100% of the variance in MRA is explained or predicted by R/Inn.

By comparison, home runs-allowed, strikeouts, and total-bases-per-run all had weak correlations with MRA. They were 0.22, -0.25, and -0.53, respectively. The strongest of these unfounded variables—TB/R—could only explain or predict 28% of the variance in MRA.

It should be noted that the correlation between MRA and SRA was 0.58. This was not unexpected as a pitcher’s SRA could not be accurately described by only his MRA, since we know that SRA is a function of controlling momentum over an entire season, whereas MRA is designed to focus on a smaller sample size.

Perhaps the most important results were found in the correlations between the adjusted MRA+ and WAR, and the adjusted SRA+ and WAR. The correlations were 0.47 and 0.56, respectively. These correlation coefficients indicate that WAR is not explained or predicted by MRA+ or SRA+. More to the point, this indicates that adjusted MRA+ and SRA+ are able to find and explain value in pitchers that is not being explained by a myriad of other metrics.

Reference for correlations of unfounded variables

Baserunners/Run and HR allowed: -.27

Baserunners/Run and Strikeouts: .09

MRA and DRA: .70

MRA and FIP: .66

MRA and HR allowed: .22

MRA and Strikeouts: -.25

MRA and TB/Run: -.53

Runs/Inn and HR allowed: -.27

Runs/Inn and SRA: .60

Runs/Strikeouts: -.25

Conclusions

The data sets that produced the metrics MRA and SRA were, quite simply, game-changing. I expected to find that I would need to incorporate complex calculations to measure a pitcher’s ability to control the momentum of a game and of season. I was wrong. The formulas used to calculate these metrics were not complex. Instead, I discovered that I needed to approach the raw statistics from a complex point-of-view that forced me to challenge my own misconceptions about what counted towards a pitcher’s success. I wanted to believe that strikeouts mattered. I wanted to chastise my team for allowing opponents to hit too many homeruns (I’m looking at you Ian Kennedy). Mostly, I wanted to criticize the Royals for signings—such as the Kennedy deal—that I wrongly believed were not working out.

For the record, Ian Kennedy posted the 31st highest adjusted SRA+ in 2016, at 162.22 (which means he was 62% above average); and he posted the 125th highest adjusted SRA+ in 2017, at 137.16 (37% above average). Maybe this doesn’t live up to what the Royals spent on him, but it changed how I internalized his value.

Moreover, I realized that when were told that Pedro Martinez posted a banner year in 2000—one that we were told redefined pitching dominance—we were previously unable to accurately measure where this season belonged in the pantheon of baseball lore. While it was an amazing season, it ranks as the 3rd best season of the Wild Card Era—just behind Greg Maddux’ 1995 season and Roger Clemens’ 1997 season. In fact, Maddux adjusted SRA+ in 1995 was 185.66 (85% above average), while Clemens posted a 184.37 in 1997, and Martinez posted a 183.78 in 2000.

We could be forgiven for recency bias when we rank the best pitchers of the Wild Card Era, as we tend to forget those performances that came in the years just following MLB’s fractious strike in 1994. However, the data simply doesn’t support that modern pitchers currently stack up to the best of the era. Randy Johnson has recorded five of the top twenty best individual seasons in adjusted SRA+ and six of the top fifty seasons of the Wild Card Era. Adding the total scores of his top-50 seasons places him nearly two seasons better than his closest competitor. Scoring the top-3 most dominant pitchers in adjusted SRA+ of the Wild Card Era, we find Randy Johnson ranked first (total score of 1078.02), Greg Maddux ranked second (total score of 723.36), and Kevin Brown ranked third (total score of 712.99). This might force you to reconsider your opinion of the Kevin Brown deal when the Dodgers signed him to the first $100-million-dollar-plus contract.

The findings were equally demonstrative in adjusted MRA+ as the top-50 individual seasons of the Wild Card Era yielded appearances by forty-four different pitchers. The most dominant adjusted MRA+ individual season was in 2016, from Zach Britton, when he posted a 179.92 (79% above average). The top-3 individual seasons in adjusted MRA+ were Britton in 2016, Jonathan Papelbon in 2006, when he posted a 179.14, and Craig Kimbrel in 2012, when he posted a 176.14.

Again, the recency bias may be misleading when we rank the most dominant adjusted MRA+ pitchers of the Wild Card Era. Remember that forty-four different pitchers graced the top-50 individual seasons list; only four pitchers posted multiple seasons on this list. Scoring the top-3 most dominant pitchers in adjusted MRA+ of the Wild Card Era, we find Craig Kimbrel ranked first (total score of 512.23), Joe Nathan ranked second (total score of 496.17), and Wade Davis ranked third (total score of 349.10). With great respect for Kimbrel, were it not for his 2017 season, Joe Nathan would be the clear favorite here.

What I hope you find when you use these metrics and you review the data I’ve compiled is that we should be looking at pitchers based ultimately on their ability to control the momentum of any given game AND their ability to exact this control over an entire season. While other raw statistics are nice and make for good drama, they simply don’t measure up to MRA and SRA. We all want to see strikeouts. They are sexy. They are the equivalent of homeruns for pitchers. We value them as the pinnacle of individual pitcher stats. We include them in the pitching Triple Crown. This shouldn’t elevate them to a level beyond that of a triple for a batter—something exciting for us to watch and recall later with our friends. To quote John Adams, facts are stubborn things. The facts, when properly correlated using appropriate data sets, show us that controlling the momentum of a game—limiting the opposition’s scoring—is the ultimate measure that adds up to wins and losses.

Enjoy these metrics. Use them to enhance your appreciation of the game we love. As always, constructive feedback is welcome.

Afterthought

I would be happy to share my data with interested parties for review. Message me and I will share a read-only version.


Gregory Polanco Is Annihilating Baseballs

The tools have always been there for Pirates outfielder Gregory Polanco, it has just been a question of whether he could put it all together with consistency in the big leagues. Well goodness, he has put it together this April! His average exit velocity is 92.8 mph in 2018, and his hits have had an average exit velocity of 100.9 mph! This is in stark contrast with his average of 86.5 mph on hits last season, which ranked 280th among Major Leaguers. Hitting Baseballs with this kind of force is nothing short of annihilation, based on the early results. His two solo home runs against the Cubs on the 12th, were a great example of how well he has played so far.

His average launch angle is 13.2 degrees, differing from a mark of 16.2 degrees last season. His launch angle on hits in 2017 was 10.1 degrees, and this year it has increased to 18.6 degrees. Even though his average launch angle is slightly down, lifting the ball has become more common for him when punishing mistakes. He has been able to get to more of his power already, as a result of hitting more balls in the air. Already having bashed five home runs so far, he looks set to easily surpass his career high of 22 taters back in 2016.

Seeing him hit the ball on average so much harder than he used to, is impressive in and of itself. When one looks at the individual batted ball outcomes, they see things like his eight batted balls hit at least 105 mph or harder. For comparison’s sake, Aaron Judge has nine, who hit the ball harder than anyone in Baseball last year. Additionally, Polanco’s twelve hits with exit velocities over 100 mph are equal to Judge’s twelve base knocks above the said velocity.

Here are his 2017 results against different pitches:

Pitch Type Pitches Hits AB AVG SLG
FF 588 44 146 0.301 0.404
SL 247 10 55 0.182 0.436
CH 176 9 45 0.200 0.356
FT 163 10 48 0.208 0.313
SI 102 9 25 0.36 0.640
CU 100 3 18 0.167 0.167
FC 83 3 17 0.176 0.294
KC 39 3 10 0.300 0.500

Given that all of his hits have been either on four-seam Fastballs, two-seam fastballs, or changeups this season, it seems likely that hitting breaking balls are a weakness in the outfielder’s game. His 0.182 average against such pitches last season, seems to confirm such a suspicion. However, his .436 slugging percentage against sliders, provides reason for optimism surrounding his ability to hit the pitch. This illustrates that Polanco can still crush pitches he usually struggles with. He hit four of his eleven home runs in 2017, off Sliders.

As for the question of whether Polanco is simply getting lucky on batted balls, the answer is that his BABIP is .231 — Which is actually the lowest of his career, across four previous seasons. Being as productive as he’s been, without much luck on balls in play, speaks to the talent he possesses. When he hits the ball hard, Polanco really can do some serious damage, as illustrated by his nine extra base hits in eleven games so far.

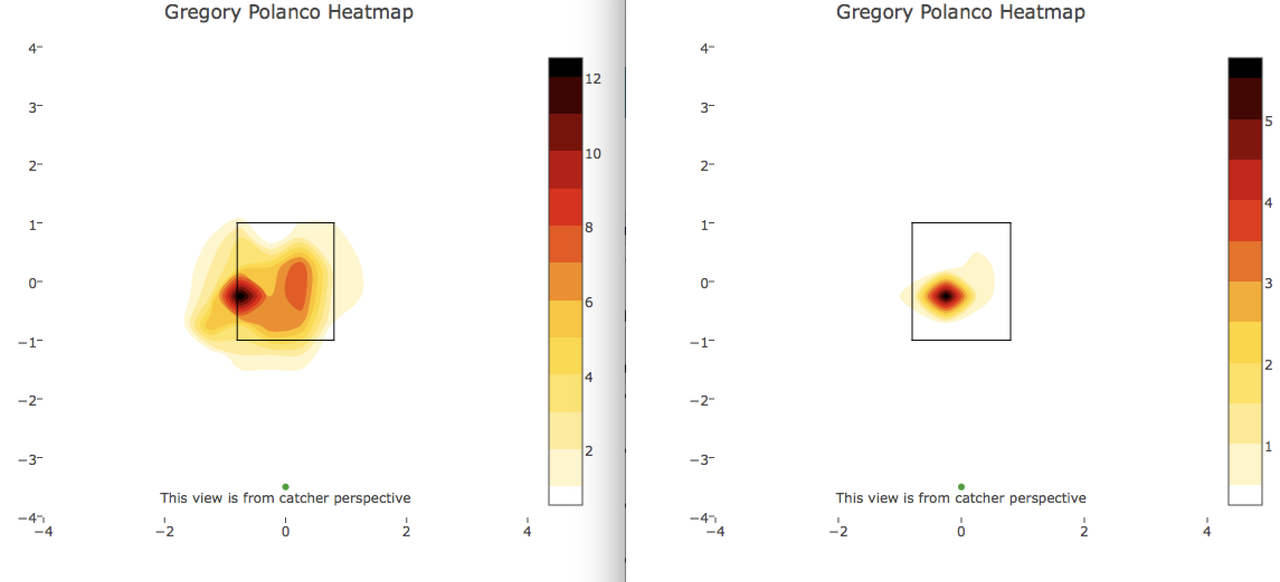
Polanco has hit more balls thrown middle-away this season, showing his ability to punish mistakes more often than he did previously. The heatmap on the left shows the locations of his 2017 hits, with his 2018 hit locations on the right:

He has gotten better at pulling his hands in and driving pitches he previously didn’t have as much success against. Last season he didn’t have many hits in the location where he’s now mashing pitches — A sign that he has probably matured as a hitter recently. The fact that there isn’t a darker zone towards the middle of the plate is due to it being the beginning of the season, so there is not concern at this point over his ability to hit pitches thrown basically right down the middle. Considering how hard he’s hit the ball on pitches towards the outside part of the plate, it would seem safe to assume that he’d crush pitches thrown more middle-in if given the chance.

Another encouraging development in his game, has been an increased number of walks this season in comparison with how often he’s done so previously. Polanco only walked 27 times last year in 411 plate appearances, yet in his 53 trips to the dish this season, he has nine walks already. Perhaps he’s just taken awhile to mature as a hitter, and only now is he beginning to flourish in the big leagues. The data suggests that he may have finally taken the big step many in Pittsburgh have long been waiting for.

Staying healthy this year will be key for him, as he missed time last season during three separate DL stints due to hamstring strains. If he can do so, the Pirates will have a dynamic outfielder who has become more patient at the dish, more selective in terms of the pitches he offers at, and most importantly annihilates mistakes for extra base hits.

What is looking great for the Pirates, is the extension they recently signed him to:

Losing Andrew McCutchen hurt, even if it mostly meant saying goodbye to a well-known star in Pittsburgh. With the emergence of Polanco, the Pirates may already have found their new face of the franchise. Given the abilities Polanco has shown this season, it is looking like his contract will be a major bargain for the Pirates. With the new star set to stick around in the Steel City for the long haul, it’s time for Pittsburgh to say hello to Gregory Polanco, only now in recognition of his immense talent and importance to the future of their team.

All Data in this article was taken from Fangraphs, Statcast,  Brooks Baseball, and Spotrac.


Finding the Mets a Catcher

Having started the year at 10-1, the Mets’ season is certainly going swimmingly. This team could realistically make a playoff run, which was something no one seemed to be certain of prior to the season. The hope for Mets fans is that the team’s decision makers in the front office don’t mess this up, or miss an opportunity to make sure this team maximizes its potential.

Mets ownership and management has been nothing short of infuriating in recent years, whether that has meant mishandling issues with injured players, failing to spend sufficiently on payroll despite being in the gigantic New York market, and countless other reasons. It seems reasonable to expect the team to be more ambitious in signing star players, or at least keep the homegrown stars healthy on the current team. The team’s treatment of medical issues are significant enough to justify their own post altogether, but exploring that will be left for someone else, or investigated another time.

Kevin Plawecki just fractured his hand, while Travis d’Arnaud is set to have Tommy John Surgery next week. The team needs help at Catcher, and if management wants to make sure this team remains in contention, they will trade for a useful backstop. Jon Heyman confirmed that the team is indeed interested in upgrading at the position:

Who could the Mets acquire via trade? The elephant in the room is J.T. Realmuto, an elite catcher who’d be an immediate upgrade over even the injured d’Arnaud and Plawecki long-term. He is also represented by CAA , like many prominent Mets stars (DeGrom, Syndergaard, Cespedes), making a trade for Realmuto seemingly more likely. In reality though, he is still on the DL for the Marlins, and the asking price in a trade for him would be far too steep for the Mets to be able to meet. Their farm system lacks the impact talent needed to land a player of Realmuto’s caliber, and trading useful major leaguers is effectively not an option for a contending team.

Could the Dodgers be convinced to deal Yasmani Grandal? Considering the performance of Austin Barnes at the end of last season, and their faith in him throughout the playoffs — It would not seem completely unreasonable for them to be interested in trading Grandal. Though for a team with serious championship aspirations, keeping around two starting caliber star-level catchers is justifiable. Add in the fact that Grandal has already been worth 0.7 WAR, and one realizes that the Dodgers very likely wouldn’t be interested in a swap.

A team can lose a catcher anytime to a concussion, or injury as a result of a foul tip, among other potential risks that are inherently a part of playing the position. Given this possibility, it’s reasonable to see why the Dodgers are content splitting playing time between two very talented backstops. The Mets are all-too-aware of this reality, with both their regular catchers set to miss significant time with injuries already this season.

If the team wanted to kind of take a lottery ticket on a Catcher, they could trade for Luke Maile, a strong defensive catcher who has hit surprisingly well to start the year. Defensively he was worth 4.9 runs in 46 games in 2017, and he has four hits with exit velocities over 105 mph already this year. If he can hit better than he has previously, Maile would be a great buy-low candidate for the team. He is blocked by Russell Martin in Toronto, so he could likely be acquired by the Mets pretty easily.

A strong option for the team, is the Cardinals’ Carson Kelly. Though he is seen as more of a defensive catcher, his 120 wRC+ in Triple-A last year illustrates that he is ready for regular playing time in the big leagues. He hasn’t hit at all in his brief major league time, yet has never gotten an extended look at the level. Being blocked by Yadier Molina, who is signed to a long-term extension, has left no real opportunity for Kelly to get the regular playing time he needs to develop as a hitter.

The scouting reports indicate that the 23-year-old has average hitting abilities, which coupled with his above-average to plus defense, should intrigue the Mets. The young backstop had an average pop-time of 1.96 seconds last season, which ranked 23rd among all major league catchers. By comparison, Travis d’Arnaud ranked 78th with an average pop-time of 2.06 seconds, while Plawecki ranked 86th with a time of 2.08. The Mets acquiring Kelly would be an upgrade for their defense at Catcher, which would be a welcome change for their pitching staff.

The Cardinals have to realize that Kelly doesn’t have a real chance to play regularly anytime soon, and the Mets know they have an obvious need behind the plate. A trade between the two teams seems like a good idea for both sides, considering each team’s situation. The latest Fangraphs prospect reports for the Cardinals in November of 2017 placed a 50 FV on Kelly, so to get a sense of what his trade value likely is, that will be used as the primary indicator.

Basically, he is expected to be a 2 WAR player per season and would be controlled through the 2023 season assuming he played the majority of 2018 in the major leagues. So this is a roughly 12 WAR player, over the course of the six years he would be under team control. As a contender, the Mets would not be interested in trading any of the players on their major league roster, so any trade would almost certainly involve sending minor leaguers to the Cardinals in return for Carson Kelly.

Mets pitching prospect Justin Dunn would seem to be a sufficient return in a trade with St. Louis, as he also received a 50 FV rating from Fangraphs prospect analyst Eric Longenhagen. A reliever initially at Boston College, Dunn started some games at the end of his final spring with the Eagles, before being selected in the first round by the Mets in the 2016 draft. He already has a strong Fastball / Slider combination in addition to a developing Curveball and Changeup, all pitches that give him the potential to have a formidable four-pitch mix. His strong pitching at High-A this season has been encouraging, and he would be a welcome future addition to the Cardinals’ 15th ranked MLB rotation by WAR.

This would be a trade to benefit both teams and would improve the future outlook of the Cardinals while helping the Mets shore up the catching position long-term. If the Mets are really committed to winning and doing so with consistency — Trading for Carson Kelly would be a strong option for the team. After all, Syndergaard and deGrom won’t be around forever.

All Data in this article was taken from Fangraphs, Statcast, and Baseball Prospectus. 


Yonny Chirinos Is Closing in on Being Awesome

Early season baseball is beautiful. It’s not that just that baseball is back. It’s that things get so weird so quickly. Take, for example, Mike Petriello pondering this:

petriello tweet

Lol, y’all. For the record, Owings is at .478 going into his game on Friday and Sanchez has worked his way to .088. So, yeah, just a few days later and things are still weird.

But some things…some things that seem weird may not be weird. Yonny Chirinos might be one of those things.

Chirinos has been on the fringe of interesting for some time. Last July, Carson Cistulli wrote about him at FanGraphs for three weeks in a row. The gist, from blurbs in those pieces, is that Chirinos tends to sit in the low 90s with his fastball but can amp it up to 96 mph. He can do it late in games, too. He also throws two offspeed pitches — a slider and a splitter — and is comfortable throwing them anytime. He’s a guy who’s gotten better as he’s faced better competition.  

And now, after injuries to Brent Honeywell and Jose De Leon and Nathan Eovaldi, Chirinos is getting the chance to face the best competition in the world. And he’s rising to the occasion again. He hasn’t allowed a run through 14.1 innings and he’s striking out six hitters to every walk. But there’s more.

Chirinos 1

Certainly, it’s early. While Chirinos is ranked here against last year’s qualifiers, he wouldn’t actually qualify yet for this year. No pitcher does, because it’s so early. Plate discipline numbers tend to stabilize quickly, though. After just his first couple games, the odds are good that hitters will continue to make contact at the same rate against Chirinos that they already have. After a couple more starts, we’ll be able to say with relative conviction if he’ll hit the zone the same way he has through his first three appearances. The same goes for the rate at which he’s coaxing swings out of the zone.

Things get a little foggier when it comes to Chirinos’s first pitch strike rate. He’s probably only a fifth of the way toward that crazy 71.7% number becoming reliable. But let’s consider how he’s done it to this point. Statcast has him at 18 called first pitch strikes, five whiffs, and eight foul balls. He’s throwing about three sinkers to every slider at the start of an at-bat, and occasionally gets funky by throwing something else. But it’s mostly a two pitch mix. And if you check the leaderboards so far, you’ll see he’s surrounded by loads of legitimate and other emerging talent.

Once he’s gotten ahead, Chirinos has done well by distributing his three primary pitches well, supporting the reports linked above from last season. His sinker runs one direction, his slider jumps the other, and his splitter acts like it’s fruit falling through the bottom of a grocery bag. In any given matchup, he can control three parts of the zone.

Chirinos 2

Just about the only way Chirinos could be making more of an impact right now is if he were going deeper into games. He’s averaged a shade over 60 pitches per appearance so far, and 64.5 per start. I don’t know if the Rays are stretching him out, or if they’re being super cautious against him facing batters a third time, or both. The team’s history may suggest they’ll eventually be willing to let him go further into games, though. The Rays rank tenth in MLB from 2015-17 in innings thrown by starters.  More than 22% of those innings can be attributed to Chris Archer alone, but it’s still worth keeping an eye on.

Either way, it’s probably fair to hedge a bet that Chirinos could continue producing really effective five inning outings and sprinkle in a few that are more than that.

Sometimes, what seems weird is actually just a new kind of awesome.

Plate discipline data from FanGraphs. Pitch mix data from Baseball Savant.


Cesar Hernandez Swings Less, Hits More

Getting talked up as a second baseman can be hard. Jose Altuve, Brian Dozier, Daniel Murphy, and Jonathan Schoop occupy a lot of that conversation. Other, older guys like Robinson Cano and Ian Kinsler are still kicking around. Whit Merrifield says hello from Nowhere, too. And then there’s Cesar Hernandez, who seems to get talked up most for how underrated he is.

He’s one of only two holdovers on the Phillies since he came up in 2013 — the other is Luis Garcia — so even after this offseason of the team shedding some of that sluggish rebuild weight and adding some bona fide muscle, they must see something in him. He’s not just an asset to turn. This is true even after signing Scott Kingery, whose primary position is the same as Hernandez’s, to a six-year extension before he’s even played a single game in the Majors.

Hernandez is remarkably consistent. He strikes out less than 20% of the time, walks more than 10%, will display occasional pop, and can handle the glove at the keystone. But even consistency needs to evolve sometimes in order to keep pace, and we may have seen the next step from Cesar Hernandez last year.

hernandez plate discipline

The change, in a word: discipline. Per Pitch Info, we can see how Hernandez apparently decided to just stop chasing pitches out of the zone. In the first half, he ranked 29th in MLB, directly ahead of Edwin Encarnacion, and fourth at his position. That’s already pretty good. But in the second half, he shot up to eighth in MLB and tied with now-teammate Carlos Santana, and second at his position.

It’s one thing to see a relatively sharp change in a stat and be able to acknowledge how a player’s performance improved or declined. It’s another to process how directly it possibly influenced his overall production. Consider that Hernandez swung at 5.2% less pitches in the second half. Nearly 80% of that decrease was the direct result of letting pitches outside the zone go. That’s four balls for every called strike.

The difference in Hernandez’s approach fueled a drastic increase in OBP and was a big reason he became 25% better than league average at creating runs. It’s no wonder he went from being worth less than a win before the All-Star break to 2.4 after it.

Check out the gifs below. They’re both of the switch-hitting Hernandez swinging from the left side at a pitch to the same outside third of the plate:

Baseball GIF-downsized_large (1)

Mlb GIF-downsized_large

The first is against a Yu Darvish fastball in May and resulted in a weak groundout to Elvis Andrus. It has a nice Fox Trax spot to show you how it was out of the zone. The second is against a Robert Gsellman fastball in September, around the same outside third of the plate, and was a double. This one doesn’t have a tracker showing you it was more over the plate, but, per Statcast, it was.

If you’ve heard of pitchers working the plate side to side, Hernandez does a little bit of the same with his swing, working horizontally. He pulls out his hips behind him and lets his bat drive through the zone on a similar plane. The small difference in pitch selection between the two gifs was the difference between a dribbler and an extra-base hit, and Hernandez made this a regular thing from mid-July and on.

It appears as though he didn’t make any mechanical change that allowed him to better cover the plate or access the ball when it got there. This is true whether he batted lefthanded or righthanded. His plate discipline, then, really does seem to be the result of simply choosing to swing at only what’s within the zone. Last August, I wrote about Rhys Hoskins being exciting in the context of the current Phillies, and how he offers a threat that the rest of the lineup doesn’t. If Hernandez’s plate discipline sticks in 2018 — the handful of games so far hasn’t allowed for a stable sample size yet — then he, too, will offer a skill that makes the lineup tougher and more of a threat.

It’s been a weird year for the Phillies already. Between Gabe Kapler and younger talent making a push for playing time, it could get much weirder. But an eye like Cesar Hernandez’s at the plate every day could help steady the ship.

Pitch Info Data from FanGraphs. Gifs made with Giphy. 


Who’s the Best (non-Bonds*) Baseball Family in History?

One of my favorite things about baseball is its deep reverence for history. While the relatively recent advent of sabermetrics is sometimes scorned by “traditionalists,” baseball has always been a data-loving sport. So much so, the man credited with inventing the box score all the way back in 1859 — a full year before Abraham Lincoln was elected President — was given a prestigious spot in the Hall of Fame. Any discussion of “who’s the best?” is always going to be subjective, and that’s part of the fun.  Whether you’re a casual fan, avid Fangraphs reader, or true baseball historian, I think this article will offer some insight (and fun debate) for everyone.

As it happens, the term “WAR” meant something very different then.

Even casual baseball fans have an understanding of batting average, home runs, runs batted in — all statistics that have been around for more than a century — and still have plenty of relevance even in the era of analytics. Some might say, baseball’s respect for tradition runs so deep, that there was (and still is) a great deal of mismanagement and inefficiency in areas like scouting, player utilization, and player valuation. Perhaps one thing that worries traditionalists is that the game is being reduced to a “science” such that we are removing the fun of debating things like “who’s the best?” While I hope even staunch traditionalists understand that on-base percentage is more important than batting average in determining offensive value, allow me to put your mind at ease: we are a long, long, way from being able to predict with any reasonable accuracy/confidence how a player will perform. Suffice it to say, there is still plenty to debate when it comes to comparing players from past and present, and projecting the future. As you read, take part in the polls to cast your vote in the head-to-head “best family” debate. At the end, you can cast your overall vote.

In more than 140 years as the National Pastime, fewer than 20,000 players have ever played in a Major League Baseball game. For some perspective, only about 10% of players who are drafted will ever reach The Show; and even among first-round picks — youngsters so highly sought after that they are made millionaires before they even play a game in the minor leagues — only about two-thirds will make it the majors, and even most of them won’t amount to much. With so few players to ever make the big leagues, with so many barriers to success, it’s amazing to learn just how many had parents or siblings in the majors. Unlike a sport such as basketball where most players are very tall, thus heritability playing an obvious role, Major League Baseball players are mostly normal-sized human beings (the average player is about 6’1 190) with no immediately evident genetic superiority compared to the average Joe.

Pictured: elite professional athlete whose dad also played in the MLB (photo from Men’s Health)

Interestingly, genetics may actually play an even more vital role in success in baseball than in basketball. You have probably heard that hitting a baseball is the hardest thing to do in all of sports, and that’s probably true (Ted Williams said it, who am I to argue?). It’s not enough that pitchers throw the ball as hard as they can with pinpoint control, they also throw the ball as hard as they can with pinpoint control and make it move. 

Good luck! (Source: MLB GIFS)

When it comes to hitting a baseball at the professional level, it requires an elite combination of hand-eye coordination, strength, reaction time, visual acuity, and I assume some sort of animal sacrifice. It turns out, the average MLB player has 20/12 vision. If you’re not sure why that is so insane, consider that the best possible vision a human could have is somewhere between 20/10 and 20/8. When your decision whether or not to swing — and how to position your hands and body for that swing — is within a window of literally milliseconds, the difference between elite and unknown could depend on a few extra milliseconds of pitch recognition. While vision is only one factor, it does appear to be an important prerequisite in success at the highest level. When you have such extreme outliers genetically, it at least somewhat answers the question “why have there been so many siblings/parents to play Major League Baseball?” Which brings us to the real question:

Who is the best family to ever play?

Here are the basic criteria I looked at in my research:

  1. Grandparents, parents, siblings — minimum 5 seasons played
  2. Fangraphs WAR
  3. Minimum of 6 “third-WAR” combined
  4. No family member active in the minor leagues

While WAR (wins above replacement) may be an imperfect statistic, it is a great place to start, as it allows us to compare players from different eras and players from different positions with one number. I decided to, admittedly somewhat arbitrarily, use the player’s third-best season in terms of WAR (third-WAR) to value them. To me, this fairly encompasses how good the player was in their prime, while excluding outlier seasons. It also avoids the difficulty of understating a player’s greatness just because they enjoyed a long career, as might happen if you simply used a career average or median, or overrating a player who was good for awhile but never great. Based on this, let’s take a look at some of the greatest baseball families:

third-WAR is the player’s WAR in their third-best season. While somewhat arbitrary, it is a metric that reflects a player’s skill in his prime, while removing outlier seasons.

From this, as expected, the Bonds family is far and away the most impressive. While you may be thinking “but Barry’s career should have an asterisk” don’t forget that even before his alien stretch starting with 73 home runs he had already had some of the best seasons in baseball history. And his father Bobby was responsible for five of the first ten 30 home run/30 stolen base seasons in MLB history. After the Bonds family, who would you take on your father-son-sibling squad?

Before I did any research, the obvious answer seemed like the Griffeys. In a lot of ways, the Griffey family mirrors the Bonds’ in that dad was great but under-appreciated in his era, while Junior’s greatness had him in the conversation of “greatest of all time” during his prime. Of course, injuries plagued Ken Jr., while Barry enjoyed a long, healthy career. As I delved deeper though, I was surprised to find that the Griffeys may not even be the best baseball family in Cincinnati Reds history.

This Boone-Larkin-Boone-Larkin infield actually appeared together, but just once. Stephen Larkin, younger brother of Hall of Famer Barry, only played in one MLB game. (Photo credit Cincinnati Reds)

Four Boones or two Griffeys?

Now comes the discussion of quality over quantity. No one would argue that Ken Jr. in his prime wasn’t superior to any of the Boones, but the Boone package includes four very good players. To complicate matters in this very serious cross-generational debate, Aaron, Bret, Bob, and Ray even played unique positions for much of their career (3B, 2B, C, and SS respectively).

So who would you take? Below are the “third-WAR” seasons for each family.

Bret Boone, 2B: .278/.339/.462 (3.9 WAR) 24 HR/107 RBI, Gold Glove
Aaron Boone, 3B: .267/.327/.453 (2.1 WAR), 24 HR/96 RBI/23 SB
Bob Boone, C: .256/.310/.337 (3.2 WAR), 7 HR/58 RBI, Gold Glove
Ray Boone, SS: .295/.376/.466 (3.9 WAR), 20 HR/85 RBI/4 SB

Ken Griffey, LF: .294/.364/.454 (3.5 WAR), 13 HR/85 RBI/23 SB
Griffey Jr CF: .309/.408/.617 (8.4 WAR), 45 HR/109 RBI/17 SB, Gold Glove

Is there a wrong answer here? Looking only at WAR, the Boones edge out the Griffeys. The case to be made for the Boones is that you’d be able to fill four very important positions with all-star caliber players. But if you want to get technical, not all WAR is created equal (for example, one 8 WAR player is better than four 2 WAR players, because 2 WAR players are easier to replace). A superstar Junior and an all-star Senior is a very tough duo to pass on. But at the risk of repeating history and trading four players for Griffey (more on Mike Cameron in part two — dads with prospects) I’m going to go with the quartet of Boones.

What do you think? Go here to vote.

I’m not sure if “launching knuckleballs for game-winning home runs to send your team to the World Series” is a stat, but I know who leads it. (Photo credit: InsideSoCal)

What about the Alous?

Not to be outdone, the Alou family has an important place in this discourse, too. By the third-WAR metric, they actually edge out the Boones for the #2 spot. The four big leaguers from their family present a noteworthy, even if less well-rounded bunch than the Boones:

Moises Alou, OF .339/.397/.592 (4.7 WAR), 22 HR/78 RBI/7 SB
Felipe Alou, OF .297/.338/.481 (5.1 WAR), 23 HR/78 RBI/8 SB
Jesus Alou, OF .324/.345/.417 (0.4 WAR), 2 HR/19 RBI, 3.3% K%
Matty Alou, OF .338/.372/.413 (3.4 WAR), 2 HR/28 RBI/16 SB, 7.2% K%

Moises and Felipe make for a formidable tandem themselves, but the high average and contact rates of Jesus and Matty are what makes this foursome competitive with the Boones. Ignoring the fact that we have four outfielders (Matty and Felipe both played some first base as well) this group compares favorably to the Boones on paper; Moises and Felipe would be preferable to any of the Boones, while Matty is a fun guy to remember and had a nice career too. But for me, the fact that the Boones cover three premium positions (C, 2B, SS) makes up for the less impressive offensive numbers. Perhaps I’m biased in that I grew up watching Aaron and Bret, while Moises is the only Alou I had a chance to see play.

In any case, the WAR (which does take into account positional value) disagrees with my opinion — what do you think? Vote here.

“Your opinion is wrong” is how every good debate should end.

Bells and Alomars

Moving on to the trios, we’ll start with the Bell family. We have Buddy, one of the most underrated players in history, leading the group; Buddy won six gold gloves as a third baseman, hit for average and power, but never received much attention (or Hall of Fame consideration) because he played for some bad teams and was a contemporary of the best third baseman in history. David was a true journeyman, playing for 7 teams in 12 seasons, but put together some very good years as a utility infielder. Grandpa Gus was lucky enough to play for the Redlegs when they actually changed their name to “Redlegs.”

Youngest brother Mike appeared in a few games in 2000, but didn’t qualify for this list. (Photo credit: Blavity)

The Alomars, led by Hall of Famer Roberto, would make for an elite defensive squad in any era: Sandy Jr. behind the plate with Sandy Sr. and Roberto as the double play combination at short and second.

While Sandy Jr. certainly looked the part of a power hitter (he’s listed at both6’3 and 6’5 but was remarkably athletic for his size) he never hit more than 21 HR in a season. I was surprised to learn, that other than his breakout .324/.354/.545 season during which he mashed those 21 homers, he was mostly an average offensive catcher for his career. Sandy Sr. had a very long, successful career in the MLB as a speed-and-defense middle infielder, though he was never feared at the plate. Roberto, meanwhile, was one of the most valuable players of the era; he played a premium position at second base (and did so quite well — hence the ten gold gloves) while also hitting for average, power, and being a force on the bases. For a stretch of ten seasons from 1992–2001, Roberto hit .300 nine times, posted a double-digit walk rate six times, and in each of those six seasons he walked more than he struck out. He also won nine gold gloves, and stole more than 300 bases in that time frame. The Alomar versus Bell comparison is tough, if only because Roberto was so damn good.

Buddy Bell, 3B: .329/.379/.498 (6.0 WAR) 17 HR/83 RBI, Gold Glove
David Bell, 2B/3B: .261/.333/.429 (3.1 WAR) 20 HR/73 RBI, 12.7% K%
Gus Bell, OF: .299/.349/.465 (1.8 WAR) 17 HR/101 RBI/5 SB, 8.5% K%

R. Alomar, 2B: .310/.405/.427 (6.1 WAR) 8 HR/76 RBI/49 SB, Gold Glove
S. Alomar, 2B/SS: .239/.277/.305 (1.0 WAR) 2 HR/39 RBI/28 SB
S. Alomar Jr., C: .288/.347/.490 (2.0 WAR) 14 HR/43 RBI/8 SB, 9.7% K%

As hard as it is for me to do — given my preference for guys who play up the middle (and totally healthy baseball man crush on Roberto Alomar) — the Buddy-David-Gus combination is just too solid for me. I think Buddy is very underrated, and although not on the level of greatness Roberto, I’d take David and Gus over Sandy Jr. and Sr. You could just as easily make the case for the Alomars, as I did for the Boones, that despite lower WAR you might prefer the premium positions.

Would you pick the Bells or the Alomars?

If you don’t have a baseball crush on Roberto Alomar, I didn’t do him justice. (Photo credit: El Nuevo Dia)

Martinezes and the importance of pitching

Yes, it’s true, that is how you make “Martinez” plural. Now that that’s out of the way, let’s talk about the family that I think will be the toughest to categorize.

So far, we’ve only had families of position players on our list. While theStottlemyres represent an impressive pitching duo, it’s hard to compete with Pedro and Ramon. While Pedro’s highest WAR seasons don’t match up to those of Bonds, he has a real case for the best pitcher of all-time, coming from an era that was totally unfair to pitchers. To complicate matters, we are faced with the fact that pitching wins championships. And now we are faced with some limitations of the WAR statistic. Just for fun, which season do you think was better? (follow link to vote):

Griffey Jr CF: .309/.408/.617 (8.4 WAR), 45 HR/109 RBI/17 SB, Gold Glove
Pedro Martinez, P: 17–8, 241.1 IP 1.90 ERA/2.39 FIP (8.5 WAR) 32.2% K%

Considering that these seasons are even from the same era, we aren’t even tasked with grading on a curve. WAR would give a slight edge to Pedro in this category — though basically a tossup. Here’s the Martinez family compared to the Griffeys:

Pedro Martinez, P: 17–8, 241.1 IP, 1.90 ERA/2.39 FIP (8.5 WAR) 32.2% K%
Ramon Martinez, P: 17–7, 206.1 IP, 3.66 ERA/4.21 FIP (2.2 WAR)

Ken Griffey, LF: .294/.364/.454 (3.5 WAR), 13 HR/85 RBI/23 SB
Griffey Jr CF: .309/.408/.617 (8.4 WAR), 45 HR/109 RBI/17 SB, Gold Glove

From this, the Griffey family seems far superior to the Martinezes. Why, then, do I really want to pick Martinez family? I think that depends on how you think about the question “who is best?” If you view the question as an observer, and are merely comparing groups of stats, the Griffeys are the clear choice. But if you are like me, and for some reason imagine yourself picking these families to participate on your “team” then you might find yourself taking the dominant, ace pitcher over a Hall-of-Famer and All-Star combo.

Go here to vote between the Martinezes and Griffeys. 

If there was a 0.000001% chance it would work, I’d build the shit out of some fields (Field of Dreams).

Greg and Mike Maddux

Speaking of dominant aces, the Maddux family creates an almost impossible choice between pitching families. While Mike had a successful career, mostly as a reliever for ten different teams across fifteen seasons, it was younger brother Greg that puts this duo in the same category as Pedro and Ramon.

For an era dominated by batters that were bigger, faster, and stronger than ever before, it’s suiting that one of the purest finesse pitchers in history shut them down so consistently. Like Pedro, Greg did not have what most would consider ideal size for a pitcher; unlike Pedro, Greg never posted gaudy strikeout numbers, and relied on pinpoint command and pitch movement. 

This tailing fastball, combined with pinpoint command, helped make Maddux absolutely dominant.

The young, lanky version of Maddux topped out in the mid-90s according to scouting reports at the time. However, many of those same scouts doubted his ability to make it as a starter in the Majors. He struggled mightily in his first season with the Cubs, and again the following season even with extended innings: his ERA was north of 5.5 both seasons. Even still, scouts were turning the corner on their evaluations, noting his solid “stuff” and athleticism — in those rough two seasons he was only 20 and 21 years old. He broke out in a big way the following season, evolving into the “Mad Dog” we know today, largely thanks to his improvements in command and less reliance on a hard fastball.

After five more great seasons with the Cubs, Greg left via Free Agency for the Braves. The already great Maddux somehow got even better with the Braves. Across a span of ten seasons, Maddux posted — get this — more than 72 WAR. While Pedro was more dominant at his peak, Maddux was elite for a much longer span, posting a WAR over 5 for a full twelve seasons. For comparison, we have to lower the bar to 3 WAR to find twelve seasons for Pedro. At 3 WAR, Greg had nine-freaking-teen seasons (as in, 19) where he cleared that. And I guess the eighteen gold gloves that Greg won are worth mentioning, too.

This is what makes the Pedro vs. Greg debate tough: is a long span of elite performance more impressive than a shorter span of flat dominance? If you think the two are close, does the fact that Ramon was more valuable than Mike make a difference in the best pitching family debate?

Pedro Martinez, P: 17–8, 241.1 IP, 1.90 ERA/2.39 FIP (8.5 WAR) 32.2% K%
Ramon Martinez, P: 17–7, 206.1 IP, 3.66 ERA/4.21 FIP (2.2 WAR)

Greg Maddux, P: 15–11, 245 IP, 2.72 ERA/2.73 FIP (7.8 WAR), Gold Glove
Mike Maddux, P: 7–2, 5 SV, 98.2 IP, 2.46 ERA/3.08 FIP (1.4 WAR)

Go here to vote between these two pitching families.

Ripkens

While Ryan Ripken is still an active minor league player, which would technically make the Ripkens a part of my part two discussion of families with active prospects (will be linked once article is complete) I decided to include them here because Ryan doesn’t seem to have much promise as a 24 year old struggling in A ball. Barring some very late blooming, it’s just Cal and Billy representing the Ripkens. I have to admit, while I enjoy all of the research I’ve done to put this article together, the most enlightening research has been on that of Cal.

As a relatively young baseball fan, this is about the beginning of my experience watching Cal play. (Photo credit: NY Daily News)

While his durability and the number 2632 are probably the first things that come to mind when you think of Cal Ripken Jr., this amazing consecutive games played record (which I believe will never be broken) may actually be a disservice to him, in that it overshadows just how great of a player he was. He is credited with being the progenitor of offensively-capable, taller shortstops, but he is still in my opinion the greatest shortstop not named Rodriguez to ever play. He hit for average, power, took walks, didn’t strike out much, and was highly regarded defensively (2 Gold Gloves, and probably would have had more if not for Vizquel). In terms of longevity, Cal posted fifteen straight seasons of 3.5+ WAR. In terms of an elite prime, he had a stretch of nine years in which his WAR was 5+ in eight of them.

As far as greatness goes, this is a rare time when “Hall of Famer” doesn’t do a player justice. (Photo credit)

When you tell your children of Cal Ripken, lead with the numbers that show his greatness…then tell them he didn’t miss a game for more than sixteen full seasons.

Cal Ripken, SS: .317/.371/.517 (8.5 WAR) 27 HR/102 RBI, MVP
Billy Ripken, 2B
: .239/.284/.305 (0.9 WAR) 2 HR/26 RBI/1 SB

Billy was a rightful big leaguer — which isn’t always the case when it comes to family members with famous last names — but mostly a light hitter who made himself valuable by being a very good defender.

Since Cal Ripken and Greg Maddux both had long, glorious careers with a period of dominance, let’s compare their families. Who would you take?

Gwynns, Uptons, Fielders, and Cruzes

As for the honorable mentions, there are some impressive duos, and I’m sure I inevitably missed some.

Tony Gwynn, RF: .329/.381/.467 (6.2 WAR) 14 HR/59 RBI/37 SB
Tony Gwynn Jr., CF: .256/.308/.353 (1.6 WAR) 2 HR/22 RBI/22 SB

Gwynn Sr. might have been the purest hitter ever. His career average was an astonishing .338, and he walked (7.7%) far more than he struck out (4.2%). His final season in the league, at age 41, he went .324/.384/.461 and still walked more than he struck out. There’s no doubt that he could have contributed for longer, had he chosen to do so. Gwynn Jr. had a few solid seasons of his own, with great speed and plate discipline, but never hit for much average or power.

Justin Upton, OF: .300/.366/.532 (4.9 WAR) 26 HR/86 RBI/20 SB
Melvin Upton, OF: .237/.322/.424 (3.8 WAR) 18 HR/62 RBI/42 SB

The book on Justin hasn’t really changed since he was drafted #1 overall in 2005: great hitter, good speed. His brother Melvin (formerly B.J.) was drafted #2 overall as a shortstop in 2002. While Justin Upton still has plenty of years ahead of him at just 30 years old, older brother Melvin looks to be nearing the end of an intriguing career. After holding his own offensively as a 20 year old, but with some difficulties defensively at SS, Melvin was moved to CF where he thrived. At age 23, he broke out with a .300/.386/.508 slash line — with 24 HR and 22 SB. He followed that up with a less impressive .273/.383/.401 season, but added 44 SB. The power, speed, plate discipline, and defensive abilities were all there; though he never quite became a superstar he did have a productive career. It’s worth mentioning Dmitri and Delmon Young, who did not reach the minimum third-WAR threshold, but were drafted #4 and #1 overall respectively, and were the first brothers to be taken in the top 5.

Prince Fielder, 1B: .299/.415/.566 (4.7 WAR) 38 HR/120 RBI, 15.5% BB%
Cecil Fielder, 1B: .244/.325/.458 (2.5 WAR) 35 HR/124 RBI, 10.8% BB%

It’s safe to say that Prince made his dad proud with his career, even if it ended a few years too soon due to injury. While the notoriously chubby Prince stole more bases (18) than his hulking father (2) these guys were paid to mash. Prince was the better overall hitter, but his dad still holds the family home run record with 51 (Prince topped out at 50). By some wild coincidence, both father and son finished their careers with the same number of home runs — 319. While Prince only ever played first base, Cecil was wedged into the lineup at third and even second base, giving us this great box score:

Dammit I love baseball: Cecil Fielder and Kelly Gruber swapping positions 18 times, even mid at-bat. (Source)

Jose Cruz, OF: .315/.376/.460 (4.8 WAR) 10 HR/83 RBI/37 SB
Jose Cruz Jr., OF: .241/.358/.433 (2.5 WAR) 14 HR/45 RBI/14 SB, 15.5% BB%

In this case, junior didn’t quite live up to the legacy of his dad — but it was a high bar to reach. Cruz Sr. had seven seasons of 4+ WAR, and twelve consecutive seasons of 2+ WAR. Cruz Jr. had a 30/30 year and a few other productive seasons, but it was a tough era to stand out as a bat-first outfielder. Which leads us to…

The forgotten family of baseball

In putting together this list, I almost neglected to include the Gileses, and that’s a major oversight. It’s a mistake I don’t want saavy baseball fans who value knowledge about random baseball history to make. Most of the other articles I found on the topic don’t even mention the Giles family at all — it seems the “underrated” moniker has stuck with them long into retirement. Check out these third-war seasons:

Brian Giles, OF: .315/.432/.594 (6.3 WAR) 35 HR/123 RBI 16.6% BB%
Marcus Giles, 2B: .311/.378/.433 (3.0 WAR) 8 HR/48 RBI/17 SB

Unlike Marcus who had a few great seasons and was gone, perhaps a beneficiary of the “third-WAR” metric, Brian was a truly elite outfielder for about a decade.

Brian’s career began in the unenviable position of being an unheralded prospect — drafted in the 17th round — stuck in the minor leagues behind an outfield consisting of Ramirez, Lofton, Belle. On top of that, the acquisition of veterans (and future Hall of Famers) Dave Winfield and Eddie Murray to fill the Indians’ DH vacancy effectively blocked Giles from any chance at-bats. Once Murray was traded in mid-1996, Giles played in 51 games, posting an impressive .355/.434/.612. He showed enough to earn a full-time outfield job when Belle left in free agency the following year. Despite posting a great .269/.396/.460 line, the Indians traded him to the Pirates for usable reliever Ricardo Rincon, straight up.

A few years later, the A’s would trade someone named Marshall McDougall to the Indians for Rincon. The Indians did not do well in Rincon trades. (Photo: Moneyball)

The Indians’ loss was the Pirates’ gain. Giles went on to post five straight seasons with an on-base percentage of .400+ including a historic .298/.450/.622 in 2002.

The extent to which Brian was unappreciated despite such elite production is best elucidated by the fact that he only made two All-Star games in his entire career, despite eight consecutive seasons of 4+ WAR, and a shiny career line of .291/.400/.502.

Brian posted double-digit walk rates every year he played, and the only year he struck out more than he walked (his 14th season) was the year he called it quits. For perspective, only five players had more walks than strikeouts in 2017: Votto, Turner, Trout, Rendon, and Rizzo — an impressive list, for sure; none of those players accomplished that feat the previous year. Among his contemporaries, the only other players to post double-digit walk rates with fewer strikeouts than walks with a .500+ slugging percentage in consecutive seasons were: Bonds, Sheffield, Pujols, Chipper, Giambi, Helton, PalmeiroThomas. I thought about excluding first basemen from the list, but this helps make the point of just how great Brian was, and for a long period of time.

As mentioned above, younger brother Marcus did not enjoy the long career Brian did, but was extremely valuable in his own right. While Brian was unheralded as a youngster, Marcus was mostly disregarded; Marcus was drafted way down in the 53rd round in 1996. He cracked the big leagues for the first time in 2001 at age 22, and put up a terrific .262/.338/.430 in about half a season of work, and he posted similar numbers in 2002. Even if that were the whole story, that’s still a remarkable achievement for a 53rd round draft pick — but of course, there’s more. For his stretch from 2003–2005,Marcus was by far the best second baseman in the game. In fact, among all middle infielders, only the nearly immortal Alex Rodriguez rated higher than the diminutive Giles during that span (that includes guys like Tejada, Jeter,Rollins, and teammate Furcal).

From 2003–2005, Marcus Giles was basically a better defensive version of Derek Jeter (Source: Fangraphs)

This is not to say that Marcus had a better career than any of the aforementioned stars, as this dramatically understates the significance of longevity (these were actually Marcus’ only three noteworthy seasons). But as far as 53rd round picks go, a run of three elite years like this is pretty wild. This puts the Giles family rightfully in discussion of top 5 baseball families.

Across three full seasons, the Giles brothers were among the top players in all of baseball (Source: Fangraphs)

Of these five-honorable mention families (Gwynns, Uptons, Fielders, Cruzes, Gileses) who would you take? Vote here.

The ultimate question:

Who do you think is the best non-Bonds baseball family? Go here to take the poll.


Let’s Project Three 2018 Breakout Players

The best thing about Spring Training statistics for fantasy owners is that you can spin them whichever way is convenient for you, the owner. If you’re heavily invested in a certain player who is struggling in Spring Training, you can always say “It’s only spring, these numbers don’t count!” Or, on the other hand, you can use a hot spring to justify reaching for a player who you believe will breakout. So yes, largely spring statistics are meaningless. Except, Jeff Zimmerman wrote an article earlier this year highlighting batted ball data to spot potential breakouts. With limited Statcast data provided at many Arizona and Florida ballparks, the ground out/fly out ratio may be the best indicator for hitters to spot those breakouts. Luckily MLB.com provides the GO/AO ratio for all spring statistics, so we can put Jeff Zimmerman’s hard work to use now that 2018 Spring Training is in the books. Let’s look at three players that look poised to breakout in 2018. I’ll write a part-two portion including three or four players who had previously broken out (relatively speaking) in 2017 but are projected to regress some by the masses.

Let’s start with Brandon Nimmo, the young outfielder for the Mets. Nimmo had a hot spring and with Michael Conforto starting the season on the DL, Nimmo got the nod to leadoff and play centerfield for Opening Day. Conforto is progressing much quicker than expected and should be back before the end of the month. halting Nimmo’s playing time. Thanks to the Mets signing on Adrian Gonzalez, effectively blocking Jay Bruce from moving from right field to first base, Nimmo is left without a spot. I won’t speculate on injuries (too much) but Yoenis Cespedes rarely plays a full season and I don’t expect Adrian Gonzalez to be at first base all season.

Back to Nimmo, he hit .306 with three home runs and whooping nine extra-base hits in Spring Training. In addition to all those loud numbers, his GO/AO ratio sits at 0.87 for the spring. For context, his minor league ratio is 1.32 and so far in limited major league experience (250 at-bats) it’s 1.12. Based on Zimmerman’s conversion table, we are looking at a ground ball rate of between 42% and 43%. Throughout his minor league career his ground ball rates have ranged between 45% to 56%, let’s call it 50%. That difference in groundball rate could mean an improvement in fly ball rate to near 40%. Nimmo has never been considered a power hitter but he’s been graded with a 50 in raw power, so a change in approach may unlock 20+ home runs. His previous career high is 12 in 2016, mostly in AAA and one at the major league level. His plate discipline is already fantastic evidenced by his incredible minor league walk rates. If he were to unlock average to above average power, Nimmo could become a Matt Carpenter-type leadoff hitter for years to come.

Steven Duggar is a name I haven’t seen on many people’s radar this offseason. He performed well this spring and has impressed the coaching staff of the Giants. But alas, he was Optioned to AAA to receive everyday at-bats. The Giants believe he is the centerfielder of the future and given the health track record of players like Hunter Pence and the mediocrity of Gregor Blanco, I wouldn’t be surprised to see Dugger by June (if not sooner). Duggar is a good athlete with a good hit tool and above average speed. His raw power is only graded out as average but I’ve noticed an approach change that began in High-A last year where he, like many others began elevating the ball more. He missed some time last year but also saw a solid HR/FB% at about 13% along with the increase in fly balls. This is a good sign. So let’s compare some numbers for Duggar.

In his first two seasons of minor league ball, his GO/AO ratio was 1.52 with fly ball rates typically below 30%. In 2017, again he dealt with injuries and only played in 42 games, but improved on his GO/AO ratio and fly ball rate to the tune of 0.82 and 43% respectively. This spring he’s continued elevating the baseball with a GO/AO ratio of 0.92 along with 4 home runs and six extra-base hits. His patience at the plate is incredible, much like Brandon Nimmo and his outfield defense is good enough to play centerfield for the Giants right now. He’s been a doubles machine in the minors and it’s possible those doubles start turning into home runs. I don’t see the upside in terms of home runs compared to Nimmo but I think Duggar can steal more bases, so both can be solid fantasy contributors, especially in OBP formats.

Based on all the hype in Ozzie Albies direction this offseason, you would be under the impression that he already broke out. However, he was only up with the Braves for all of 57 games and 244 plate appearances. In that short amount of time, he performed admirably with a triple slash line of .286/.354/.456 with six home runs and eight steals at the ripe age of 20 years old. Impressive to say the least, but before 2017 he had hit a total of eight home runs in 293 games. So, should we just chalk up the 15 he hit between AAA and the majors in 2017 to luck or an outlier?

How about neither, you know better than that! Ozzie was a ground ball machine in the minors which is typical for a speedster with 70-grade speed and five foot nine inch, 160-pound frame. Prior to 2017, Albies’ minor league GO/AO ratio was 1.5. Last year between AAA and the majors, it was 0.9 which matches his approach this spring at 0.85. Albies has hit over .300 with three homers and six extra-base hits this spring. I realize that Albies only played in 57 games in 2017 but I set some parameters for comparison sake to Ozzie Albies’ short time in the Majors, because why not? It’s fun. Take a look. Not bad, right? I set the walk rate above 8%, the K rate below 17%, the flyball rate above 39%, and the Hard contact above 33%. The player I want to highlight of this group is fellow five foot nine inch Mookie Betts. Let’s compare Mookie’s 200+ PA cameo at age 21 to Albies’ 200+ PA cameo last year.

Season Name Age PA BB% K% FB% IFFB% HR/FB Hard%
2014 Mookie Betts 21 213 9.90 14.60 38.60 11.50 8.20 35.80
2017 Ozzie Albies 20 244 8.60 14.80 40.30 1.40 8.20 33.20

I should point out that Betts didn’t strike out as much as Albies did in the minors but still impressive, to say the least. New SunTrust Park plays much better in terms of power for left-handed batters and yes, Albies is a switch hitter, but should bat from the left side at least 65% of the time. Hitting from the left side should help his power production. The infatuation with Albies continues to grow. If he builds on his success from 2017, there’s nothing in his batted ball profile that would prevent him from hitting 20+ home runs as he reaches his peak. The kid’s a star! I envision multiple seasons of 20 home runs and 30 steals with a great average for Albies.