Author Archive

New Swing Brings New Struggles for Kyle Seager

Behind many high hopes for the 2018 Mariners was a quiet confidence in the continued performance of veteran players. Among those players was Kyle Seager. Although his offensive numbers dipped quite a bit in 2017, he was still viewed as a quality hitter going forward, but as we close in on the season’s halfway mark, Seager’s performance is still leaving something to be desired.

The power is still there. Twelve homers and 17 doubles put Seager on pace to finish around his typical extra-base production, but the strikeouts are way up, the walks are way down, and as a result, his OBP is a disastrous .270. Even though he has generally come through when the Mariners need him the most (.300/.333/.750 175 wRC+ in 33 PA in high leverage situations), Seager’s overall production has been a disappointment, as he’s slashing .222/.270/.408 (86 wRC+) on the year. Perhaps it all started last season when he curiously turned in his worst full-season performance (106 wRC+) immediately after a career-year at the plate in 2016 (132 wRC+), so let’s cozy up in our armchairs and play hitting coach for a few minutes.

First, we’ll get familiar with Kyle’s swing this year:

Note: There’s nothing wrong with your internet connection. The gifs are just in slooooowww moootiooonnnn.

swing2018 slow.gif

Pretty upright. Medium leg kick. A lot of pre-swing action and an obvious hitch before the hands load. There are a lot of moving parts here, but nothing jumps out as clearly flawed.

Back in 2014, things were much quieter though:

swing2014.gif

Here, Seager’s leg kick is more subdued with a quick toe tap and his hands are much quieter throughout.

In 2015, Seager adopted a more substantial stride, leaving the toe tap behind:

swing2015 slow

His hands start lower, but as they load, they come up to a position consistent with 2014. The camera angles make it difficult to tell, but there also appears to be greater separation between his hands and chest.

Moving onto 2016 (Seager’s career year), we start to see a more exaggerated pre-swing motion:

swing2016 slow.gif

But that extra motion is inconsequential because, once again, as his swing comes together, his hands return to a position consistent with the previous couple years. We also see the return of his toe tap.

Now 2017:

swing2017 slow.gif

His stance looks a little more open here with a slightly bigger stride, but Seager’s swing looks very much the same as it did in 2016. The bat waggle is there, the toe tap is there, but his hands seem to drop ever so slightly more and don’t return to their usual position.

Compare these two gifs from a different angle (from Baseball Swingpedia on YouTube):

side swing 2016.gif

side swing 2017

In 2016 (top), as his foot comes down, Seager keeps his left elbow up and his hands around chin high; however, in 2017 (bottom), his left elbow creeps down just a bit and his hands settle around shoulder high. For a clearer picture, check out these screenshots just as he plants his right foot:

Screen Shot 2018-06-20 at 1.15.27 PM


Screen Shot 2018-06-20 at 1.17.23 PM

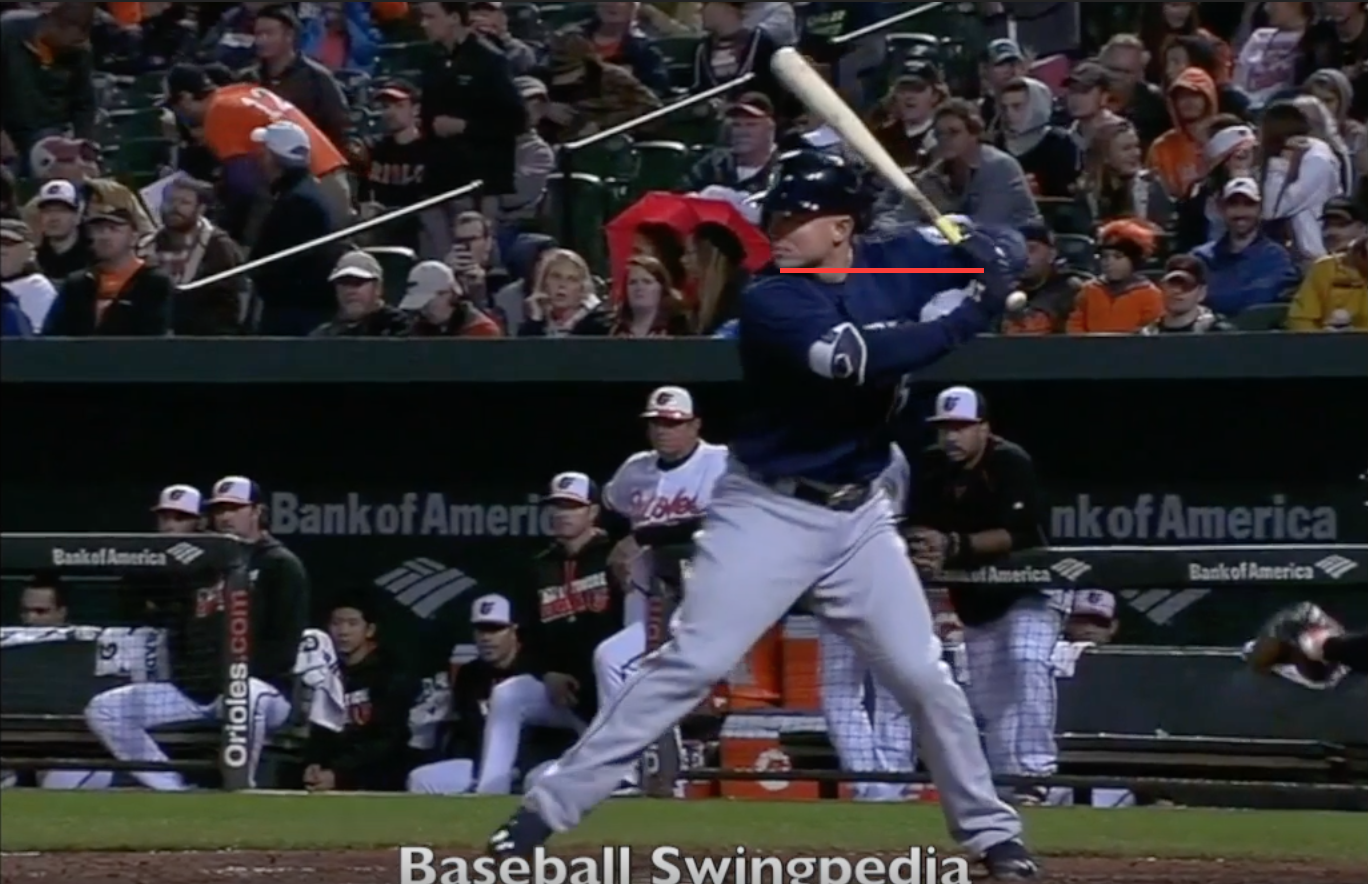
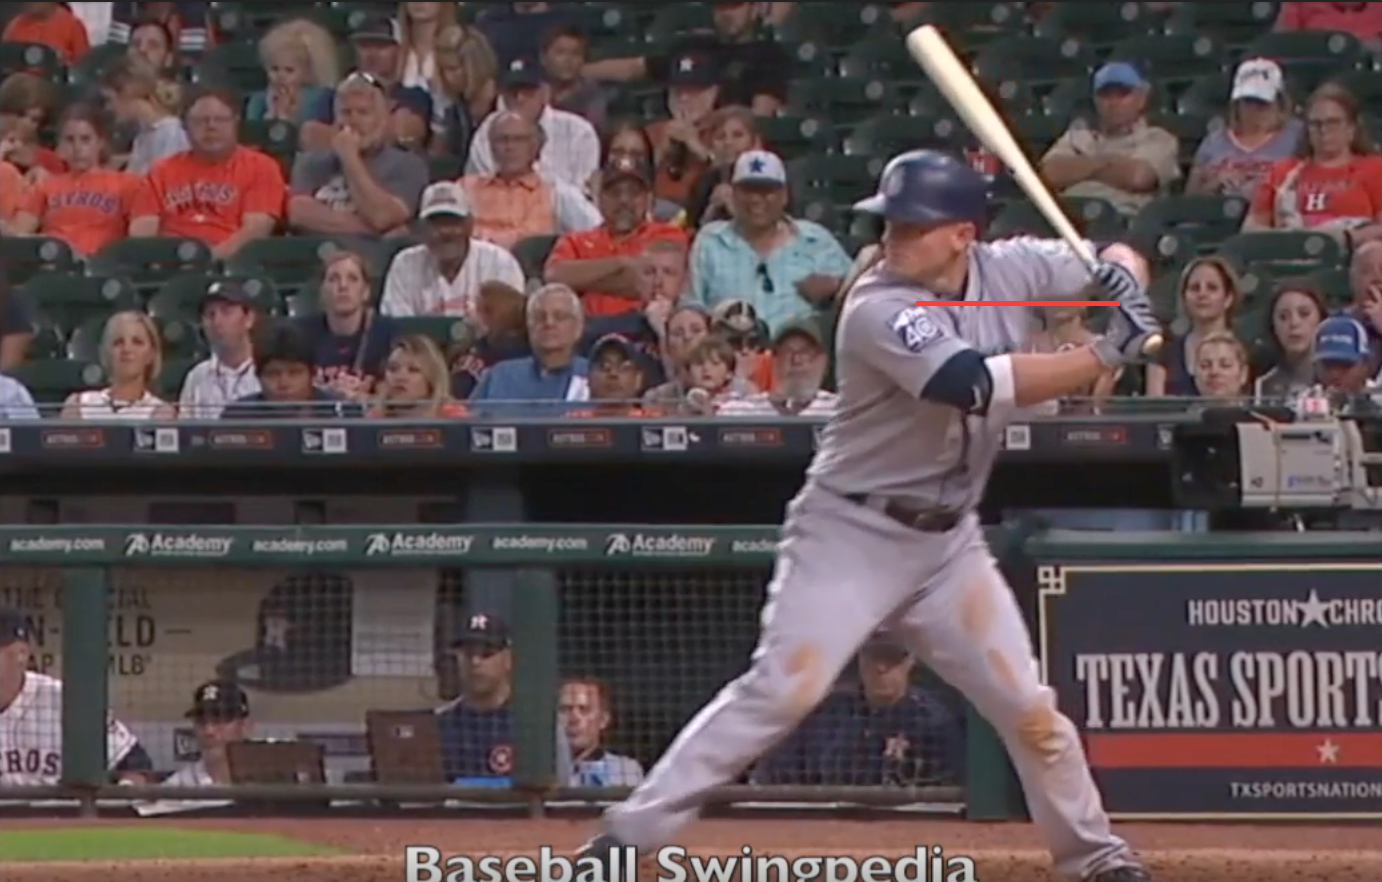
Hopefully, this lower position is more obvious in these screenshots because it’s subtle in real time. Now, hand position isn’t everything, but it is hugely important, and Seager’s hands might be a prominent factor in his recent offensive woes and might partially explain why 2017 was a year of great change for him.

That change may be best illustrated in the following table:

Year LD% GB% FB%
2011 27.7 30.4 41.9
2012 21.9 35.9 42.3
2013 20.8 34.3 45.0
2014 22.2 36.7 41.1
2015 24.0 35.2 40.8
2016 21.9 36.1 42.0
2017 17.1 31.3 51.6

Whether it was the lowering of his hands that created more fly balls or the desire to hit more fly balls that lowered his hands, Seager’s fly ball percentage skyrocketed in 2017 and his average launch angle on line drives and fly balls combined jumped from 26.4° and 26.7° in consecutive years to 29.5°.

In theory, this wasn’t a bad idea. Seager does most of his damage in the air, and the quality of the fly balls he hit in 2017 (.412 xwOBA) was similar to that of his fly balls in 2016 (.434 xwOBA). A higher volume of fly balls should have meant more damage, but his altered swing may have caused his line drive rate to plummet. And with much fewer of those high percentage hits, Seager may have lowered what was an impressive offensive floor.Screen Shot 2018-06-20 at 1.43.35 PM
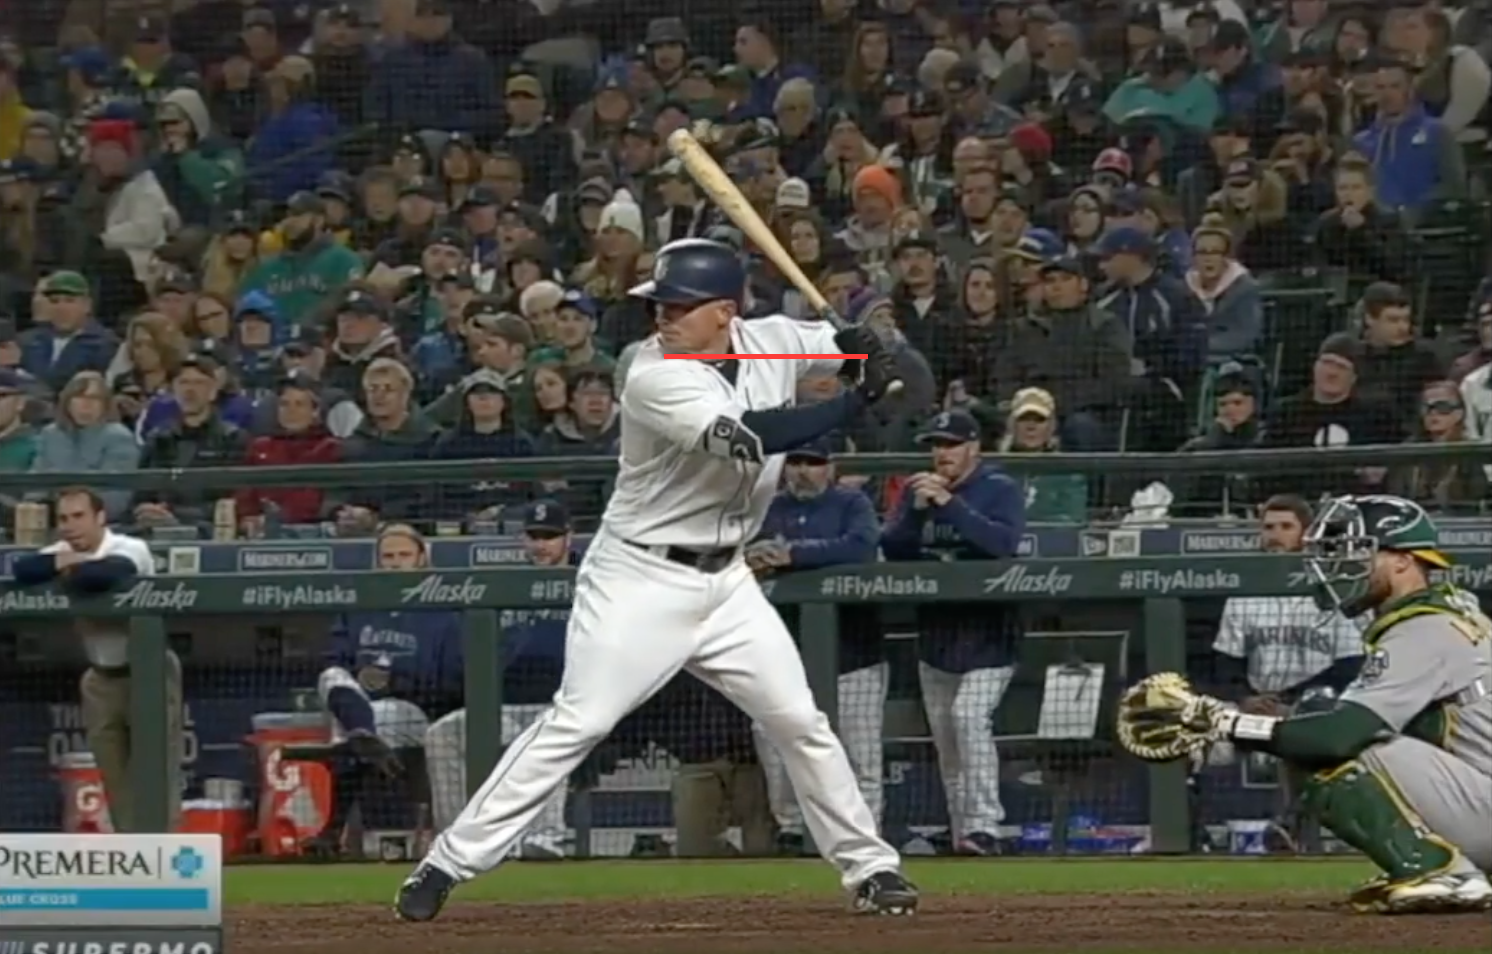
Seager’s hands appear much closer to their 2016 position. His average launch angle on line drives and fly balls combined is eerily similar to last year at 29.6° but his line drive launch angle has gone down while his fly ball launch angle has gone up, which appears to be a good thing based on his xwOBA on those batted balls. That’s not to say he’s 100% mechanically sound though (not that I would know exactly what that is but I digress). Currently, he’s on pace for a 44.7% FB% and a 19.2% LD% — the third highest and second lowest of his career, respectively — and that still-deflated LD% might be a “feel” or timing issue due in part to his hands’ tendency to drift as a pitch is coming in. Watch Seager’s hands closely in a couple examples from 2018:

Between the pitch being released and him getting his foot down, Seager’s hands are still drifting backward whereas, in previous years, he’s been surgically steady:

I promise these are the last two gifs.

2018:

split hands 2018

2015:

split hands2015

It’s a minute difference, but small disruptions in a hitter’s mechanics can have significant consequences. A diminished ability to square up line drives may be among those consequences and that problem has been magnified by the shift. Given that Seager is one of the more consistently shifted on batters in the league, his ability to hit line drives may be the crux of returning to normalcy at the plate.

Year PA with any shift on LD% GB% FB% wRC+
2013 47 19.6 34.8 45.7 75
2014 212 28.4 41.3 30.3 143
2015 280 27.5 39.9 32.6 86
2016 358 22.8 40.3 36.9 86
2017 374 18.8 32.4 48.8 56
2018 192 19.3 40.1 40.6 54

Generally, the higher Seager’s line drive percentage has been with the shift on, the better he has performed against it by wRC+. And although that doesn’t tell the whole story, it certainly makes a lot of sense. He’ll hit homers over the shift and he’ll poke some grounders through the shift, but if he can’t line balls past the shift a bit more, as we saw last year and are seeing this year, his offensive ceiling just won’t be the same.

Various little changes from one year to the next are what make the best players in the game the best players in the game, but in that quest to become the best, sometimes you can lose what once made you successful. Before you know it, square 1 isn’t where it was a few years ago. What is normal for Seager now is not what was normal when he was at his most successful, but considering that his power is still evident, he seems far from broken. For the majority of the season, his poor offensive performance has been buoyed by good teammates, yet the challenging past few games show that if the Mariners really hope to hang with the best of ’em, they need the Kyle Seager to show up on both sides of the ball.


All data from FanGraphs and Baseball Savant and referenced prior to games on 06/20/18. 


The Coors Field Hangover?

Recently, a brief exchange I had sparked some renewed interest in Coors Field. It’s the most offensively generous park in baseball by a good margin and because of that, people tend to cite context-neutral stats to assign less significance to phenomenal performances by Rockies’ players if they don’t outright Nerf their stat lines without a second thought.  But those context-neutral stats like wRC+ aren’t perfect. The most relevant imperfection to consider here is that the park adjustments are somewhat unrefined in their application.

For this thought experiment, I’ll consider Nolan Arenado as an example, and I’ll mainly be using wRC+ and fWAR to measure his value, so we need to first determine how FanGraphs applies their park factors (PF).

  1. They use a 5-year regressed value in their calculations, so if a stadium happens to play drastically different one year, that value won’t have as extreme an effect on stat calculations. Coors Field’s 5-year PF (116) is close to its 1-year PF (115), and Arenado plays relatively few games in other stadiums outside his division so we won’t consider this to be a real issue in evaluating him.
  2. When applied, park factors are divided in half to account for players only playing half of their games in their home park. In my calculations, I am splitting Arenado’s stats by the stadium he played in so I will not need to adjust park factors initially.
  3. Third, players are assumed to play their away games in a league average setting, meaning when calculating wRC+, etc. for Arenado in San Diego, for instance, Petco Park is considered a neutral park.

Surely, Petco and other parks don’t magically become neutral environments for visiting teams, so why not account for that? Let’s consider the case where Arenado does get more credit for playing outside of Coors Field.

I started by splitting Arenado’s offensive stats by stadium and finding wRC+ and fWAR, as they are typically calculated to make sure that if my numbers are ultimately off, it’s not because they started wrong.

Statistic FanGraphs My Calculation
fWAR 5.6 5.67
wRC+ 129 129.14
wRAA 42.6 42.82

There is some rounding error here, and given that I entered a good amount of data by hand, there is a chance I made some manual mistakes, but the results are close enough for me to feel like I can move forward.

Now, the fun part. Let’s change every PF to its “correct” mark, including an adjustment for Arenado only playing 78/81 possible games at home.

The Coors Field PF becomes 1.3081, and the weighted average of away PFs for Arenado is .9773. After applying these, we find somewhat of a lackluster result:

Statistic New Calculation
fWAR 5.81
wRC+ 130.33

There’s some improvement, but it’s about as “some” as “some” can get. Regardless, this is an adjustment that could (and arguably, should) be made for every player in the league, so it’s not really the difference maker I’m trying to uncover.

But wait. There’s more!

Isn’t there some kind of Coors hangover? I mean, Coors Field hangover? As in, don’t Rockies hitters tend to perform worse than expected on the road due having to adjust to pitches moving differently at a lower altitude? Maybe. Or probably depending on how you want to look at it.

Consider this slightly dated article by Jeff Sullivan. In this piece, Sullivan admits to reading some compelling reasoning in favor of the Coors Field hangover being real, but in compiling his own data, he found that the Rockies do not tend to improve their batting line as a team as their road trips continue. So if the hangover is real, it looks like it doesn’t ebb and flow. If anything, it is a persistent detriment — a “disease” as Sullivan says rather than a “hangover.”

Assuming the effect is real, we still can’t really project how much more productive batters would be if they were left unaffected by atmospheric changes, especially because the magnitude of this effect likely varies greatly from player to player. What we can do though is adjust the park factors of the stadiums Arenado visits so that whatever results he actually produced there are worth more when we calculate his advanced stats.

Because I can’t definitively say how much we should adjust each park factor, I’ll simply change the weighted average we calculated earlier in small increments. For Arenado (and Rockies in general), let’s make our away PFs 1 to roughly 8 percentage points lower (more favorable when adjusting values) so that the most generous case is equivalent to assuming Arenado plays all of his away games in Citi Field or Petco Park with no hangover effect (both have 95 PF/10% worse than league average).

Change in PF (in percentage points) New Away PF New wRC+ New fWAR
-1 .9673 130.81 5.85
-2 .9573 131.28 5.90
-3 .9473 131.75 5.94
-4 .9373 132.23 5.98
-5 .9273 132.70 6.02
-6 .9173 133.18 6.07
-7 .9073 133.65 6.11
~ -7.73 .9000 134.00 6.14

Here, we’re seeing what may be an upper limit to what essentially is a Coors Field hangover adjustment.

It is possible that the proposed hangover effect is even more detrimental to Rockies hitters on the road than this though. Over the last three years, in NL West parks, the Rockies here is how the Rockies have performed compared to the rest of the league according to xwOBA:

Venue Rockies xwOBA League xwOBA % Difference Rockies xwOBA Ranking
AT&T Park  .294  .310  -5.16%  20/25
Chase Field  .324  .323  0.31%  13/25
Dodger Stadium .267 .299 -10.70% 17/25
Petco Park .277 .296  -6.42% 13/25
Coors Field .320 .318  0.63% 11/25

Among the parks they’ve played in the most, the Rockies have had the most trouble in Dodger Stadium. Of course, these xwOBA measures do not account for the quality of competition so your Kershaws and Jansens might be putting a damper on things here, but given that Dodger Stadium is about 267 ft. above sea level, visiting LA gives us a good mix of changing atmosphere, typically competitive pitching, and about the largest sample size possible. So if we’re of the mind to translate that roughly 11% decrease in expected production to an 11% more favorable run environment (by PF), that seems like it would function well as an upper bound on a season-long, league-wide statistical “advantage” of the Coors Field hangover adjustment.

If we adjust our previously adjusted away PFs for Arenado one last time to a value 11% more favorable (roughly 87 PF), we land on 6.27 fWAR with a 135.42 wRC+. Arenado isn’t suddenly giving Mike Trout a run for his money, but he looks up to a half-win better when we give him credit for the fields he actually plays on and when we attempt to make a correction for the alleged Coors Field hangover.

Based on this data it would appear that the hangover only works one way — that is, Rockies players do not seem to suffer upon moving back to Coors Field — but given their substandard lineups since 2015, some of the Rockies’ roughly average xwOBAs, particularly at home, surely warrant some consideration. Still, we could be robbing select Rockies players of up to a half-win per season (per FanGraphs) and a handful of points on their wRC+ simply by assuming that changing altitudes doesn’t create additional difficulties while batting. I don’t advocate a total shift in perspective, particularly because I didn’t seek to change my opinion on the existence of the hangover while writing this, but at the very least, we should approach the evaluation of Rockies hitters with a little more thoughtfulness.


The Selective, High-Ball Hitting Eddie Rosario Is Legit

The tools hadn’t quite come together for Eddie Rosario until last year. Through his first two seasons, he had a penchant to swing often and at anything. While his power still made appearances, his overall line was diminished by his lack of selectivity at the plate, which resulted in far too many Ks compared to his bottom-of-the-barrel walk rate. In 2017, hitting coach James Rowson made note of Rosario’s focus on becoming an “all-around hitter,” and evidently, that had him heading in the right direction.

Part of becoming that kind of all-around hitter had to be closing the gap between his BB% and K%. After posting very poor BB% of 3.2% and 3.4% in his first couple seasons, Rosario made the jump to 5.9% last year and coupled that with a hefty decrease in Ks as well — from around 25% to 18.0%. And this was hardly a fluke. Rosario has swung less and less over his three seasons in the majors, and that decrease in Swing% has been due almost entirely to a decrease in O-Swing%.

Year O-Swing% Z-Swing% Swing% F-Strike% SwStr%
2015 45.6% 76.4% 58.9% 65.6% 14.5%
2016 41.7% 76.9% 56.9% 63.6% 15.3%
2017 37.6% 76.1% 54.9% 59.4% 11.9%

He’s seen fewer first-pitch strikes whether by chance, by choice, or by pitchers respecting his talent a bit more, but regardless, what is most notable is his precipitous drop in O-Swing% and SwStr% with a steady Z-Swing%. Together, these stats suggest that Rosario made a distinct effort to recognize and lay off pitches he can’t do much with. While he has somewhat of a reputation for being a bad-ball hitter, Rosario seemed more committed to finding “his pitch” to swing at in 2017. Career highs in nearly every offensive category you can think of seem to set Rosario up for another fine year, but the sustainability of this progress relies on him leaving his old tendencies in the past.

With his new approach, Rosario was able to put his sneaky raw power on display. Per Baseball Savant, his xwOBA on all types of batted balls were more or less in line with his career norms. Only his flyball wOBA (.560) outpaced its xwOBA (.411) by a good margin. It’s fair to assume this means there is some regression baked in here, but in reviewing more than a handful of highlights, I noticed something particularly interesting.

In 2017, Rosario seemed to handle pitches up in the zone far better than he ever had previously. Clip after clip showed Rosario slamming up-and-away pitches to left field and handling pretty much anything else elevated. Referencing the gameday zones shown below, we can see just how well Rosario has hit elevated pitches over the years.

gameday zones

Given that we’re interested in how sustainable Rosario’s uptick in power is, let’s take a look at his flyball xwOBA in zones 1, 2, 3, 11, and 12.

Year Zone 1 FB xwOBA Zone 2 FB xwOBA Zone 3 FB xwOBA Zone 11 FB xwOBA Zone 12 FB xwOBA
2015 .098 .416 .380 .115 .208
2016 .253 .581 .015 .019 .201
2017 .587 .391 .306 .368 .559

Combining these zones, we can see the overall increase in xwOBA, and for good measure, I’ll lump his line drives from those zones in as well.

Year High-Ball FB xwOBA High-Ball FB Avg. Exit Velocity (mph) High-Ball FB/LD xwOBA High-Ball FB/LD Avg. Exit Velocity (mph)
2015 .278 88.9 .477 90.2
2016 .271 92.1 .472 92.4
2017 .463 92.3 .555 93.9

Whether the scope of this analysis is too narrow is up to the reader, but at the very least, the preceding data confirms my suspicions. The jump in xwOBA is a translation of exit velocity increases and more optimal launch angles, indicating that Rosario put much better swings on elevated pitches last year, and he was rightfully rewarded with by far the best power numbers of his career.

Checking out some Swing% heatmaps, we could infer why he had so much success on high-balls last year. The following heat maps are in order from 2015 to 2017.

2015 Swing% Heatmap
2015 Swing% Heatmap
2016 Swing% Heatmap
2016 Swing% Heatmap
2017 Swing% Heatmap
2017 Swing% Heatmap

Obviously, Rosario was quite the free swinger in 2015, but he quickly shied away from the outside part of the plate the following year. Perhaps focusing on the inside edge more wasn’t quite the remedy he was after, yet it seemed to represent a step in the right direction. He was more patient on outside pitches, and that trend expanded into greater selectivity more so than passivity in 2017 where he opened up those middle-away zones a little and became even more reluctant to offer at up-and-outside pitches.

Clearly, something was up with the way Rosario approached his at-bats. And with this newfound approach, he made more contact on both outside and elevated pitches.

2015 Contact% Heatmap
2016 Contact% Heatmap
2016 Contact% heatmap
2017 Contact% Heatmap

Following the logic that if he can find “his pitch,” he can make more frequent, quality contact, it seems that better judgment around the edges of the zone over the past two years has started to transform Rosario’s approach from purely aggressive to selective aggressive. We know he has the power to muscle the ball around a bit, and we know his bat-to-ball skill is great too; his success is largely just a matter of swinging at the right pitches instead of swinging at everything. Rosario wanted to be more of all-around hitter, and that’s exactly what he did.

A slow start to spring training (only 7 games and 20 PA so far) might have him showing some rust early on this season, but if he can maintain his approach, Rosario can sustain his above-average offensive performance in 2018. Actually, he must maintain this approach to remain productive. With large steps forward in BB%, K%, and HR/FB% namely, he demonstrated a clear departure from his earlier days, but if he regresses in those areas, he could dip below 100 wRC+ again.

In fact, if we take his 2017 BB% from 5.9% down to 4.5%, his K% from 18.0% up to 21.2% (league average), and his HR/FB from 16.4% down to 13.8% (league average), we get the following 2017 output for Rosario:

Year AVG OBP SLG HR R RBI SB wRC+ fWAR
2017 .274 .303 .464 22 71 70 8 97 1.2

Veritable skills don’t evaporate overnight, and you don’t massively improve your plate discipline stats by accident so I wouldn’t expect to see such a steep decline in production from Rosario in 2018, but it’s important to note that those modified rate stats would still represent career-bests for him. This “What If?” stat line simply highlights how important maintaining his 2017 approach will be for him this year. There is plenty potential for Rosario to post another .800+ OPS season as a selective, high-ball hitter, but his track record suggests the bottom could fall out if pitchers can effectively force him out of this new comfort zone.


Juan Nicasio Has a New Slider, and He Needs His Old One Back

The Mariners recently inked Juan Nicasio to a 2-year/$17-million deal in their first significant addition to their pitching staff this offseason. After years as a middling starter, Nicasio emerged as a rock-solid relief option with the Rockies in 2014 before the Dodgers fully bought into his potential as a reliever the following year. The Pirates then acquired him and shifted him into the rotation a bit in 2016; however, he had more success in their bullpen and moved there full-time in 2017. He was again on the move last year, though — this time playing for two new teams — but he never started a game, posting a cumulative 2.61 ERA over 72.1 IP in 76 appearances.

He’s on the wrong side of 30, and breakout relievers tend to pop up and decline quickly, but it can be argued that Nicasio has done nothing but improve since moving into the bullpen.

Juan Nicasio as RP IP ERA AVG OBP SLG wOBA
2014 20.2 3.48 .227 .275 .400 .300
2015 56.1 3.83 .257 .359 .381 .320
2016 55.2 3.88 .249 .328 .387 .308
2017 72.1 2.61 .216 .277 .333 .265

As a reliever, Nicasio is largely a two-pitch pitcher, primarily throwing a four-seam fastball and a slider. He had occasionally mixed in a sinker and changeup in previous years, but 2017 saw Nicasio throw a four-seam fastball or slider 98.31% of the time. This pitch mix in combination with his K/9 dipping from slightly over 10 to just under 9 may raise a couple eyebrows, but Nicasio also improved his command considerably.

His 6.9% BB% in 2017 was his lowest since his debut season and marked a second straight year of improvement, and his 24.7% K% compares well to previous years. This would suggest that Nicasio is only getting more efficient with his outs, not striking guys out at a lesser rate. And sure enough, his 1.08 WHIP last year was by far the lowest it’s ever been.

A quick look at his splits from 2017 showed a distinct improvement against left-handed batters compared to previous years.

Juan Nicasio vs. LHH IP AVG OBP SLG wOBA
2015 14.1 .359 .494 .516 .427
2016 21.0 .241 .351 .476 .350
2017 33.0 .205 .252 .292 .235

In his largest sample yet, Nicasio made huge strides.

Since improvements against opposite-handed batters tend to suggest an improvement in a pitcher’s changeup or breaking ball, and given that Nicasio essentially throws just two pitches, his slider seemed like a good starting point. I found that (per Brooks Baseball) it had an entirely different shape in 2017.

Juan Nicasio Sliders Velocity HMov VMov
2015 86.92 1.94 1.86
2016 87.11 1.49 2.80
2017 88.92 0.47 4.04

While Nicasio’s slider was laterally less impressive in 2017, it made up for that with reduced drop.

Here is his slider in 2016 with a little frisbee action.

Slider 2016.gif

And here it is in 2017 a bit more tightly wound.

Slider 2017.gif

Nicasio’s slider was devastating to right-handers in 2015 and 2016 (cumulative .218 wOBA/.221 xwOBA), but it seemingly fell into the swing path of lefties, as they smashed it for a .369 wOBA/.272 xwOBA in the same period. In 2017, lefties floundered against it for the first time, posting just a .194 wOBA/.175 xwOBA. But his other slider disappeared.

Using this somewhat cutter-like breaking ball against RHB in 2017 yielded a .302 wOBA and .320 xwOBA. Considering the fastball didn’t play up (.298 wOBA/.334 xwOBA), that kind of performance is a slight concern, but righties’ triple slash against him was still an encouraging .225/.296/.367 (.287 wOBA).

On the surface, the Mariners seem to have gotten a quality reliever at about market rate for his talent, but I think there is still some upside here. Certainly, in this new slider, Nicasio has found a legitimate weapon against LHB, but the Mariners must hope his natural slider is not lost. In order to remain a high-quality, high-leverage setup man — the kind that posts sub-3 ERAs — he’s going to have to bring out both.