Optimizing Launch Angles Using Simulation and K-Nearest Neighbors
Although posted by Jack Marino this was a truly collaborative effort by Grant Carr, Justin Clark, Jake Fisher, Jack Marino, and Noah Nash.
The introduction of Statcast technology in 2015 has allowed analytics departments around the MLB to quantify aspects of the game that until the last few years were impossible to measure. One of the previously unanswerable questions that Statcast has allowed us to examine is the optimal launch angle for each hitter in the MLB. If the free agent market this winter has told us anything, it is that teams are now becoming more sabermetrically savvy with their checkbooks and are understanding the value a player adds to their roster in a far more analytical sense. For example, Mike Moustakas may have hit 38 bombs last year, but the fact of the matter is that he is a two WAR player with a below average glove and minimal range. Moustakas’s late signing for just $5.5 million plus incentives after declining a $17.4 million qualifying offer indicates that the market seems to have a much better understanding of his value than it has in years past. Since optimizing launch angle is defined as adding the greatest possible value per at bat, finding the right launch angle is undoubtedly a smart decision for a player trying to put himself in the best possible position to break the bank during free agency.
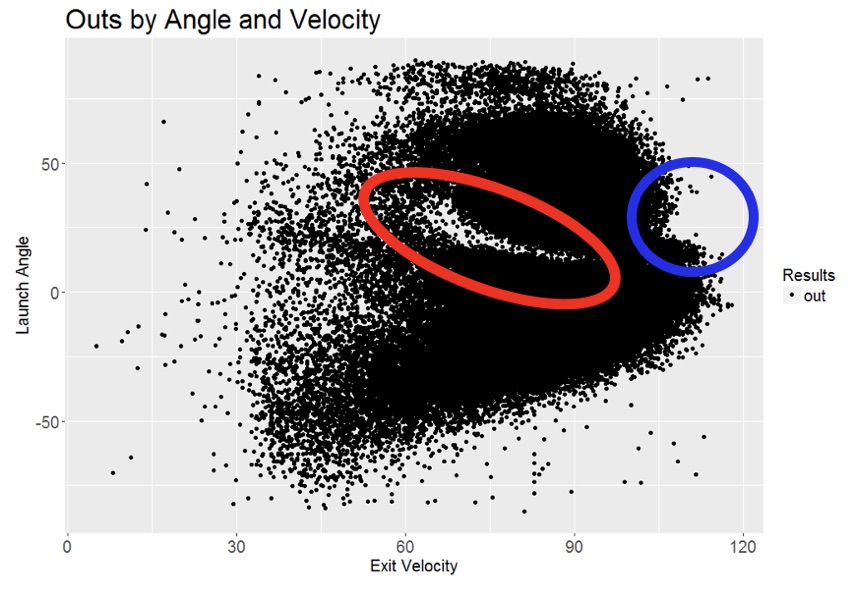
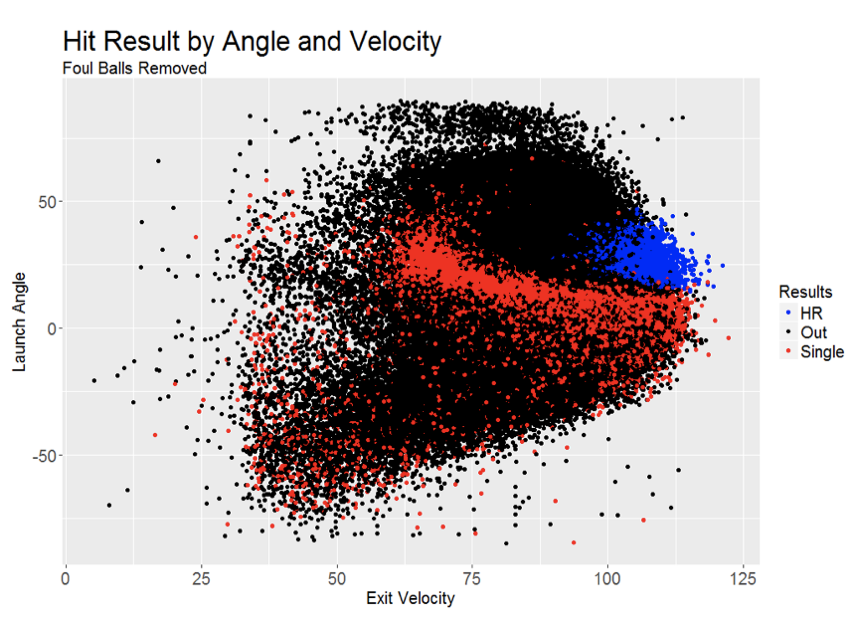
What makes this optimization problem so difficult is that simply knowing a launch angle on a certain ball in play very rarely tells us anything definitive about the outcome of that ball. The reason for this is that batted ball outcomes are extremely dependent on other variables such as exit velocity and the positioning of the opposing team’s defense. For example, a 25° launch angle hit above 100 mph is in most cases a home run; however, a ball hit at that same angle at 80 mph is almost surely a flyout. To gain a complete understanding of this relationship, we think the following visuals can be extremely helpful, but this relationship can also often make a lot of intuitive sense.
Never shying away from a challenge, we decided to dive into this problem and see what sort of algorithm we could develop to take a hitter’s batted ball data in 2017 and calculate an optimal launch angle for that hitter in 2018. The data we used for this project are from baseballsavant.com.
Since calculating an optimal launch angle will most likely result in an adjustment of a player’s swing, it is important to understand the possible repercussions of that change. For example, to increase launch angle, one definitely will need to adjust swing path to a more uppercut swing, which could in theory lead to a higher strikeout rate. For this reason, before recommending any changes, we wanted to make sure we understood the relationship between launch angle and strikeout rate. Using players with over 100 at bats during the 2017 season, we constructed the following plot and built a linear regression model trying to predict strikeout rate from launch angle. What we found was an R-squared value of approximately .05, meaning that only 5% of the variability in strikeout rate was accounted for by launch angle.
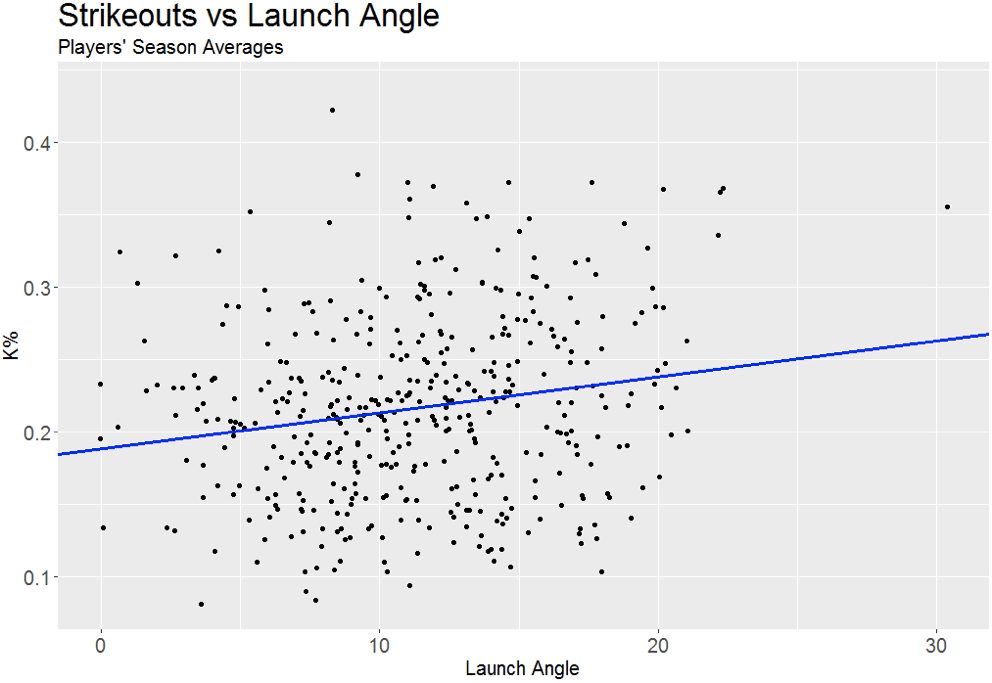
Following this conclusion, it seemed fair to move on and continue our analysis under the assumption that any tweaks we make to a player’s swing will not cause a drastic change in strikeout rate or quantity of balls put in play.
We think at this point, major strides have already been made in understanding launch angle, especially the possibly unexpected result of our linear model above. However, the problem still has not been solved and our methodology for solving it has not yet been revealed!
The method we came up with was to use simulation to increase the sample size of exit velocities based off the distribution of our hitter’s and calculated comparable players’ batted ball data, take these simulated exit velocities and fix a launch angle to them, use k-nearest neighbors on our hitter and comparable players’ to get a likely outcome for that batted ball type, then see what launch angle maximizes a hitter’s expected weighted On Base Average (wOBA) given the simulated distribution of exit velocities and k-nearest neighbor outcomes.
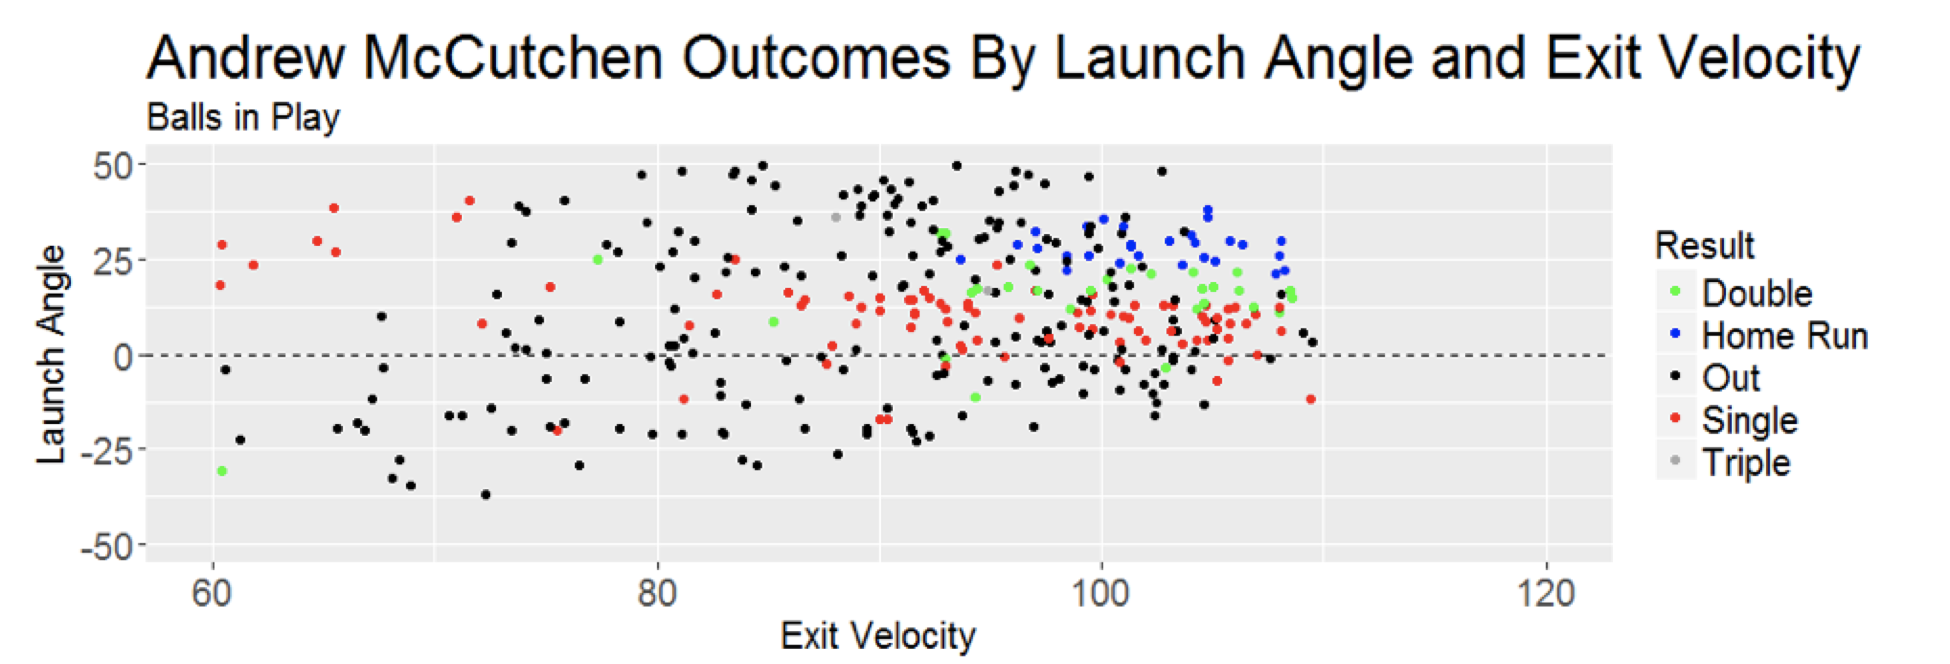
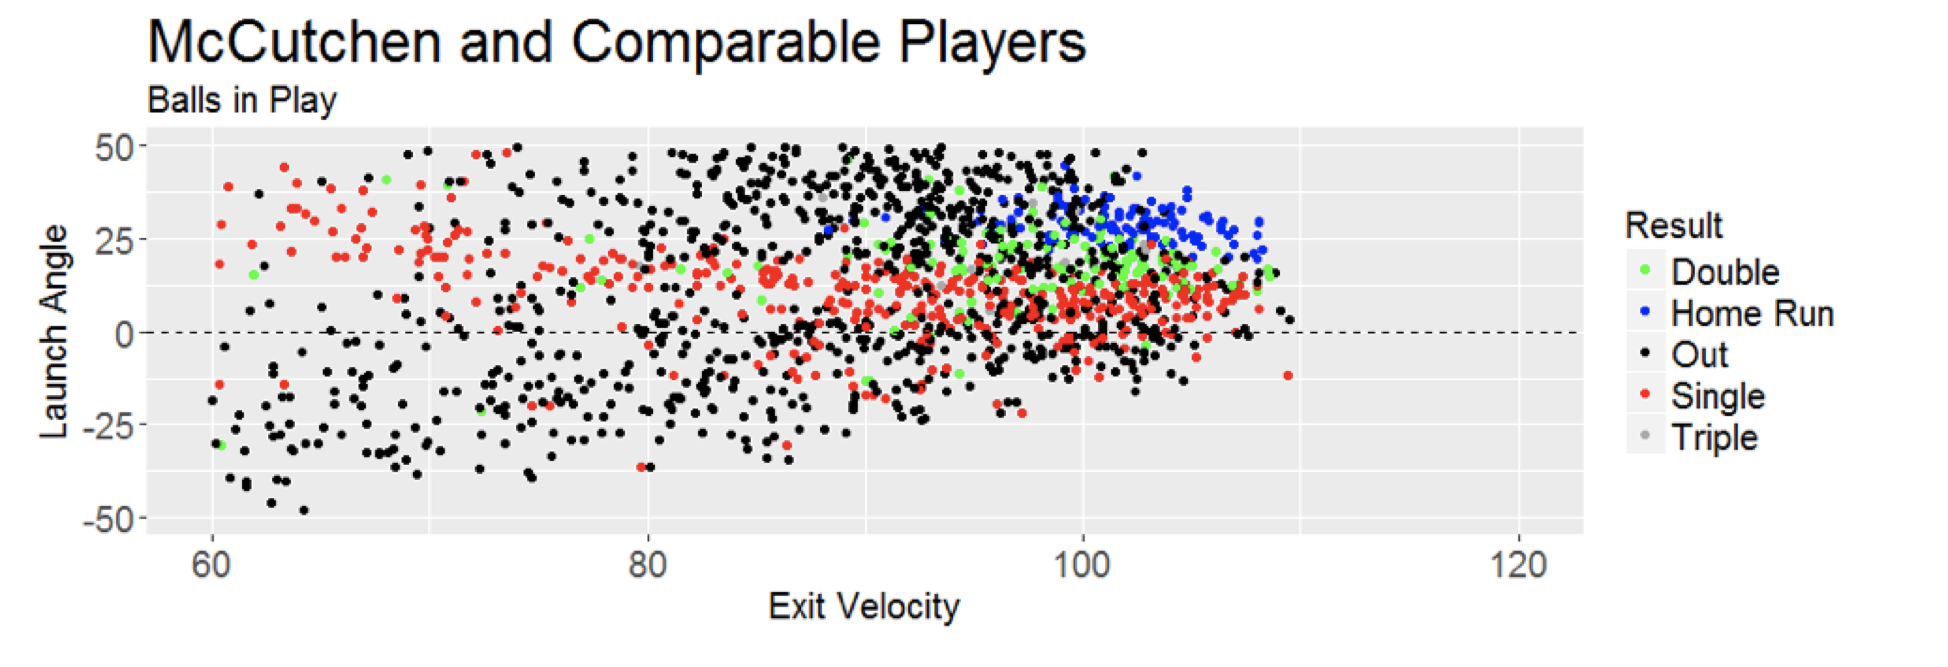
That may be a lot to throw at a reader all at once, so let’s examine a case analysis of this study using San Francisco Giants outfielder Andrew McCutchen. McCutchen’s 2017 season saw him have an average exit velocity of 88.4 mph and an average launch angle of 14.2°. Optimal launch angle is extremely player specific, so the first thing we have to do is gain a complete understanding of McCutchen’s batted ball profile. The chart below does an excellent job of helping us to do exactly this. For example, it appears McCutchen never surpassed a launch speed of 110 mph off the bat in 2017, had a pocket of homeruns between 23-30° and 95-110 mph, had a band of doubles at similar exit velocities but lower launch angles, and a group of singles at low launch angles and an even larger distribution of exit velocities than before. Now this is a great plot for understanding comparable players, but the fact of the matter is that there are entirely too many players to compare on a plot by plot basis.
To combat this problem, we first narrowed down the field to players who took over 100 at-bats during the 2017 season and then used the technique of Principal Component Analysis to narrow down the field of comparable players even further. For the variables in our PCA, we chose many different metrics using the Baseball Reference play index including home runs, triples, doubles, and singles per at bat, fly ball rate, ground ball rate, WPA, RC, and oWAR amongst others. After completing the analysis, we chose our first four principal components, which accounted for 76% of the variability in the original variables. We squared and summed the differences of each player’s first four principal component scores and created a list of the top 20 players whose four squared distances were the smallest. From here, we removed players who did not bat righty to try to account for the lefty/righty splits a righty batter like McCutchen may have. Then we went plot by plot trying to match the pattern of hits and exit velocities to McCutchen’s plot above. After this qualitative piece of our analysis was complete, we came up with Adrian Beltre, Alex Bregman, Brian Dozier, and Eugenio Suarez as our four comparable players. Their distribution of hits graphed with McCutchen’s can be found below and are remarkably similar.
When we considered how to create this optimal launch angle, we knew we wanted to somehow incorporate different areas of the strike zone, as the optimal launch angle on a ball up and in is likely not the same as on a ball down and away. To combat this potential problem, we divided the strike zone into 9 sections and created the following heat maps for both McCutchen and McCutchen and his comparable players. To understand these heat maps, it is important to note that the first number in each zone is the average launch angle on balls in play for that player or groups of players during the 2017 season in that zone, while the second number is the average exit velocity on balls in that zone.
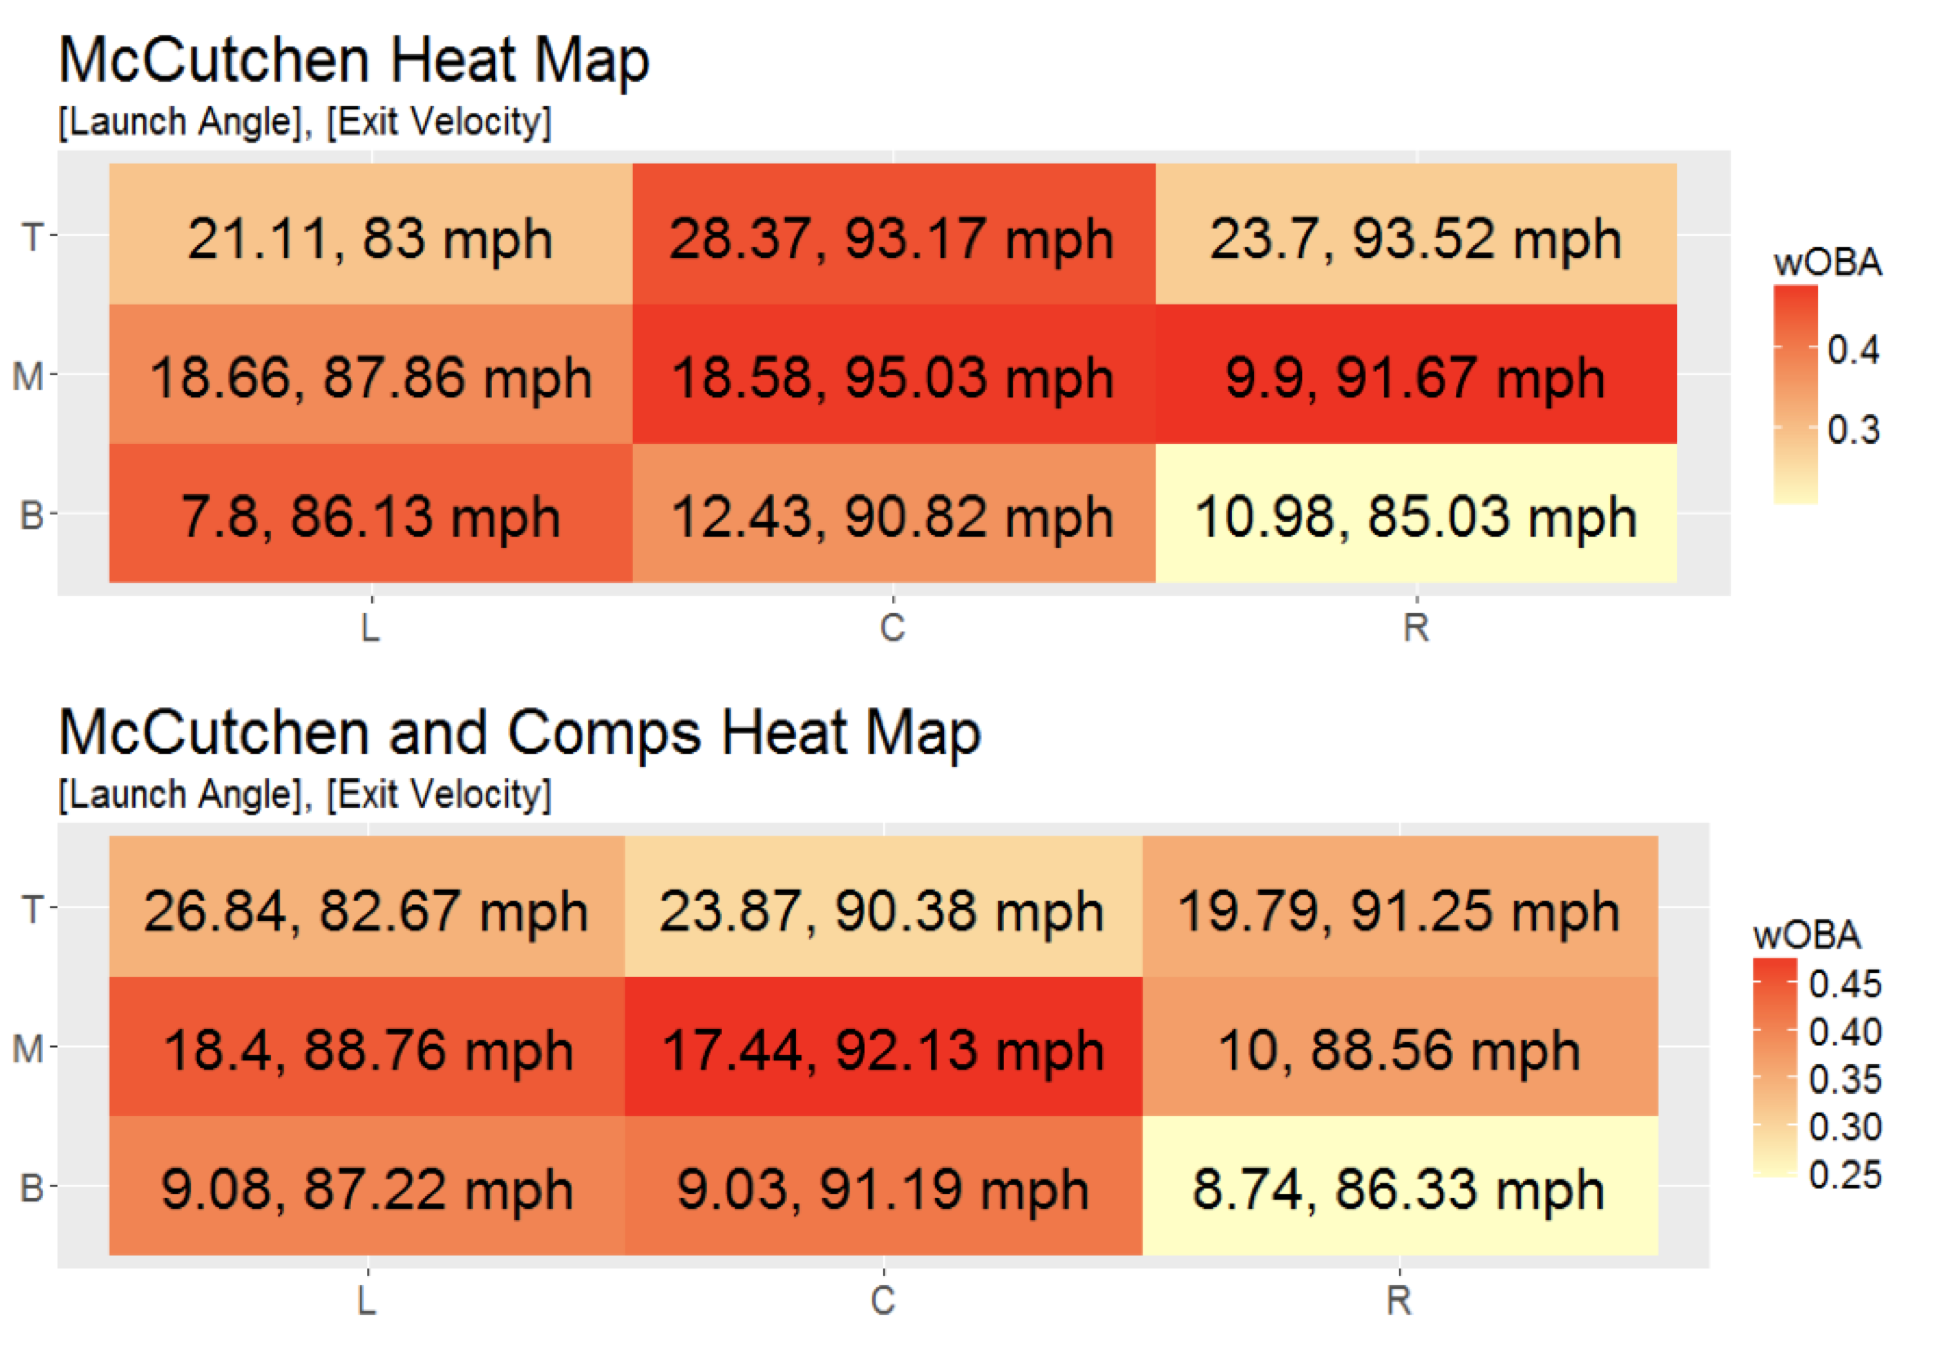
Looking at McCutchen’s heat map, we saw clear variation in exit velocity, launch angle, and offensive outcome (in this case wOBA) by zone, which confirmed our belief that we would have to take zone-specific differences into account. We decided to find the optimal angle for each of our nine zones, planning eventually to combine those angles into a single, optimal number unique to McCutchen. Looking at zone-specific data for McCutchen and his comparable players, we ran into the same challenge that motivated finding those comps in the first place: lack of data. There was simply not enough data on launch angle, exit velocity, and wOBA between McCutchen and his comps to perform the kind of verifiable analysis that comes with a larger sample size.
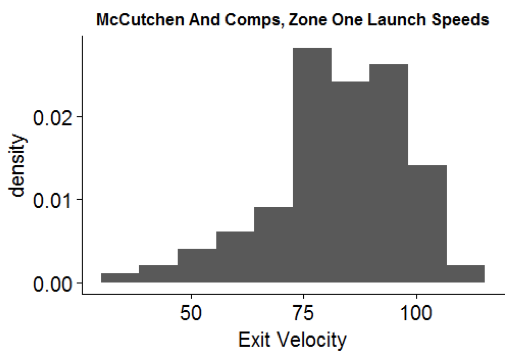
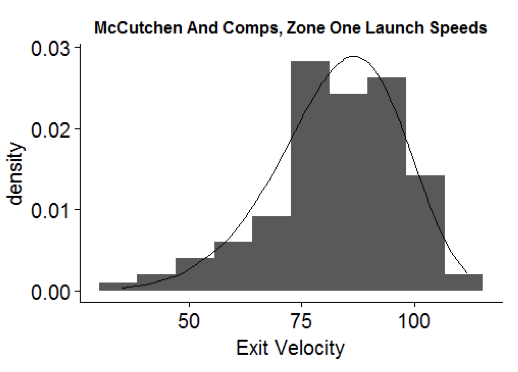
To overcome this challenge, we turned to simulation. Specifically, we searched for a distribution that would allow us to generate reasonable launch velocities for a given zone. With this distribution, we could test possible combinations of launch angle and exit velocity to explore which zone-specific angles might be optimal. Looking at a histogram of launch velocities for McCutchen and his comps, we observed a pronounced left skew across all nine zones. With this trend in mind, the Weibull distribution made sense for its flexibility in modeling real-life processes that feature multiple varieties of skew. Implementing maximum likelihood estimation on the zone-by-zone data used to generate the heat maps gave us the parameters for nine Weibull distributions that closely characterized the trends in exit velocity we observed for each zone. For example, the fit of our Weibull distribution in zone 1 shows the clear left skew, but also the excellent job of the flexible Weibull to fit the data.
In all, this process allowed us to generate any number of exit velocities for each zone that might reasonably approximate the kind of speeds we see on actual batted balls, leaving us with finding a range of launch angles that could be optimal for a given zone. While looking at the distribution of launch angles for McCutchen and his comparable players, we decided to consider only the launch angles between the 25th and 75th percentile for each zone. This gave us a number of discrete angles to test in conjunction with each zone’s launch velocity distribution for optimal offensive performance.
For each possible angle within a given zone, we generated 1000 exit velocities from that zone’s respective Weibull launch velocity distribution. Next, we used k-nearest neighbors to assign a wOBA value to every launch angle, exit velocity pair by examining similar pairs of launch angles and exit velocity and their associated wOBA within the McCutchen and comps dataset. This procedure gave us 1000 wOBA values for every launch angle that might be observed in a particular zone. By taking the mean of those wOBA values for each possible launch angle, we gained a more complete sense of what kind of offensive performance might be associated—on average—with the various launch angles for each zone. To identify which angle in each zone was optimal, we simply chose the launch angle with the highest associated wOBA.
Now that we had our nine optimal launch angles in each of the nine zones, we wanted to come up with a way to get to one optimal launch angle. When coming up with this angle, we knew it would be important to incorporate how often a player faces pitches in each zone as well as some measure of his talent level in each zone. To incorporate these two factors into our analysis, we started in zone one and took the product of the proportion of pitches McCutchen saw in zone one and his contact percentage in zone one, then repeated this process for the other eight zones and took the proportion of each of these products to create linear weights. Once we had our linear weights, we simply multiplied each zone’s weight with our previously calculated optimal launch angle in that zone and took the sum of these products. A visualization of this process can be seen below:

To finalize our findings, while Andrew McCutchen finished his 2017 regular season with an average launch angle of 14.2°, our advice based off our model is that he lower his average launch angle to 13.0°.
Well, there’s our methodology, not saying it’s perfect, but we’re certainly happy with our results.
About the Authors:
Grant Carr is a mathematics and economics double major at Kenyon College.
Justin Clark is a mathematics major at Kenyon College.
Jake Fisher is a history major at Kenyon College.
Jack Marino is a mathematics and economics double major at Kenyon College.
Noah Nash is an english major and art history minor at Kenyon College.
The group can be contacted at marinojc@kenyon.edu with any further questions.
.
Wow great piece. I think a problem is that average LA and optimum LA is not the same. Optimum LA of course is like 26-27 But only if EV is 95+. (Under 95 it is like an out 90% of the time).
Also value is not distributed evenly around. Value of batted balls pretty much continuously rises until like about 30 degrees but after 35 it doesn’t fall at the same slope but almost drops immediately to almost zero.
When looking at fly balls that is important. There is some accounting for this when you look at pop ups (like pod’s true fly ball thing where he deducts pop ups from fly balls) but the non popped up (say 40-60 degrees) high outfield fly balls are also very unproductive and a big part why big time fly ball hitters tend to have low Babips.
In that sense the old “HRs are a mistake” is actually correct, albeit not in a sense that a zero degree shoelace liner is ideal but a high liner at like 15 degrees or so. That is because while production around the ideal LA of 27 is not distributed normally, batted ball distribution is. That means a guy averaging 27 will have the same number of balls above and below 27.
What you want though is having a good number of balls at 20-30 but in the same time you want to have as many balls between like 5-35 degrees as possible. That means you have to give up some balls in the ideal 20-30 range to make sure you avoid having too many at 35+.
It also depends on your batted ball profile. A weaker hitter should probably try to get more to the 5-20 range, while a great power hitter might want to sacrifice some babip and thus obp for more power. But you definitely need to do something else than homers.
Even a guy hitting 50 HR in 550 AB would hit below .100 if those were all his hits. So even for the great power guy the average LA must still be well under 27.
WOW!
Incredible work by Dr. Jacob Fisher!
Very nice work!
I would just point out one finding in regard to the relationship between K an LA. It is true that short-term, there is little correlation; however, if you both increase the number of at bats and consider muti-year data which reduces the amount of noise, there is definitely a positive relationship.
I don’t think it makes sense to even test the relationship between launch angle and K%, while I’m not sure I buy the premise at all, if you want to test this, you need a variable that is more directly linked to bat path. Launch angle has nothing to do with whether a batter chases unhittable pitches or watches pitches in the strike zone (particularly with 2 strikes). These have a huge impact on K%, what you want to test is the relationship between launch angle and whiff rate, or maybe launch angle and in-zone whiff rate to get away from batters who swing at a lot of garbage that nobody can hit.