Predicting Batter Batted-ball Outcomes
The same model as before, basically.
No two batters are the same. Identical, perhaps, but not exactly the same. Two identical stat lines can be produced in a myriad of ways. However, batted ball contact can be telling – it’s difficult to confuse a barreled ball to a soft-hit ball. I wanted to apply my Statcast hit prediction model to 2017 batters, to see which batters were easily predictable and which had outside factors beyond batted ball statistics impacting their hits and outs.
First, I would like to mention I made a major change to my model. Initially, I trained the model on a portion of 2017 data and applied the model on the rest of the season’s data. Between then and now, I added 2016 data to my SQL database and chose to train my model on all of 2016 for use on all of 2017. Here are the updated results:
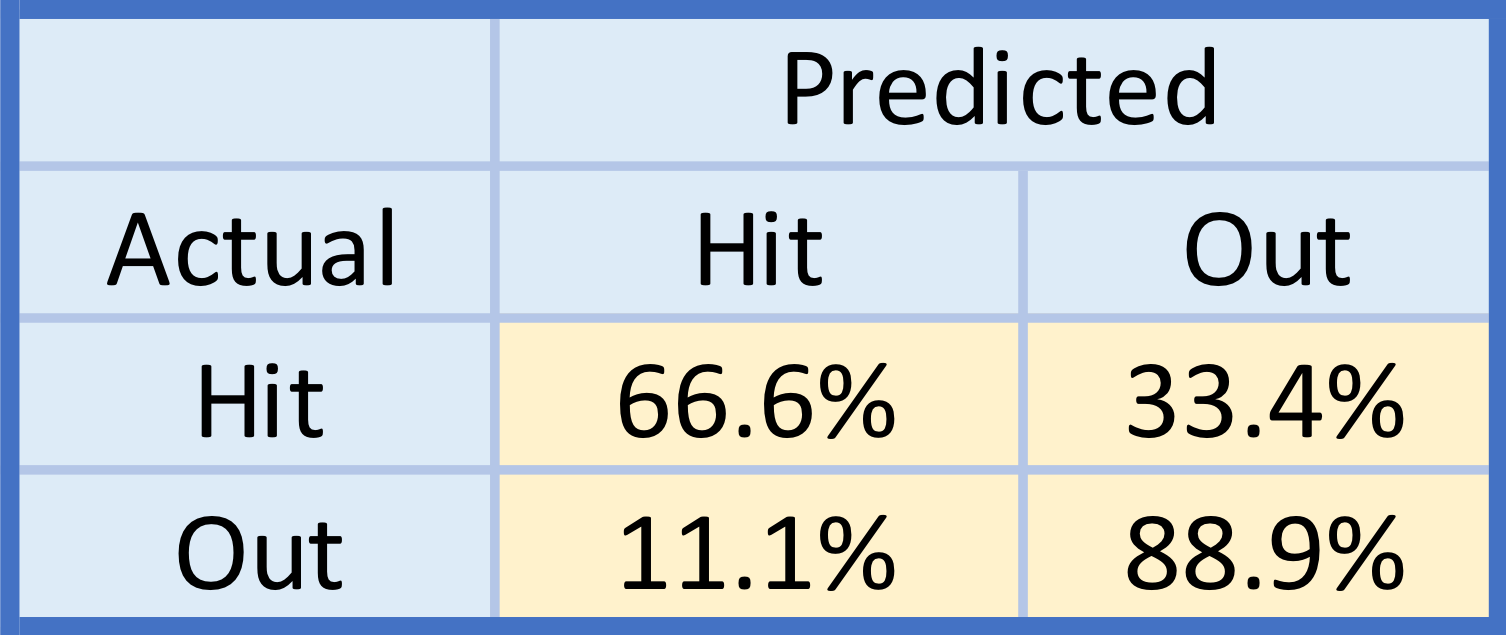
Identical. My model got slightly worse at dealing with outs (a percentage point increase I misclassifying outs as hits, corresponding with the same decrease in predicting outs as outs) and slightly better at predicting hits (a .6 percentage point increase in predicting hits as hits and the same decrease at predicting hits as outs). The purpose behind retraining the model was that now I can apply it to the entirety of 2017 instead of merely 80% of 2017 – which, when dealing with small sample sizes (such as batter-specific analysis), helps.
My model did surprisingly well at predicting the correct batted ball outcome for hitters. I limited the sample of hitters to those with 100 or more balls in play, removing pitchers and many part-time players (though, in complete honesty, I don’t think sample size matters much here, as my model predicts each batted ball in isolation – please convince me either way in the comments).
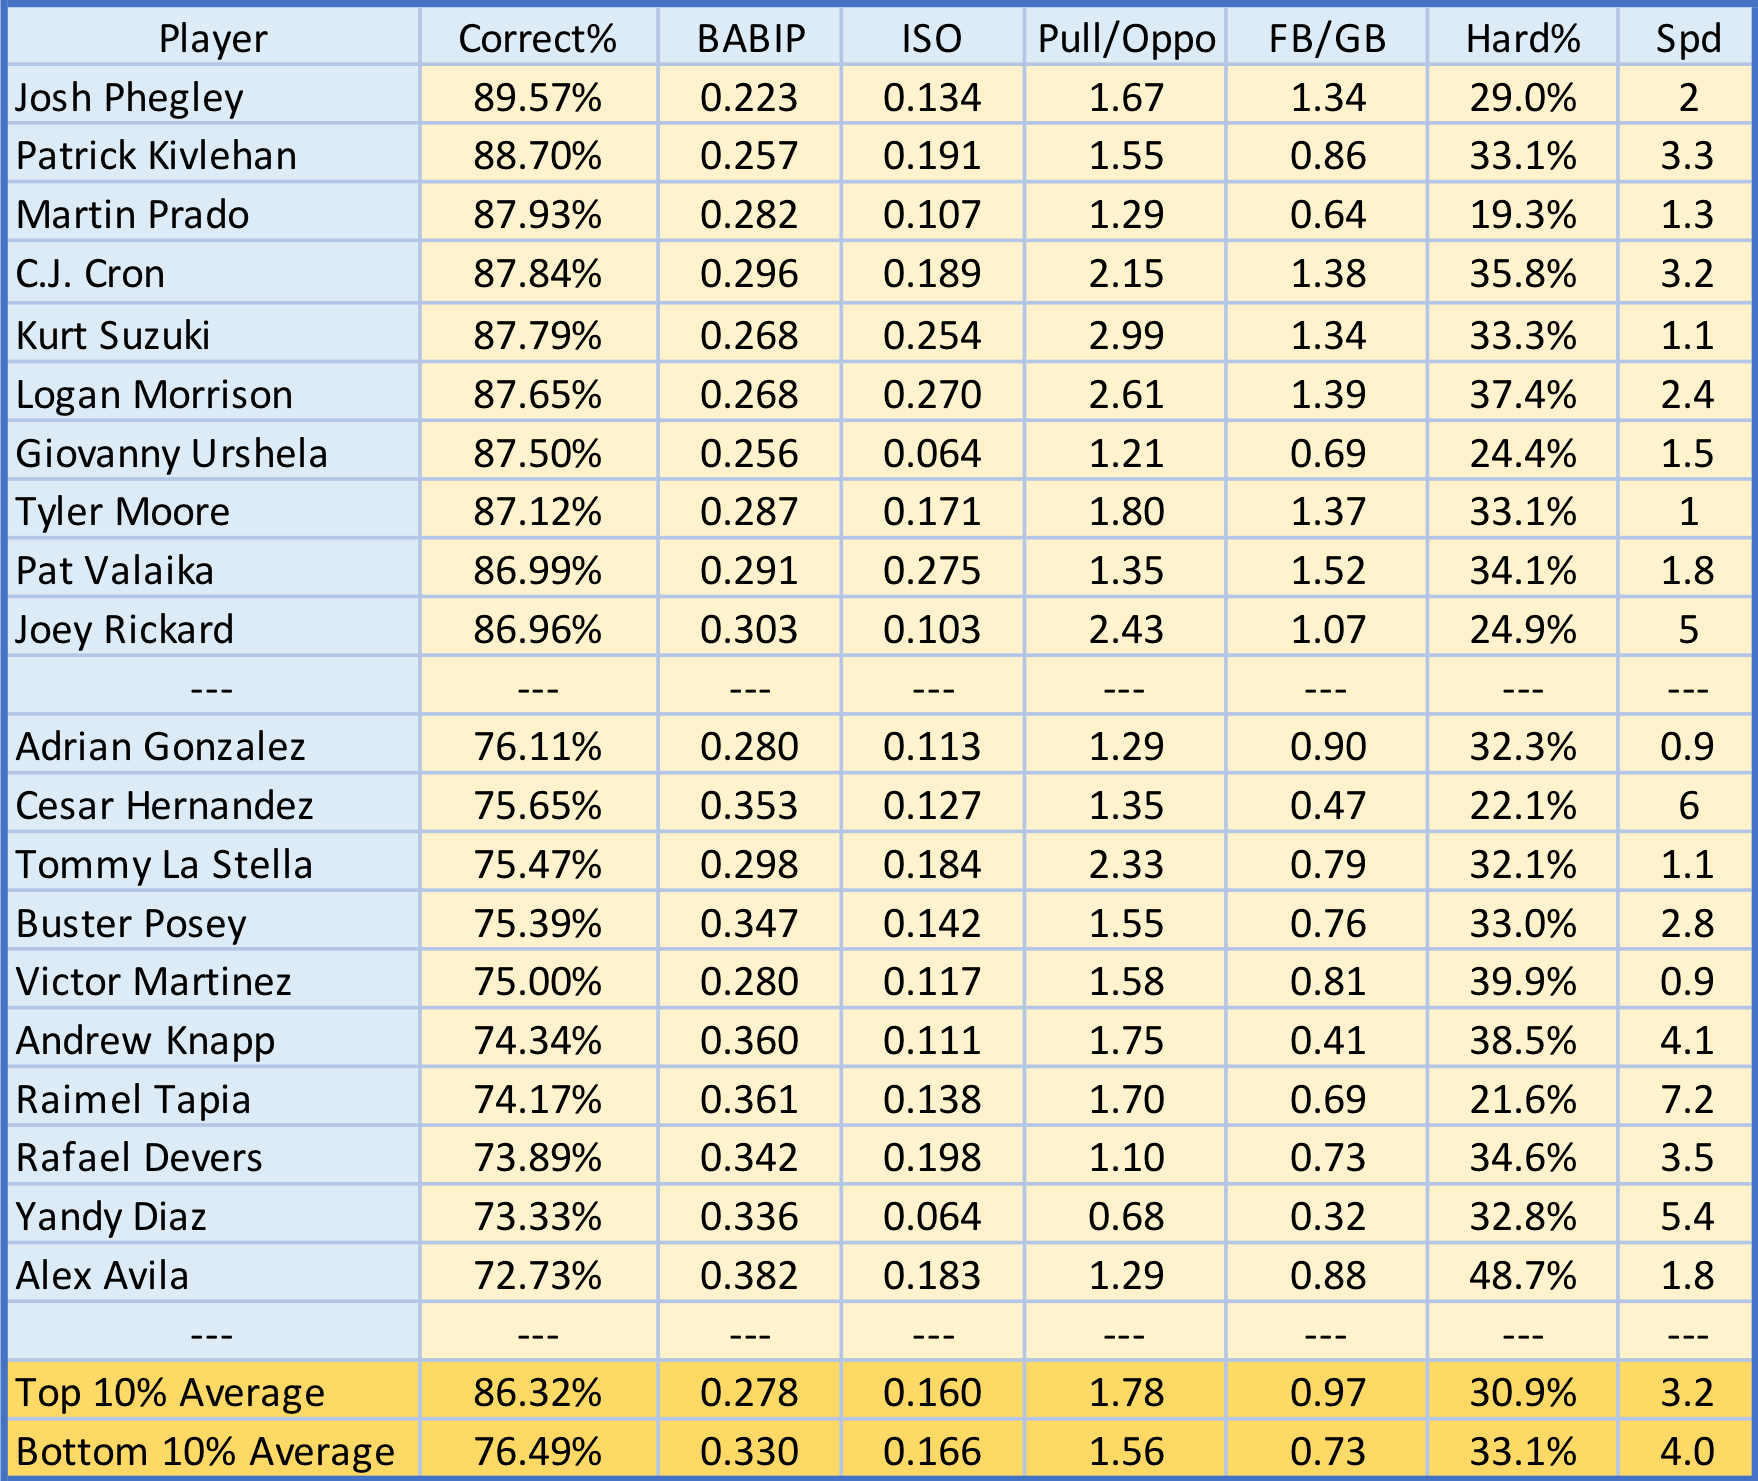
My model did pretty well! The model’s predictions ranged from 72-89%. Above are the top and bottom five players in terms of prediction accuracy (Correct%) as well as the top and bottom 10% averages. I included some statistics I thought would correlate with prediction accuracy – batting average on balls in play (BABIP), isolated slugging (ISO), pull to opposite batted ball ratio (Pull/Oppo), fly ball to grounder ratio (FB/GB), hard hit percentage (Hard%) and speed score (Spd).
My hypothesis was that higher speed and a more even spray distribution (a Pull/Oppo ratio closer to one) would decrease the performance of my model. Through comparing the top and bottom 10% averages, we see some correlations with some variables and model accuracy. BABIP, Pull/Oppo, FB/GB, Hard% and Spd all appear to impact my model’s accuracy. One thing these all have in common is that they impact BABIP – better spray charts increase BABIP, fewer ground balls decrease BABIP, harder hit balls can be harder to field (lower reaction times) and increase BABIP, and faster players can beat out infield hits at a higher rate. Clearly, some of these stats work independently of the others- for example, Buster Posey and Victor Martinez have low speed scores yet higher sprays (lower Pull/Oppo).
This has been a fun model to explore. Essentially, the ability to predict hit outcomes from batted ball statistics depends on BABIP – or, if you rather, factors that influence BABIP. Until deeper fielding data is publicly available, such as initial start position, catch probabilities, etc., I don’t think I can improve this model. Ideally, I hope to develop it into a tool to evaluate batters’ contact abilities sans luck. Let me know if there are any batters specifically that you’d like to see, or other ways I can explore the model!
– tb