Zack Britton’s Improved Sinker is Driving His Recent Success

When the Yankees re-signed Zack Britton as a free agent during this past offseason, there were some questioning if it made sense to bring back a 31-year-old reliever whose best days looked well behind him. Britton was good for the Yankees after being acquired from the Orioles in July 2018, posting a 2.88 ERA in 25 appearances, but his fielding-independent measures left more to be desired with a 4.08 FIP and lower strikeout numbers than what he posted during his dominant 2015 and 2016 seasons, performances that saw him emerge as the best relief pitcher in baseball.

Britton got off to a slow start in 2019, raising more questions about his long-term status and the Yankees’ decision to give him a large contract. He ended April with a 3.00 ERA, but his primary pitch, the sinker, did not have the same life on it that it did back in his prime years. The pitch sat mostly below 95 mph in April, and his FIP peaked at 3.93 on May 3rd, when he gave up two runs by issuing a walk and surrendering a home run in one inning against the Minnesota Twins. Since that point, Britton has issued five walks while striking out 12 in 16.1 innings and has only allowed three runs, coming courtesy of a Vladimir Guerrero Jr. home run on June 5th that was literally the first home run to be hit off a Britton sinker that was outside of the zone. That lone blemish aside, I noticed that his sinker has returned closer to its peak during this stretch, likely the best its been while Britton has worn a Yankees uniform.

To show that I am not making this up, here is a chart showing the average velocity of Britton’s sinker in every game this season:

june_brittonupdate1

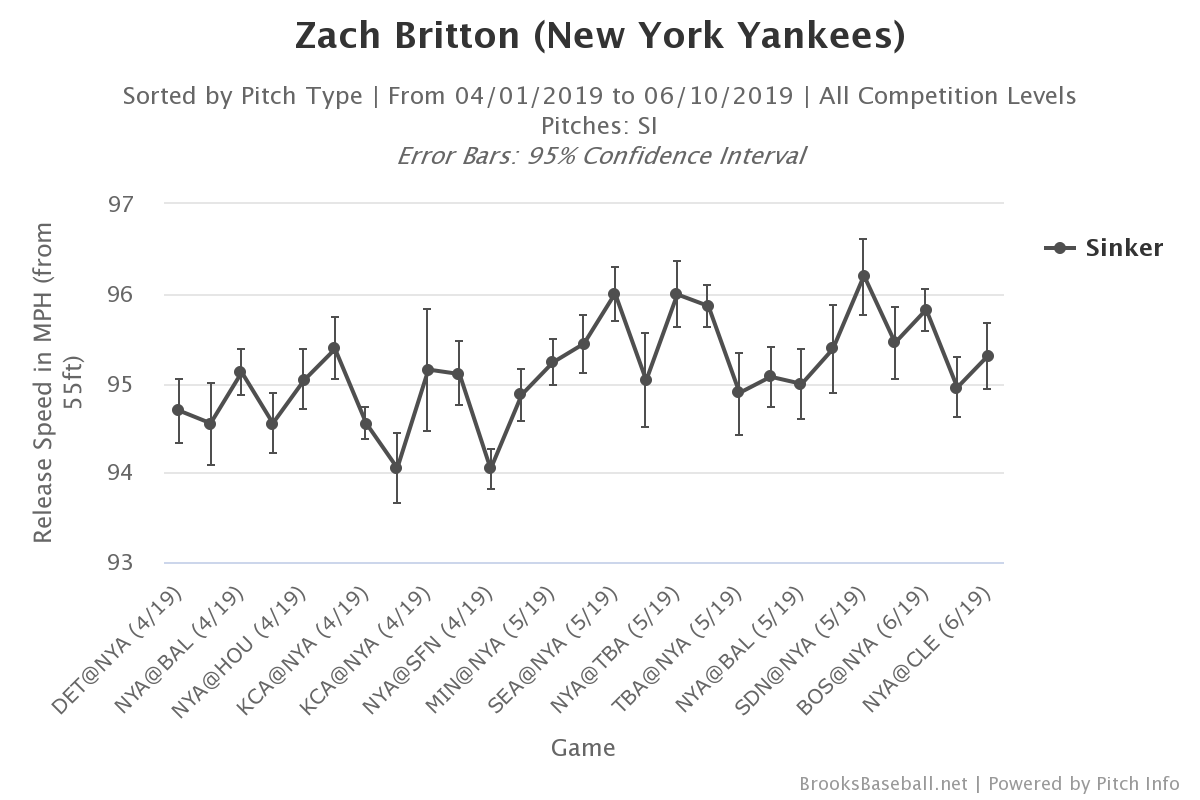
According to Brooks Baseball, since his outing against the Giants on April 26th (in which he issued three walks), there has been an increase in average velocity each outing before a couple of drop-offs, but it has consistently been at around 95 mph and has averaged 96 multiple times since. The recent Vlad Jr. hiccup skews some of the numbers a bit, but during this period, Britton saw his ERA and FIP drop to their lowest marks of the season at 2.05 and 3.00 respectively before rising again after that June 5th game against Toronto. His strikeout rate also has risen to 22.3%, the best mark for Britton since his remarkable 2016 season. Also according to Brooks Baseball, the 95.52 average sinker velocity he recorded in May 2019 is the highest for Britton in a single month since September 2017. These are all good signs that suggest Britton’s progress in his road back to being an elite reliever. Read the rest of this entry »


Fun Numbers Through the First Two Months

SNELL THE GLOVE

Since 2002, when the stat began being recorded, the top three swinging strike percentages for pitchers through June 1st of a season (minimum 60 innings) are…

1. Blake Snell (2019) – 19.1%
2. Max Scherzer (2018) – 17.5%
3. Curt Schilling (2002) – 16.8%

To say that Snell has been in fine form the first two months of the season would be a massive understatement, as he’s in historic form according to this metric. The reigning AL Cy Young winner’s surface numbers may not look as incredible as they did last year, but his talent is still off the charts.

RYU READY TO ROCK?

When facing lefties, there is an offense that ranks first in ISO, second in wOBA, third in wRC+, and possesses the eighth-lowest strikeout rate this season. It’s not the Twins, who have caught the serious attention of the baseball world. It’s not the Astros, who have had quite the reputation of being death to lefties for the past few years. It’s also not the other teams (the Dodgers, Mariners, Braves, Cardinals, etc.) you would normally suspect…

Yep, you didn’t guess it!

It’s the Arizona Diamondbacks. Granted, two months of data may still be leaning on the short side of sample sizes when it comes to team trends. Their BABIP indicates at least some bit of good fortune, and they currently sit with the third-lowest walk rate. However, none of this mattered against Hyun-Jin Ryu in his last outing on June 4. The Dodgers southpaw continued his stellar campaign by firing seven scoreless innings against the D-backs, allowing just three hits to move to 9-1 in 12 starts. Ryu now holds a 1.35 ERA, 2.6 fWAR, and has allowed just five walks to 71 strikeouts in 80 innings.

It’s worth noting that the matchup took place at Chase Field, where they’ve been conveniently keeping the roof open for night games, which in turn mitigates the effects of the humidor system they installed before the 2018 season. That said, Ryu is doing something truly remarkable and seems capable of silencing just about any lineup in MLB. Read the rest of this entry »


“Stuff” and Father Time

The question of how pitchers age is paramount to players and front offices. “Stuff,” the colloquial term for raw talent throwing the baseball, can really be boiled down to velocity and movement (if we really wanted to oversimplify things). PITCHf/x gives us an opportunity to use big data to estimate “stuff” by looking at measurements of velocity and movement. We can use the copious data collected to estimate what “stuff” we can expect from pitchers as they pass the dreaded 30-years-old mark and beyond.

PITCHf/x reports movement in horizontal and vertical vectors. Horizontal movement (Hmov) is the right or left movement of the pitch compared to the expected trajectory without air resistance. A positive value is away from a right-handed batter. Vertical movement (Vmov) is the amount the ball moves up or down relative to the expected drop in a vacuum. A positive value means the ball dropped less than would be expected without effective spin.

It has been established that fastball velocity tends to decrease with age, but movement trends haven’t been looked at before. Might aging pitchers compensate their decrease in velocity with an increase in movement? Or does time steal away effective spin as well?

Let’s find out.

Methods:

I collected all PITCHf/x data from every pitcher with at least 300 innings pitched from 2007 to 2018 (n=537). Data was aged based on the age of the player on April 1st of the corresponding season. Velocity, horizontal movement, and vertical movement were averaged for each age and graphed. The horizontal axis of left-handed pitchers was flipped so right and left-handed data could be analyzed together.

I then took out the top starters by WAR (n=63), according to FanGraphs, from 2007 to 2018 and graphed their data separately.

Results/Discussion: Graphs are available by clicking on the links below, and raw data available in tables at the end of this post. Read the rest of this entry »


Taking a Deeper Look at Derek Dietrich

Did you know that when Derek Dietrich is not occupied with his beekeeping business, he moonlights as a baseball player?

In fact, he has seen remarkable improvements in his side gig this year. After being released by the Marlins in the offseason, Dietrich accepted a minor league offer with the Reds. A variety of injuries and under-performers opened the door for Dietrich, who has made the most of his opportunity. Through 56 games this season, Dietrich has already hit 17 home runs, surpassing his previous career high of 16, set last year. On the same note, Dietrich currently has a 169 wRC+ which, if he was qualified, would tie for 9th in baseball. In many cases where a player experiences such a sudden and extreme breakout, it is common for him to experience luck with batted balls. Remarkably, Dietrich has excelled this season despite a .220 average on balls in play.

This year, Dietrich, like many before him, has made a conscious effort to hit the ball in the air. According to Baseball Savant, Dietrich has increased his average launch angle from 15.7 to 20.0. Furthermore, 17.2% of Dietrich’s batted balls have been hit “on the barrel,” which ranks 14th in MLB and three spots ahead of Christian Yelich. Paired with a lessening tendency to offer at pitches outside of the strike zone, Dietrich’s new swing has prompted his breakout despite minimal luck on balls that did not leave the park. Read the rest of this entry »


Frankie Montas Splits His Way to Success

Frankie Montas has seemingly been around forever, first signing at age 16 with the Boston Red Sox in 2009. He was then traded, going from Red Sox to White Sox, along with Cleuluis Rondon and Jeffrey Wendelken as part of the Jake Peavy trade in 2012, which seems like an eternity ago. He quickly emerged as one of the top pitching prospects in the White Sox system and was promoted directly from Double-A to throw 15 innings in the majors in 2015, with his final two appearances being as a starter. Those would be his only two starts for the White Sox however, because Montas was then traded to the Dodgers in a three-team deal that most notably sent Todd Frazier to the White Sox and Jose Peraza to the Reds.

Once again, Montas barely pitched in the Dodgers organization as he underwent rib resection surgery, forcing him to miss four months of the season. Shortly after his surgery and returning to the field, Montas broke his rib, costing him nearly the rest of the 2016 campaign. Before the season ended, Montas was on the move again, this time to Oakland along with Grant Holmes and Jharel Cotton as part of the trade that sent Josh Reddick and Rich Hill to the Dodgers.

In 2017, Montas got to start his season in the majors with Oakland, but oh boy did he struggle. In 32 relief innings, Montas posted a 7.03 ERA and 7.13 FIP, partially due to a terrible 1.8 K:BB ratio and a inflated 26.3% HR/FB rate, forcing him back down to Triple-A Nashville. Despite concerns that Montas’s lack of a quality secondary pitch and questionable control might limit him to a high-leverage relief role, the A’s decided to stretch Montas out as a starter. Montas would join the rotation in late May 2018 until late July, when he posted a respectable 3.88 ERA with a matching FIP despite an underwhelming K-rate of 15.2%.

Montas showed enough to gain a slot in the 2019 rotation, and he has taken off so far. This season, Montas has produced a 2.81 ERA, a 2.88 FIP, and a solid 3.67 K:BB ratio, producing 2.0 fWAR in 64 IP. By fWAR, Montas has been the 9th-most valuable starter in the majors in 2019. Has Montas truly emerged as a legit front-line starter? If so, how has he taken this leap forward? Read the rest of this entry »


Patrick Murphy Is in a Rhythm at New Hampshire

Prior to his start on Tuesday night when he allowed seven earned runs, Blue Jays No. 26 prospect Patrick Murphy was mowing down opponents in the Double-A Eastern League.

After allowing 12 earned runs through his first four starts of the season, the 6-foot-4, 220-pound right-hander really turned things around, dropping his ERA from 6.11 to 3.14 before Tuesday’s game. In three of his six starts since, he had gone seven innings while allowing one or zero runs.

Here is a comparison of his first four starts compared to the five that followed:

First four starts: 17.2 IP, 19 H, 12 ER, 8 BB, 18 K

Following five starts: 34 IP, 17 H, 6 ER, 4 BB, 39 K

The bottom numbers are the Patrick Murphy Dunedin fans became accustomed to watching last season when he posted some of the best stats in the organization among pitchers.

He started 26 games in Dunedin last year, throwing 146.2 innings with an ERA of 2.64, and he even got a start in Double-A New Hampshire, where he allowed two runs and struck out six over six innings. Read the rest of this entry »


Do Higher Signing Bonuses Help Players Advance?

A lot has been written over the past year about pay at the minor league level and attempts to fix things, and with good reason — it’s a pretty bad situation, and with fundamental decency in mind, it is certainly a good thing that it may be changing.

But alongside that discussion, I’ve been kind of curious of how changing minor league pay would actually change performance. In theory, paying players more could let them focus on baseball, translating to better performance. If that’s the case, it’s even possible that paying players more could actually “pay for itself” if the value of the extra wins players generate outweighs the costs of paying them more. In a perfect world, to test that, you could randomly pay some players more than others and see which group does better.

We don’t live in a perfect world, but we do live in one where signing bonuses are still pretty random. Yes, obviously players drafted higher receive higher bonuses on average, but there’s still pretty significant variation across the board, especially when you get into later rounds. In 2015, for example, there were 105 players drafted who had assigned “slot values” of between $130,000 and $200,000, and their bonuses were anywhere from $2,000 to $1,000,000. While in general higher bonuses should go to more talented prospects, it also stands to reason that two players drafted around the same time with around the same slot values should have around the same talent level and chances to make the majors.

With that in mind, I took a look at a couple different ways of seeing how well players with much lower bonuses progressed. Using 2014-16 draft data from SBN, I had a set of all players drafted in the first 10 rounds along with their signing bonuses and slot values, which I then matched with FanGraphs’ data on player appearances at either the Triple-A or major league level from 2014 to 2019. In total, this left me with 922 players, of whom 319 (~35%) made a Triple-A or MLB appearance and 144 (~16%) that made an MLB appearance. 153 (~17%) had a signing bonus of $50,000 or lower. I looked at two different ways to see how signing bonuses varied with advancement. Read the rest of this entry »


Getting to Know Braves Closer Luke Jackson

In a 2019 season that has started with so many bullpens struggling (and yes, Craig Kimbrel still unemployed to this date), we still have relievers that have been brilliant thus far, some of them more surprising than others. That category of the surprising includes our guy, Luke Jackson.

Jackson, a 27-year-old righty from Fort Lauderdale, is in his third season with the Braves. He might go unnoticed if: a) one does not watch Atlanta much or b) one only looks at the current leaderboards in most metrics. By traditional stats, for example, he barely cracks the top 100 relievers in ERA (a three-run ninth on Tuesday in San Francisco took him away from the top 50) and is well below Kirby Yates’ 20 saves. As we move to advanced metrics, we see him climb higher, though still far from the leaders. His 2.24 xFIP ranks him eighth in the big leagues but well below Josh Hader’s 1.59 that currently leads the NL. While we are still early in the season and a few bad outings could hamper his (or any reliever’s) numbers, Jackson deserves to be looked at, mostly because he is changing Braves fans’ opinion from “this guy again?” to a growing sensation of security when he comes up to pitch. And that has not gone unnoticed for Brian Snitker, to whom he has now become the closer and the guy who handles most of high-leverage situations.

After a spring training that included two awful outings against the Astros and Red Sox, Jackson cracked the Opening Day roster and saw action on March 28th, on the first game of an opening series that was a catastrophe for the Braves, and especially for the bullpen. He entered to pitch the 6th inning with Atlanta trailing Philadelphia 6-3, and less than twenty pitches later, the game was as good as lost. A walk and a throwing error of his own set up the frame. The Braves intentionally walked Bryce Harper, and behind him, Rhys Hoskins hit a grand slam that put the final nail in the coffin. Twenty-two appearances later, the only extra bases he has allowed are a homer by David Peralta (who has been mashing against the Braves) and three doubles, and most importantly, he has allowed only five runs, three of them in that blown save earlier this week. Despite that, he holds a 1.80 ERA if we take out his horrid season debut.

Why so much attention on a pitcher that so far has shown nothing else than a great start to the season after more than 100 career innings of subpar pitching? Because this season is the best he has had since his debut in the big leagues with the Texas Rangers back in 2015, and this stretch (which included 14 appearances without allowing a run) already accounts for hist best one in The Show. Thus, it sure would be nice to (at least try to) analyze why. Read the rest of this entry »


Franmil Reyes Is Being the Beast Who Was Promised

Editor’s note: The FanGraphs Community Blog has received multiple submissions about Franmil Reyes lately, so we are running a pair together today. Here is the other. Happy Franmil day.

Franmil Reyes. Franimal. La Mole.

There are a few names for one of the most interesting players in the big leagues this year. He certainly has one of the most interesting triple-slash lines — Reyes was the only MLB player with a slugging percentage above .600 and an on-base percentage below .300 going into last weekend.

Reyes, who doesn’t turn 24 until July, is now firmly ensconced as the No. 2 hitter in the lineup on a San Diego Padres team that is somewhat unexpectedly above .500 more than a quarter of the way into the 2019 season.

The OBP around .300 isn’t ideal — it’s the second-lowest among the 52 players with slugging percentages above .500. Reyes ended 2018 with a .340 OBP, so he has demonstrated the ability to get on base at an above-average rate, but this season he has traded some walks for a spike in power by being aggressive, particularly early in at-bats. He was slugging .963 on first pitches after Wednesday’s game, including this blast Friday night for his 14th homer in less than 160 at-bats. There was also this shot to right-center for his 15th homer on a first pitch on Monday. If pitchers come to the inside part of the plate on a 0-0 count against Reyes, he has made them regret it.

Impressively, his aggression is not leading to an increase in strikeouts — rather, his K rate has gone down from 28% in 2018 to 25% in 2019. Reyes has made a lot of noise with his bat, including many loud outs. Bad batted ball luck has led to a .255 BABIP this year despite being in the 93rd percentile in average exit velocity, so there is still possibly some upside he has yet to reach. He isn’t in danger of platooning, with a higher OPS against RHP than LHP, and his spray chart shows he can do as much damage to the opposite field as he can the pull side. Read the rest of this entry »


The Next Giancarlo Stanton Has Arrived

Editor’s note: The FanGraphs Community Blog has received multiple submissions about Franmil Reyes lately, so we are running a pair together today. Here is the other. Happy Franmil day.

When you consider a power hitter like Giancarlo Stanton, it’s hard to think of any other player that can crush the ball the way he can outside of his teammate Aaron Judge. However, there appears to be a young slugger who resembles Stanton in many ways that everyone should be paying more attention to. This is a player who debuted in 2018, and is playing in his first full season in 2019. Meet Franmil Reyes, the 23-year-old Padres outfielder who has 15 home runs through his first 50 games this season. Obviously it’s pretty significant to compare any baseball player to Giancarlo Stanton, right? What’s awesome about this comparison specifically is that Reyes stacks up with Stanton in almost every statistical category from the 2018 season. Take a look at how their offensive numbers compare:

Giancarlo Stanton & Franmil Reyes, 2018
Name BB% K% ISO BABIP OBP SLG wOBA wRC+
Stanton 9.9 % 29.9 % 0.243 0.333 0.343 0.509 0.360 127
Reyes 8.4 % 28.1 % 0.218 0.345 0.340 0.498 0.360 129

As you can see above, Reyes and Stanton produced almost identically at the plate last season. Of course Stanton produced over the course of a full season, while Reyes played slightly more than half of a season’s worth of games (87). Nonetheless, the similarities between their statistical outputs are remarkable. When we get into the Statcast numbers from the 2018 campaign, the two sluggers once again compare pretty well:

Giancarlo Stanton & Franmil Reyes, 2018
Player Avg Exit Velo FB/LD Exit Velo GB Exit Velo
Stanton 93.7 mph 99.7 mph 91.4 mph
Reyes 92.3 mph 96.4 mph 90.1 mph

With this data, it’s clear that Reyes didn’t quite hit the ball as hard as Stanton. Despite their similarities statistically, Stanton definitely showed a better ability to crush the ball than Reyes did. We’re looking at the 2018 data because Stanton is currently hurt, but Reyes’ 2019 Statcast data has actually improved this season. Here’s how he’s performed in the same categories thus far: Read the rest of this entry »