Hardball Retrospective – The “Original” 2012 Tampa Bay Rays

In “Hardball Retrospective: Evaluating Scouting and Development Outcomes for the Modern-Era Franchises”, I placed every ballplayer in the modern era (from 1901-present) on their original team. Consequently, Hank Aaron is listed on the Braves roster for the duration of his career while the Blue Jays claim Carlos Delgado and the Brewers declare Paul Molitor. I calculated revised standings for every season based entirely on the performance of each team’s “original” players. I discuss every team’s “original” players and seasons at length along with organizational performance with respect to the Amateur Draft (or First-Year Player Draft), amateur free agent signings and other methods of player acquisition.  Season standings, WAR and Win Shares totals for the “original” teams are compared against the “actual” team results to assess each franchise’s scouting, development and general management skills.

Expanding on my research for the book, the following series of articles will reveal the finest single-season rosters for every Major League organization based on overall rankings in OWAR and OWS along with the general managers and scouting directors that constructed the teams. “Hardball Retrospective” is available in digital format on Amazon, Barnes and Noble, GooglePlay, iTunes and KoboBooks. Additional information and a discussion forum are available at TuataraSoftware.com.

Terminology

OWAR – Wins Above Replacement for players on “original” teams

OWS – Win Shares for players on “original” teams

OPW% – Pythagorean Won-Loss record for the “original” teams

Assessment

The 2012 Tampa Bay Rays             OWAR: 46.4     OWS: 254     OPW%: .607

GM Chuck Lamar acquired 77.7% (21 of 27) of the ballplayers on the 2012 Rays roster. With the exception of Elliot Johnson and Jose Veras all of the players were selected during the Amateur Draft. Based on the revised standings the “Original” 2012 Rays registered 98 victories and secured the American League Eastern division title by a 16-game margin over the New York Yankees.

David Price (20-5, 2.56) collected the 2012 AL Cy Young Award for his superlative campaign in which he topped the Junior Circuit in victories and ERA while striking out 205 batters. “Big Game” James Shields (15-10, 3.52) tallied 223 whiffs and fashioned a 1.168 WHIP. Jeremy Hellickson (10-11, 3.10) provided a reliable effort in his sophomore season and added a Gold Glove Award to his trophy case. Jason Hammel (8-6, 3.43) and Matt Moore (11-11, 3.81) stabilized the back-end of the rotation.

Jake McGee led the bullpen crew with a 1.95 ERA and a WHIP of 0.795. Wade Davis contributed an ERA of 2.43 in 54 relief appearances after starting 64 contests in the three prior campaigns.

ROTATION POS WAR WS
David Price SP 6.4 19.12
Jeremy Hellickson SP 3.57 11.21
James Shields SP 2.85 12.33
Jason Hammel SP 2.82 9.74
Matt Moore SP 1.76 8.07
BULLPEN POS WAR WS
Jake McGee RP 1.09 7.5
Wade Davis RP 0.9 6.43
Jose Veras RP 0.75 5.01
Chris Seddon SW 0.37 1.97
Chad Gaudin RP -0.46 2.68
Alex Cobb SP 1.14 6.18
Jeff Niemann SP 0.5 2.07
Dan Wheeler RP -0.68 0

Josh Hamilton blasted 43 round-trippers and scored 103 runs (both career-bests) en route to a fifth-place finish in the 2012 A.L. MVP balloting. B.J. Upton and protégé Desmond Jennings nabbed 31 bags apiece at the top of the order. Upton established a personal best with 28 circuit clouts. Evan Longoria batted .289 with 17 jacks despite missing 88 games due to a partially torn hamstring. John Jaso delivered a career-high .394 OBP and Jonny “Ironsides” Gomes swatted 18 big-flies. 

LINEUP POS WAR WS
B. J. Upton CF 2.56 19.64
Desmond Jennings LF 1.62 15.18
Josh Hamilton DH/CF 4.39 25.5
Evan Longoria 3B 2.39 11.12
Jonny Gomes RF/DH 2.05 13.04
John Jaso C/DH 2.83 15.96
Aubrey Huff 1B 0.07 1.14
Elliot Johnson 2B/SS 1.02 8.62
Reid Brignac SS -0.19 0.52
BENCH POS WAR WS
Carl Crawford LF 0.46 3.19
Jason Pridie RF 0.1 0.5
Matt Diaz LF -0.25 1.61
Stephen Vogt C -0.35 0.16
Delmon Young DH -1.37 6.95

The “Original” 2012 Tampa Bay Rays roster

NAME POS WAR WS General Manager Scouting Director
David Price SP 6.4 19.12 Andrew Friedman R.J. Harrison
Josh Hamilton CF 4.39 25.5 Chuck LaMar Dan Jennings
Jeremy Hellickson SP 3.57 11.21 Chuck LaMar Tim Wilken
James Shields SP 2.85 12.33 Chuck LaMar Dan Jennings
John Jaso DH 2.83 15.96 Chuck LaMar
Jason Hammel SP 2.82 9.74 Chuck LaMar Dan Jennings
B. J. Upton CF 2.56 19.64 Chuck LaMar Dan Jennings
Evan Longoria 3B 2.39 11.12 Andrew Friedman R.J. Harrison
Jonny Gomes DH 2.05 13.04 Chuck LaMar Dan Jennings
Matt Moore SP 1.76 8.07 Andrew Friedman R.J. Harrison
Desmond Jennings LF 1.62 15.18 Andrew Friedman R.J. Harrison
Alex Cobb SP 1.14 6.18 Andrew Friedman R.J. Harrison
Jake McGee RP 1.09 7.5 Chuck LaMar Cam Bonifay
Elliot Johnson SS 1.02 8.62 Chuck LaMar Dan Jennings
Wade Davis RP 0.9 6.43 Chuck LaMar Cam Bonifay
Jose Veras RP 0.75 5.01 Chuck LaMar Dan Jennings
Jeff Niemann SP 0.5 2.07 Chuck LaMar Cam Bonifay
Carl Crawford LF 0.46 3.19 Chuck LaMar Dan Jennings
Chris Seddon SW 0.37 1.97 Chuck LaMar Dan Jennings
Jason Pridie RF 0.1 0.5 Chuck LaMar Dan Jennings
Aubrey Huff 1B 0.07 1.14 Chuck LaMar Dan Jennings
Reid Brignac SS -0.19 0.52 Chuck LaMar Cam Bonifay
Matt Diaz LF -0.25 1.61 Chuck LaMar Dan Jennings
Stephen Vogt C -0.35 0.16 Andrew Friedman R.J. Harrison
Chad Gaudin RP -0.46 2.68 Chuck LaMar Dan Jennings
Dan Wheeler RP -0.68 0 Chuck LaMar
Delmon Young DH -1.37 6.95 Chuck LaMar

Honorable Mention

The “Original” 2008 Rays                   OWAR: 39.4     OWS: 276     OPW%: .528

Five members of the 2008 Tampa Bay Rays accrued at least 20 Win Shares including Josh Hamilton, B.J. Upton, Aubrey Huff, Evan Longoria and Akinori Iwamura. Hamilton hit .304 with 32 jacks and a League-leading 130 RBI. “Huff Daddy” launched 32 four-baggers and knocked in 108 baserunners. Longoria (.272/27/85) claimed Rookie of the Year honors and Upton swiped 44 bases.

On Deck

The “Original” 2009 Rockies

References and Resources

Baseball America – Executive Database

Baseball-Reference

James, Bill, with Jim Henzler. Win Shares. Morton Grove, Ill.: STATS, 2002. Print.

Retrosheet – Transactions Database – Transaction a – Executive 

SB Nation – “Evan Longoria injury – 2012 return in question”

Seamheads – Baseball Gauge

Sean Lahman Baseball Archive


K-BB vs. the RotoGraphs Top Starting Pitcher Rankings

Back on January 1, I wrote an article proposing a “quick-and-easy” way to rank starting pitchers for fantasy baseball. The TL; DR (Too Long; Didn’t Read) summary is that you can take the projections of your starting pitchers and rank them by the simple metric “strikeouts minus walks” (K-BB). I also looked at slightly more complex metrics like “strikeouts minus walks minus home runs” (K-BB-HR) and “strikeout rate minus walk rate, divided by games started” (K%-BB%/GS) and both of those had a slightly better correlation, but are not as simple.

The correlation between the starting pitcher rankings based on K-BB and starting pitcher rankings based on dollar values was around 0.80 for each of the last three years.

At the time, I created a list of the top starting pitchers based on Steamer projections, as those were the only readily available projections out there. Now that we’re getting closer to the season, more projections are available. At Fantasy411, they have a downloadable spreadsheet with the composite projections from 12 different providers. It’s a true “wisdom of the crowds” approach.

Using this collection of projections, I ranked the starting pitchers using the very simple K-BB metric and compared those rankings to the consensus rankings for starting pitchers on the updated RotoGraphs Top 300. I downloaded the spreadsheet from the post on February 17th by Paul Sporer where he explained that players not ranked by a writer would get a “last ranked+1” for that particular player. There were 87 starting pitchers ranked in the Top 300. [Note: I would have used K-BB-HR but the composite projections did not have home runs allowed for pitchers]

First off, the correlation between the RotoGraphs Top 300 rankings for these 87 starting pitchers and my rankings based on K-BB came out to 0.81. Also, 46 of the 87 pitchers (53%) were within 12 spots of each other on the two lists, or the equivalent of one round in a 12-team league. Seventy-four of the 87 pitchers (85%) were within 24 spots of each other, the equivalent of two rounds in a 12-team league.

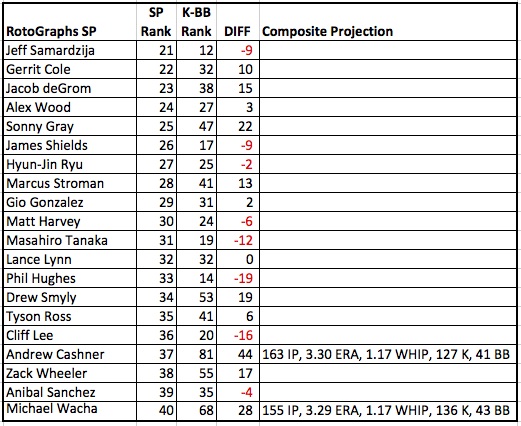
The charts below show the starting pitchers based on the RotoGraphs Top 300, along with their rank by K-BB, the difference between the two, and the composite projection from the Fantasy411 sources for selected pitchers who were off by a significant number of picks. By looking at the projections for these pitchers, we may better understand why the rankings differ so much.

The Top 20:

Most of the pitchers in the top 20 are similarly ranked by the RotoGraphs’ Five and the K-BB method. Just one of these 20 pitchers has a rankings difference that is off by more than 12 (one round in a 12-team league). Carlos Carrasco has the biggest difference in this group of pitchers between his K-BB rank of 44th and his RotoGraphs’ rank of 16th. Carrasco is a popular sleeper. He’s such a popular sleeper that he’s probably no longer a sleeper. I think most people are wide-awake on Carlos Carrasco by this point. The composite projection has Carrasco down for 156 innings in 2015. Steamer projects 163 innings, ZiPS has him for 119, and the optimistic Fans are projecting 191 innings, which is more than Carrasco has pitched in the last two seasons combined.


The Next 20 (21-40)

There are more differences as we move down the list of starting pitchers. Sonny Gray (ranked 25th by RotoGraphs, 47th by K-BB) is an interesting guy to look at. For his career, Gray has a 2.99 ERA and 1.17 WHIP, but his FIP is 3.39, xFIP is 3.34, and SIERA is 3.44. Gray’s ERA and WHIP have been helped by a .277 career BABIP. That’s quite low, but Oakland as a team allowed a .276 BABIP in 2013 (2nd best in baseball) and .272 BABIP in 2014 (tops in baseball). If you expect that to continue, then Gray is probably better ranked by the RotoGraphs Five. Steamer (3.75 ERA, 1.29 WHIP) and ZiPS (3.36 ERA, 1.26 WHIP) are not so optimistic.

Phil Hughes’ impressive ability to limit bases on balls might have him ranked too highly by K-BB.

Andrew Cashner has the second largest difference between his ranking by K-BB (81st) and RotoGraphs (37th) of any pitcher in the RotoGraphs Top 300. Cashner has a history of injuries and he’s on record as saying he’s focusing more on getting quick outs than strikeouts. Over the last two seasons, his K% has been 18.1% and 18.4%. That 18.4% mark last year placed him 80th among pitchers with 120 or more innings. His 5.7% BB% placed him 41st and that was the best BB% of his career. Looking at just strikeouts and walks it’s easy to see why Cashner is ranked by K-BB among pitchers like Matt Cain and Jon Niese rather than Cliff Lee and Zack Wheeler (Cashner is between those two in the RotoGraphs starting pitcher rankings).


The Next 20 (41-60)

Garrett Richards’ composite projection calls for 137 strikeouts in 160 innings, which comes out to a 7.7 K/9. Steamer and ZiPS both project Richards to strike out around 8.2 batters per nine innings. If Richards’ composite projection is upped to a strikeout rate of 8.2 K/9, he would move up to 64th on the K-BB list.

Dallas Keuchel was very successful last year, posting a 2.93 ERA and 1.18 WHIP despite a middling strikeout rate (6.6 K/9). He succeeded last year with a terrific ground ball rate (63.5%) and by allowing far fewer home runs than he had in his first two years in the big leagues. The K-BB metric ranks Keuchel 77th among starting pitchers based on the two things a pitcher has the most control over.

Justin Verlander and Ian Kennedy are the two pitchers with the biggest difference in rankings in favor of K-BB over the RotoGraphs Five rankings and Drew Hutchison and Scott Kazmir are both in the top seven. Verlander is coming off an ugly 4.54 ERA, 1.40 season in which his strikeout rate dropped just below 7.0 K/9 after being around 9 K/9 for the bulk of his career. The composite projection expects his strikeout rate to go back up to 7.7 K/9 and his ERA to come down close to his 2014 FIP of 3.74. With a projection of 208 innings, Verlander is ranked 25th by K-BB, 34 spots ahead of where he’s ranked by the RotoGraphs’ writers. Similarly, Ian Kennedy is ranked 23rd by K-BB and 55th by RotoGraphs. He’s coming off a better year than you might realize, with 9.3 K/9 and a 3.21 FIP, but a 3.63 ERA.


The Final 27 (61-87)

In this final group of pitchers, the guys that K-BB likes much more than the RotoGraphs’ writers include John Lackey, Mike Minor, and A.J. Burnett. It’s possible that Lackey (36 years old) and Burnett (38 years old) were ranked lower by the RotoGraphs’ writers because of expected age-related decline. Also, Burnett had a 4.59 ERA and 1.41 WHIP with the Phillies in 2014. The composite projection may be looking at the 38-year-old Burnett through rose-colored glasses when he’s projected for 195 innings and an ERA below 4.00, but he has pitched an average of 202 innings over the last seven years and had 213 2/3 innings last season. Like Burnett, Minor is coming off a terrible year—4.77 ERA, 1.44 WHIP, which has him ranked 77th by the RotoGraphs Five. As bad as his results were in 2014, Minor’s strikeout rate was in the range of his two previous seasons and his walk rate was only slightly worse than his career mark. After the season he just had he’s a potential buy low candidate based on K-BB.

The three pitchers in this group who are much higher ranked by the RotoGraphs writers are James Paxton (the biggest difference in ranking of all the pitchers on this list), Tanner Roark (4th largest difference), and Henderson Alvarez (5th largest difference). Paxton (143 innings) and Roark (122 innings) have low playing time projections that limit their K-BB value. Henderson Alvarez is projected for a solid 182 innings, but with a projected strikeout rate of just 5.3 K/9 he gets little love from the K-BB metric.

This comparison included all 87 pitchers who were ranked in the RotoGraphs Top 300. The following pitchers are among the top 87 when ranked by K-BB and don’t show up on the RotoGraphs Top 300:


#60 CC Sabathia

#69 Wade Miley

#74 Bartolo Colon

#79 Yovani Gallardo

#81 Bud Norris

#84 Jon Niese

#84 Ricky Nolasco

#86 Trevor Bauer


I plan to revisit this at the end of the year. I’ll compare the RotoGraphs’ rankings and the K-BB rankings for these 87 pitchers to the actual end of season dollar value rankings for starting pitchers in 2015.


A PCA for Batter Similarity Scores (Part 1: Basic Methodology)

This is the first in a series of pieces on a tool I’ve been working on. Admittedly, right now it’s quite raw, and probably needs some adjustments, which I’ll elaborate on towards the end of this post. It’s also quite lengthy – set it aside for when you have ample time to follow along, as there are some example calculations included to demonstrate the process.

Most of you are familiar with the “Similarity Scores” feature on Baseball Reference. If not, the explanation can be found here. The idea is to provide player comps using the player’s statistics. This has been around a while, and is based on a fairly simplistic “points-based” approach. Such an approach has the advantage of being easy to follow and intuitive, and as a quick tool to create fun conversation, it’s nice. However, it’s not very useful for purposes of projection for many reasons – not the least of which being that the points used are arbitrary and the statistics used are result statistics (hits, HRs, RBIs, etc) rather than being process-driven. It’s also intended to work on a player’s entire career. Some players have one or more drastic shifts in results over the course of their careers – and, to project a player in 2015 from his work in 2013-2014, we need to isolate data by season.

With the mountains of granular data available since Similarity Scores were first published, I thought it would be interesting to take a cut at creating something new in the same vein. My primary objectives were to create a similarity metric that (a) compared individual seasons rather than entire careers; (b) was based primarily on a hitter’s “process” or approach at the plate rather than strictly on results which are influenced heavily by luck; and (c) was mathematically defensible, in other words, non-arbitrary.

Read the rest of this entry »


Pitch Grades vs. Relative Pitch Grades

When deciding on the grade for a pitcher’s breaking pitch, a scout relies on the pitch’s velocity and movement (although command can be factored in as well).  These factors are combined into a single number on a scale from 20-80, with major league average as a 50 and a standard deviation recorded at 10.

Clayton Kershaw’s curveball has long been regarded as one of the best in the business, yet by my systematic calculation factoring in velocity, horizontal movement, and vertical movement, his curveball rated among the bottom third of curveballs.  Its below-average velocity and below-average horizontal movement held it back despite its above-average vertical movement.  While I was pondering this conundrum, I remembered another fact–Kershaw’s fastball happens to have a lot of rise.  What if movement was recorded by the difference between the pitcher’s fastball movement and the breaking ball movement instead of the breaking ball’s movement compared to an arbitrary point?  I was about to find out.

(This paragraph is solely methodology, so skip it if you wish.)  Using Baseball Prospectus’ excellent pitch f/x leaderboard, I selected all pitchers who threw at least 200 four-seam fastballs and at least 100 curveballs in 2014.  A breaking pitch’s horizontal and vertical movement was recorded as the difference between the pitch’s raw movement and the pitcher’s four-seam fastball’s movement.  I calculated the z-scores for the curveball’s velocity and the z score for the combination of the z scores of the curveball’s relative movements.  (I gave a 150% weight to vertical movement over horizontal movement).  Then, I combined the z scores of the velocity and combined relative movement to calculate a relative pitch score.  (I gave a 150% weight to combined relative movement over velocity).  Finally, I calculated a scouting grade on the 20-80 scale based off the relative pitch score.  Below is a table showing my results.

While I may not have solved the difference of evaluation among Kershaw’s curveball, the relative scouting grade at least opens discussion on how movement and velocity of pitches should be evaluated.  Is it better for a breaking pitch to be faster, or is it better to create a wider difference in velocity between the fastball and breaking ball?  Is it better for a pitcher’s breaking ball movement to be as different from the fastball as possible, or do some similarities create greater deception because a hitter can’t recognize the pitch earlier?

Player CU Vel CU H Mov CU V Mov Rel SG Unadj SG
Garrett Richards 79.68 5.85 -12.33 76.26 71.63
Sonny Gray 82.45 9.21 -5.44 76.09 67.11
Justin Grimm 81.63 7.15 -6.92 72.63 64.67
Blaine Hardy 78.62 1.55 -9.74 71.28 53
Adam Wainwright 75.37 9.34 -9.23 69.59 60.71
John Axford 78.77 4.37 -9.81 69.07 59.61
Carlos Torres 79.9 6.43 -9.09 68.1 64.79
Robbie Erlin 74.28 0.81 -10.64 68.01 43.53
Felix Hernandez 80.97 7.25 -8.16 67.84 66.62
Yu Darvish 78.16 8.5 -7.46 67.83 60.8
Yordano Ventura 83.76 2.28 -5.63 65.12 55.81
Clay Buchholz 78.25 8.88 -7.36 64.52 61.56
Brandon Workman 77.09 4.68 -9.35 64.24 55.08
Tyler Skaggs 77.58 6.64 -8.92 63.97 59.31
Jake Arrieta 80.12 5.81 -9.46 63.55 64.97
Juan Gutierrez 81.1 6.16 -6.77 62.94 60.89
Kevin Jepsen 84.52 3.9 -6.89 62.68 64.44
James Paxton 82.54 0.39 -2.69 62.49 41.05
Chris Tillman 76.22 3.31 -10.43 62.3 52.94
Craig Kimbrel 86.3 4.84 -5.95 62.14 68.18
Adam Warren 81.94 4.9 -6.62 61.45 59.77
Dellin Betances 83.85 7.04 -3.79 61.29 61.37
Edinson Volquez 80.67 5.95 -7.3 60.89 60.83
Wade Davis 85.56 3.29 -4.69 60.28 59.75
Tom Wilhelmsen 78.85 6.01 -7.58 60.26 57.4
Trevor May 77.76 7.56 -6.23 59.46 54.56
Cody Allen 86.88 5.09 -3.71 59.12 64.13
Tyler Thornburg 78.45 2.83 -7.21 59.01 48.63
Casey Janssen 74.81 9.84 -5.38 58.98 50.23
Trevor Bauer 79.18 5.17 -8.33 58.51 58.36
Brad Peacock 77.37 5.91 -7.39 57.85 53.18
Brett Oberholtzer 79.73 1.73 -3.22 57.83 38.69
Cole Hamels 79.01 3.23 -6.2 57.81 48.13
Josh Tomlin 76.76 4.39 -7.46 56.34 48.65
Drew Pomeranz 81.77 4.9 -7.41 56.24 61.47
Gio Gonzalez 78.4 5.35 -8.64 56.18 57.73
Andre Rienzo 79.26 6.3 -6.52 55.97 56.17
Scott Atchison 80.83 4.81 -8.52 55.78 62
Scott Kazmir 77.03 0.12 -3.35 55.77 29.19
Ian Kennedy 78.23 6.26 -9.1 55.71 60.51
Nick Tepesch 78.82 5.36 -8 55.71 57.04
Cory Rasmus 76.65 5.44 -7.84 55.67 51.66
Tom Koehler 79.92 5.1 -8.64 55.42 60.79
Marco Estrada 77.92 4.66 -6.27 55.31 48.81
Mike Fiers 72.93 3.7 -11.31 55.29 48.33
Odrisamer Despaigne 76.43 8.24 -7.25 55.08 55.59
Francisco Rodriguez 76.96 7.14 -6.73 54.97 53.1
Anthony Ranaudo 78.16 4.35 -7.93 54.82 53.13
Stephen Strasburg 80.69 7.59 -7.28 54.74 64.35
Mike Minor 81.66 0.98 -3.82 54.69 43.24
Yovani Gallardo 79.95 4.01 -6.75 54.68 53.49
Jeremy Hellickson 76.7 7.51 -9.53 54.53 60.71
Justin Verlander 79.98 4.97 -6.45 54.29 54.83
Dillon Gee 74.91 8.15 -7.75 54.19 53.13
J.A. Happ 78.27 2.13 -4.71 53.89 40.06
Kevin Quackenbush 77.17 5.05 -7.88 53.7 52.15
Roenis Elias 79.81 7.16 -6.09 53.3 58.18
Marcus Stroman 83.34 8.96 -2.3 53.27 60.33
Jason Vargas 75.68 1.63 -5.08 53.05 33.84
Clayton Kershaw 74.61 2.35 -8.93 52.85 43.08
Collin McHugh 73.68 8.26 -9 52.55 53.77
David Phelps 80.72 2.7 -5.06 52.51 48.01
Tommy Hunter 83.55 6.01 -3.14 52.48 56.72
Wesley Wright 79.8 3.86 -4.65 52.48 47.24
Miles Mikolas 75.4 6.22 -9.7 52.36 55.32
Javy Guerra 77.99 3.47 -7.42 52.2 49.48
Jason Hammel 77.19 6.3 -7.76 52.1 54.57
Vic Black 82.68 3.57 -3.91 51.95 51.46
Phil Coke 80.48 0.98 -3.37 51.9 39.25
Nick Martinez 76.92 3.84 -8.05 51.86 49.41
Jordan Zimmermann 79.71 5.65 -6.73 51.77 56.4
Phil Hughes 77.22 6.62 -7.84 51.53 55.54
Zack Greinke 72.88 6.58 -7.08 51.41 43.17
Colby Lewis 77.7 6.12 -5.81 50.97 50.21
Joe Kelly 79.88 6.94 -8.44 50.7 64.12
David Price 80.37 2.84 -1.58 50.68 38.24
Tim Lincecum 75.63 3.81 -8.37 50.62 47.15
Junichi Tazawa 76.12 6.87 -8.14 50.61 54.27
Matt Garza 75.25 4.66 -8.62 50.4 48.74
Jake Peavy 80.56 2.49 -1.91 50.39 38.81
Joba Chamberlain 79.74 5.1 -6.03 50.25 53.43
John Lackey 79.16 5.54 -5.39 50.13 51.3
Grant Balfour 82.74 2.44 -1.31 50.07 42.27
Wei-Yin Chen 74.9 3.11 -6 50 37.62
Danny Duffy 78.22 3.8 -6.76 49.95 48.98
Michael Wacha 75.4 4.99 -6.15 49.88 43.24
Zack Wheeler 79.61 6.2 -8.2 49.75 61.25
Anthony Varvaro 80.73 4.14 -5.43 49.68 52.11
Shelby Miller 77.76 7.65 -5.21 49.51 52.05
Edwin Jackson 79.94 1.31 -3.97 49.41 40.28
Miguel Gonzalez 77.47 5.77 -6.3 49.39 50.22
Anibal Sanchez 79.85 3.27 -3.53 49.35 43.11
Jesse Hahn 74.64 8.63 -8.05 49.33 54.32
Brandon McCarthy 82.24 5.96 -4.24 49 56.44
Mat Latos 76.95 3.64 -4.84 48.99 40.53
Tanner Roark 74.25 6.13 -9.04 48.69 50.65
Vance Worley 77.87 6.06 -5.44 48.53 49.5
J.J. Hoover 75.78 6.82 -6.21 48.49 48.24
Jose Fernandez 83.56 8.96 -1.82 48.41 59.58
Felix Doubront 75.43 2.87 -8.77 48.33 45.72
Jordan Lyles 81.77 2.16 -3.92 48.31 46.3
Santiago Casilla 82.01 4.48 -5.46 48.18 55.95
Kevin Correia 79.47 6.02 -3.46 48.15 47.94
Erik Bedard 74.86 4.96 -6.51 48.07 42.86
James Shields 80.39 3.11 -4.08 47.79 45.51
Gerrit Cole 84.65 6.34 -3.47 47.79 60.91
Chase Anderson 77.79 4.59 -7.32 47.24 51.15
Rick Porcello 78.15 7.45 -5.93 46.98 54.45
Travis Wood 72.92 1.78 -6.47 46.64 31.32
Samuel Deduno 81.59 6 -5.39 46.63 58.04
Johnny Cueto 81.53 2.02 -1.73 45.52 39.62
David Buchanan 77.95 4.31 -8.22 45.48 53.31
Ian Krol 79.05 5.17 -4.38 45.11 47.56
Erasmo Ramirez 80.4 3.22 -1.79 45.05 39.68
Charlie Morton 78.99 9.72 -7.1 45.02 64.43
Matt Cain 78.2 7.49 -5.26 44.99 52.88
Jose Quintana 80.94 2.22 -2.39 44.96 40.41
A.J. Burnett 82.4 4.23 -5.31 44.89 55.94
Vidal Nuno 77.29 4.84 -5.16 44.68 44.76
Daisuke Matsuzaka 75.37 8.38 -6.13 44.63 50.41
Hector Noesi 81.07 5.54 -4.12 44.59 52.45
Jake Odorizzi 70.24 4.97 -8.77 44.52 37.95
Joel Peralta 78.14 5.41 -3.91 44.15 44.68
Joe Nathan 82.63 2.69 -1.83 43.9 43.93
Carlos Carrasco 81.71 6.55 -5.33 43.55 59.35
Josh Beckett 73.88 7.73 -7.83 43.33 50
Fernando Salas 83.76 1.47 1.74 43.17 34.49
Lance Lynn 80.15 4.98 -5.79 43.07 53.5
Jered Weaver 69.96 6.47 -3.84 42.49 27.42
Will Smith 79.06 4.48 -4.32 41.86 45.94
Hector Santiago 77.64 3.59 -0.53 41.31 30.6
Jorge De La Rosa 74.81 4.56 -6.26 41.19 41.21
Hyun-jin Ryu 73.1 5.04 -7.88 41.17 42.5
Matt Shoemaker 76.24 6.77 -1.78 41.06 37.45
Fernando Abad 78.63 4.08 -4.74 40.75 45.18
Ryan Vogelsong 77.55 2.32 -4.13 40.71 37.22
Nathan Eovaldi 76.8 7.12 -7.37 40.45 54.37
Jon Niese 74.5 2.71 -5.81 39.94 35.31
Dan Haren 77.88 3.67 -3.65 39.66 39.63
Brad Hand 80.04 5.66 -2.5 39.15 45.96
Franklin Morales 74.71 5.81 -5.22 38.68 40.9
Alfredo Simon 78.2 5.32 -4.82 38.35 47.04
Eric Stults 68.63 1.8 -5.12 37.89 17.63
Madison Bumgarner 77.56 5.55 -4.39 37.85 44.88
Yusmeiro Petit 77.55 7.25 1.56 37.82 32.71
Jeremy Guthrie 76.14 4.86 -3.22 37.74 36.93
Masahiro Tanaka 74.41 5.28 -6.35 37.48 42.06
Gavin Floyd 81.7 5.13 -3.23 37.24 50.69
Aaron Harang 74.67 2.85 -4.36 36.79 32.16
Jacob deGrom 80.26 4.49 -1.82 36.32 42.16
Jon Lester 75.95 4.82 -4.15 36.25 38.87
Homer Bailey 80.44 5.72 -2.91 36.13 48.13
Jose Veras 76.8 10.11 -5.62 35.11 56.15
Jerry Blevins 74.84 6.77 -4.32 35.1 40.88
Drew Smyly 78.4 3.38 -0.21 34.68 31.1
C.J. Wilson 77.18 5.52 -4.61 34.67 44.5
John Danks 74.15 2.51 -1.84 34.63 23.5
Julio Teheran 74.02 6.32 -4.89 34.54 39.49
Jacob Turner 79.14 3.29 -2.46 34.4 38.63
Tommy Milone 75.46 4.13 -2.38 34.24 31.52
Tim Hudson 76.14 8.32 -4.29 33.02 47.21
Max Scherzer 78.2 5.92 -2.31 32.64 41.66
Hiroki Kuroda 77.15 4.58 -2.65 31.98 37.2
Paul Maholm 72.76 5.41 -5.55 29.91 36.31
Carlos Villanueva 76.58 4.05 -1.53 29.9 31.74
Scott Carroll 77.43 7.38 -2.75 25.13 44.15
Mark Buehrle 72.16 3.91 -3.74 23.02 26.85


Does Seeing More Pitches Lead to More Runs?

There are many notions or perceived notions in baseball that are commonly false. For example, pundits throughout time have often suggested that a good hitter provides protection for another good hitter. Studies have been done on this and it is false. Another commonly stated notion, is that seeing a lot of pitches is a good thing. This notion is not only stated by former players, making constant sets of statements based on no evidence or facts, or by TV broadcasters who use a never-ending array of cliché lines, but also by smart sabermetricians.

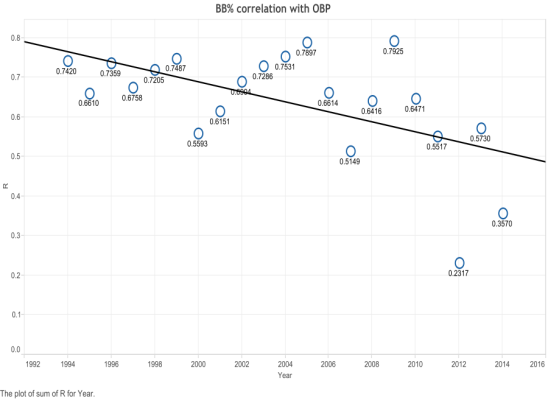
But is this notion true? Does seeing more pitches really lead to more runs? First and foremost, I want to thank Owen Watson, who on September 30th 2014, came out with an article for The Hardball Times displaying that there is a correlation between seeing pitches and drawing walks (you can find his article here). This is basically where I got the idea for this study. The study was well done, however, I don’t think it was asking the right question. While yes, there is a correlation between seeing pitches and walks, and walks are good, this doesn’t necessarily mean that seeing more pitches leads to more runs or that seeing more pitches is necessarily a good thing. There are other factors that one must consider in order to be able to come to this conclusion (Watson’s article was on pitching efficiency, and I want to make it clear that I’m only focusing on this specific aspect of the article).

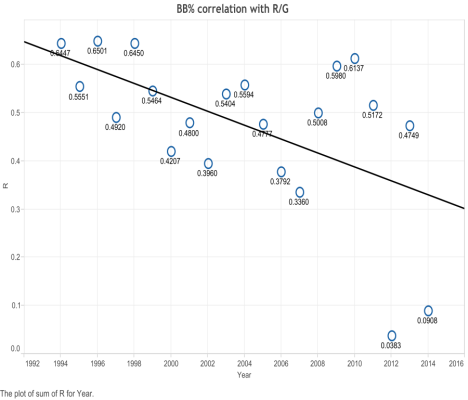
For example, the Red Sox in 2014 saw a lot of pitches yet they weren’t one of the top teams when it came to run scoring. Also, the Royals went all the way to the finals last year, and they don’t exactly see a lot of pitches. In fact they’re famous for having a bunch of free swingers on the team. Finally, while getting into deep counts leads to more walks, it’s also very possible that it will lead to more strikeouts. This is what made me question whether seeing more pitches is a good thing. While Watson’s study looked at the correlation between walks and pitches per plate appearance,  it ignored several other factors that could contribute to seeing a lot of pitches being counterproductive.

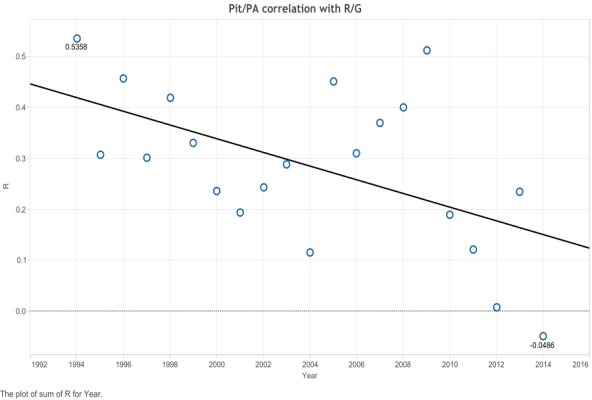
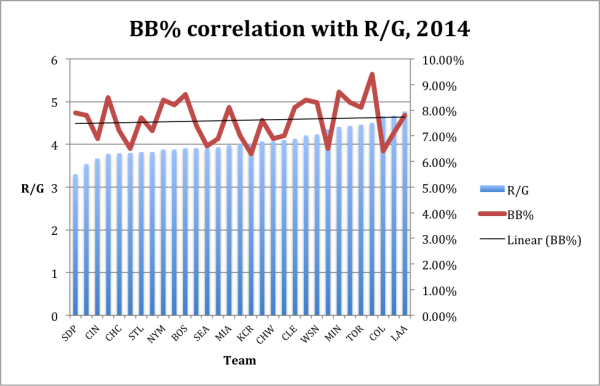
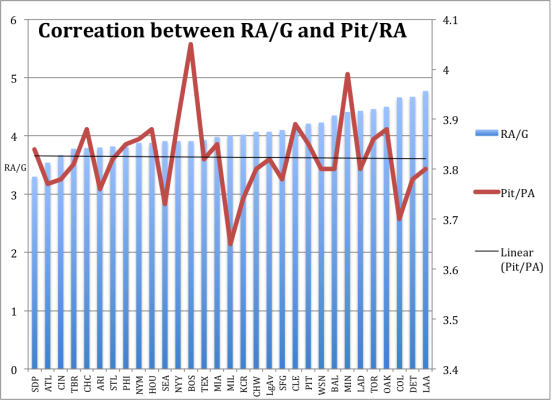
Ok, now let’s get to the fun stuff. The way I constructed this study was rather simple and I basically used the same model Watson did for his study, I just changed the BB% to R/G (runs per game). Below is a chart that examines the correlation between Pit/PA (pitches per plate appearance) and R/G (runs per game) for every team, for the 2014 season. The X-axis represents the teams. Then you will notice two data points on the Y-axis — the blue represents R/G, and the red represents Pit/PA. Oh and if you don’t know what LgA is on the X-axis, that’s the league average.

123

So there it is. As you might be able to tell there is no real correlation between pitches seen and runs scored. The correlation coefficient, by the way, is R = -0.0486. If you are unfamiliar with correlation coefficients, all you really need to understand is a correlation coefficient of 0 displays no real correlation between the data. The correlation here is slightly negative but it’s too small or too close to zero to really be interpreted as a negative correlation.

You might, at this point, find this data hard to believe. Well, I would ask you to consider this; strikeouts as I’ve already mentioned, and can’t keep mentioning enough, are at an all-time high. Going deeper into counts therefore puts one at a higher risk of getting struck out. This may be one of the explanations for the data above. Also, seeing more pitches means you are wearing the starting pitcher out, meaning you are far more likely to face the bullpen. This is not necessarily a good thing! Bullpen pitchers are better than ever. Facing the bullpen, in today’s game, may actually be counterproductive.

Now let’s consider one final element. This study is not perfect and has a few flaws. Most notably, it only takes into account 2014. This after all may have just been a blip on the radar. I will therefore be looking at more of this data to truly examine whether this data is 100% accurate. I will also take a look at the correlation between pitches seen and K% to get a better and further understanding of whether it is beneficial to see a lot of pitches. I just thought that this data point was simply too interesting not to be shared especially as we head into a new season of baseball. Hopefully this will allow people to be more critical when they are watching the game and listening to pundits speak on TV. Remember, just because someone says something doesn’t mean it is true.

Thanks to Owen Watson for doing his study in The Hardball Times; he now writes for FanGraphs. The data was also all found at Baseball Reference.


The Most Signature Pitch of 2014

If you were feeling charitable, you could say this post owes a lot to Jeff Sullivan’s recent set of articles examining pitch comps. If you weren’t feeling charitable, you could say this post is a shameless appropriation of his ideas. Either way, you should read those articles! They were very good, and very entertaining, and directly inspired this post. There were seven, in total: here, here, here, here, here, here, and here. I’ll wait.

Back? Good! In the comments of the third article, someone asked Jeff about finding the “most signature” pitch, or the pitch with the worst/fewest comps. Jeff said: “Wouldn’t be surprised if it was Dickey or the Chapman fastball. That math… I’m afraid of that math, but I might make an attempt.” Jeff has looked at unique pitches twice (Carlos Carrasco’s changeup and Odrisamer Despaigne’s changeup, the last two articles linked above), but I wanted to attack the question in a less ad-hoc fashion, looking at all pitches rather than singling some out.

Jeff wasn’t wrong, though – the math is not simple. His methodology doesn’t really work here for a couple reasons. First of all, I’m looking for uniqueness rather than similarity. I could just flip Jeff’s method around and look for high comp scores, like what he did for the Carrasco/Despaigne changeups, but I also want to consider all pitch types. Again, Jeff sort of did this in the Despaigne article, by comparing his changeup to a few different pitch types, but that is not really feasible for every pitch thrown.

What this means is that a new method is needed to directly calculate dissimilarity. We could find the maximum distances from the mean (basically Jeff’s method), which would work for a single pitch type: if all the pitches are clustered together, with similar velocities and breaks, calculating the distance from the mean to find the weirdest pitch makes sense. But consider this hypothetical set of pitches, graphed on two axes for simplicity:

hypothetical pitches

Obviously, the pitch that corresponds to the red point is the sort of thing we’d like to identify as unique. It’s also exactly at the center of that dataset, and would show up as the least unique pitch, if distance from the mean was used to determine uniqueness. Luckily, there’s an algorithm that is designed to find outliers in a more rigorous way.

This is where the math gets scary. The algorithm is called Local Outlier Factor analysis, which identifies outliers in a dataset based on the density of data around that point as compared to its neighbors. In this context, the density around a point is a function of how similar the best comps are for each pitch. Each point gets a score, where anything near 1 indicates normal, and higher values indicate greater isolation. I’m not going to go into detail, but if anyone wants to learn more, feel free to ask in the comments, or just Google it. It’s fairly simple to run it on all pitches, with the relevant variables of velocity, horizontal break, and vertical break.

Any pitch thrown more than 100 times in 2014 was included, and righties and lefties were considered separately (since pitches that move the same way obviously are very different based on what side of the rubber they come from). But enough about methodology! Here are the top five most signature pitches, for righties and lefties, along with their LOF scores, followed by some gratuitous gifs.

RIGHTHANDERS

Name Pitch Velocity H.Mov V.Mov Outlier Score
R.A. Dickey Knuckleball 76.6 0.2 1.6 2.26
Mike Morin Change 73.7 2.0 5.7 2.16
Steven Wright Knuckleball 74.2 0.7 0.3 2.13
David Hale Fourseam 91.9 4.2 5.8 2.04
Pat Neshek Change 70.9 7.0 3.5 1.00

LEFTHANDERS

Name Pitch Velocity H.Mov V.Mov Outlier Score
Aroldis Chapman Fourseam 101.2 3.7 11.1 2.53
Erik Bedard Slider 73.6 2.0 4.1 2.19
Sean Marshall Curve 74.4 9.5 -6.7 1.91
Dan Jennings Fourseam 93.6 4.9 5.8 1.86
Zach Britton Sinker 96.2 8.6 4.7 1.85


Chapman fastball

It’s nice when things work exactly like you expect them to. The top pitches on the two lists are incredible, and incredibly unique, and while it’s not a surprise to see them here, it does provide some reassurance that this measure is doing what it’s supposed to. Everyone knows about Dickey’s knuckleball, and if anything, it’s underrated by this measure. Since it moves so randomly, the knuckle’s season averages end up being slow and pretty much neutral horizontally and vertically. While that’s enough to make them show up as very odd under this measure, the individual pitches don’t often follow that straight trajectory, as seen in the above gif. The same can be said for Steven Wright’s knuckleball in third, but it’s nice that this measure still picks them out as unique pitches.

As for Chapman, there’s not that much to say about his fastball that hasn’t already been said. It feels wrong in some way to call his fastball strange, since it is disturbingly direct in practice, but there was truly no pitch like it in 2014. The velocity is the carrying factor behind the massive outlier score, almost a full 2 MPH greater than the next fastest pitch. Interestingly, Chapman’s pitch was the only one in either top five with notably high velocity.

Looking at the weirdest pitches in baseball, what can we conclude about them as a group? First, the pitchers throwing them are generally not bad. While you’d expect someone to be at least halfway decent to get in the position to throw 100 pitches of a single type, the owners of these pitches averaged about 1 WAR in 2014. With eight of these 10 throwing primarily in relief, and having only 710.2 innings collectively, that comes out to a very respectable 2.4 WAR/200.

The pitches themselves varied in usage, from Neshek’s change, thrown 13.4% of the time, to Britton’s sinker, thrown 89.3% of the time. They also varied in effectiveness, as measured by run values, from Neshek’s 3.6/100 to Marshall’s -1.63/100. Overall, the best pitch is probably Chapman’s fastball, followed by Britton’s sinker, given both the results on those pitches and how often they use them, but as a group, these pitches are pretty good. Maybe that isn’t totally surprising, but weird does not necessarily equal effective. Any pitcher could immediately have the weirdest pitch in baseball, if he threw 40 MPH meatballs, but less absurdly, mix and control matter just as much as the movement of the pitch.

Finally, all this stuff tracks fairly well with what Jeff identified previously. Obviously, he called Dickey and Chapman, but he also wrote this article about how Zach Britton’s sinker is pretty much comp-less, and we see that very pitch in fifth for lefthanders. Odrisamer Despaigne’s change was 12th for righthanders. Interestingly, Carrasco’s change is 98th on that same list, indicating this method doesn’t think he’s incredibly unique. Overall, this was mostly just a fun exercise, but maybe there’s more to this list, so if you want to poke around, it’s in a public Google Doc here. And like I said, if you have any questions about the methodology or anything like that, I’d be glad to answer them in the comments.


Hardball Retrospective – The “Original” 1980 Kansas City Royals

In “Hardball Retrospective: Evaluating Scouting and Development Outcomes for the Modern-Era Franchises”, I placed every ballplayer in the modern era (from 1901-present) on their original team. Consequently, Babe Ruth is listed on the Red Sox roster for the duration of his career while the Orioles claim Eddie Murray and the Cubs declare Lou Brock. I calculated revised standings for every season based entirely on the performance of each team’s “original” players. I discuss every team’s “original” players and seasons at length along with organizational performance with respect to the Amateur Draft (or First-Year Player Draft), amateur free agent signings and other methods of player acquisition.  Season standings, WAR and Win Shares totals for the “original” teams are compared against the “actual” team results to assess each franchise’s scouting, development and general management skills.

Expanding on my research for the book, the following series of articles will reveal the finest single-season rosters for every Major League organization based on overall rankings in OWAR and OWS along with the general managers and scouting directors that constructed the teams. “Hardball Retrospective” is available in digital format on Amazon, Barnes and Noble, GooglePlay, iTunes and KoboBooks. Additional information and a discussion forum are available at TuataraSoftware.com.

Terminology

OWAR – Wins Above Replacement for players on “original” teams

OWS – Win Shares for players on “original” teams

OPW% – Pythagorean Won-Loss record for the “original” teams

Assessment

The 1980 Kansas City Royals         OWAR: 42.6     OWS: 272     OPW%: .596

GM Cedric Tallis acquired two-thirds of the ballplayers on the 1980 Royals roster. The organization selected 24 of the 33 players during the Amateur Draft. Based on the revised standings the “Original” 1980 Royals amassed 97 victories and captured the American League pennant by a five-game margin over the Oakland Athletics.

George Brett was batting .337 when he returned to the lineup on July 10 following a month-long absence. “Mullet” went on an absolute tear, collecting 71 hits in 150 at-bats (.473 BA) and driving in 47 runs to boost his average to .401 on August 17. Brett hovered around the elusive .400 mark into the middle of September 1980 before settling for a .390 BA. In addition to securing his second batting title, he recorded personal-bests in RBI (118), OBP (.454) and SLG (.664) while collecting the American League MVP Award. Brett was selected to 13 consecutive All-Star contests (1976-1988), registered 3154 base hits and supplied a .305 career BA.

Fleet-footed left fielder Willie Wilson paced the Junior Circuit with 230 base knocks, 133 runs scored and 15 triples. He earned the Gold Glove Award, manufactured a .326 BA and nabbed 79 bags in 89 attempts after swiping 83 in the previous year. John “Duke” Wathan (.305/6/58) pilfered 17 bases and established a career-high in batting average while shortstop U.L. Washington contributed 11 three-baggers and stole 20 bases.

Outfield chores were handled by Wilson, Ruppert Jones, Clint Hurdle and Al Cowens. Jones backed the club’s baserunning endeavors with 18 stolen bases but otherwise yielded substandard output compared to the 21 home runs and 33 steals from his ’79 campaign. Cowens (.268/6/59) provided further proof that his runner-up finish in the 1977 AL MVP race was an outlier. Hurdle (.294/10/60) drilled 31 doubles and registered personal-bests in virtually every offensive category.

Slick-fielding second baseman Frank “Smooth” White collected six consecutive Gold Glove Awards from 1977-1982 while Rodney “Cool Breeze” Scott purloined 63 bases and legged out 13 three-base hits. Luis Salazar solidified the bench with a .337 BA following his mid-August promotion.

Brett placed second behind Mike Schmidt in “The New Bill James Historical Baseball Abstract” for the best third baseman of All-Time. White (31st) and Wilson (54th) finished in the top 100 at their positions while Dan Quisenberry placed sixty-eighth among pitchers. 

LINEUP POS WAR WS
Willie Wilson LF 7.86 31.52
Frank White 2B -0.08 12.93
George Brett 3B 8.36 36.2
Clint Hurdle RF 1.77 14.01
Al Cowens DH/RF -0.76 10.67
Ruppert Jones CF 0.84 7.2
John Wathan C 2.39 16.49
Ken Phelps 1B -0.06 0.01
U. L. Washington SS 2.1 16.13
BENCH POS WAR WS
Luis Salazar 3B 1.11 7.11
Rodney Scott 2B 0.36 13.18
Jim Wohlford LF 0.36 4.92
Jamie Quirk 3B 0.06 3.47
German Barranca 0 0
Onix Concepcion SS -0.18 0.05
Jeff Cox 2B -0.78 1.32

Dennis Leonard eclipsed the 20-win plateau for the third time in four seasons. Pacing the circuit with 38 starts, Leonard also served up the most gopher balls (30) and earned runs (118) in the American League. Rich Gale (13-9, 3.92), Renie Martin (10-10, 4.39) and Paul Splittorff (14-11, 4.05) provided adequate support in the starting rotation.

The back-end of the bullpen pitched “lights-out” ball for the Royal Blue crew. Dan Quisenberry perplexed the opposition with his unorthodox delivery. “Quiz” tallied 12 victories and topped the leader boards with 33 saves and 75 appearances. Rookie right-hander Doug Corbett (8-6, 1.98) saved 23 contests and finished third in the 1980 AL Rookie of the Year vote. Greg “Moon-Man” Minton added 19 saves and fashioned a 2.46 ERA while Aurelio “Señor Smoke” recorded 13 wins in relief.

ROTATION POS WAR WS
Dennis Leonard SP 3.28 17.1
Rich Gale SP 1.78 10.92
Paul Splittorff SP 1.48 10.31
Renie Martin SP -0.72 5.03
Steve Busby SP -0.61 0
BULLPEN POS WAR WS
Doug Corbett RP 5.8 23.88
Dan Quisenberry RP 2.38 19.09
Greg Minton RP 1.5 12.69
Bob McClure RP 1.42 7.9
Bobby Castillo RP 1.19 9.72
Doug Bird RP 0.82 4.89
Aurelio Lopez RP 0.79 12.85
Mark Souza RP -0.27 0
Craig Chamberlain RP -0.35 0
Mike C. Jones SP -0.41 0
Jeff Twitty RP -0.61 0.06
Mark Littell RP -0.67 0

 The “Original” 1980 Kansas City Royals roster

NAME POS WAR WS General Manager Scouting Director
George Brett 3B 8.36 36.2 Cedric Tallis Lou Gorman
Willie Wilson LF 7.86 31.52 Cedric Tallis Lou Gorman
Doug Corbett RP 5.8 23.88 Cedric Tallis Lou Gorman
Dennis Leonard SP 3.28 17.1 Cedric Tallis Lou Gorman
John Wathan C 2.39 16.49 Cedric Tallis Lou Gorman
Dan Quisenberry RP 2.38 19.09 Joe Burke Lou Gorman
U. L. Washington SS 2.1 16.13 Cedric Tallis Lou Gorman
Rich Gale SP 1.78 10.92 Joe Burke Lou Gorman
Clint Hurdle RF 1.77 14.01 Joe Burke Lou Gorman
Greg Minton RP 1.5 12.69 Cedric Tallis Lou Gorman
Paul Splittorff SP 1.48 10.31 Cedric Tallis Charlie Metro
Bob McClure RP 1.42 7.9 Cedric Tallis Lou Gorman
Bobby Castillo RP 1.19 9.72 Cedric Tallis Lou Gorman
Luis Salazar 3B 1.11 7.11 Cedric Tallis Lou Gorman
Ruppert Jones CF 0.84 7.2 Cedric Tallis Lou Gorman
Doug Bird RP 0.82 4.89 Cedric Tallis Charlie Metro
Aurelio Lopez RP 0.79 12.85 Joe Burke Lou Gorman
Jim Wohlford LF 0.36 4.92 Cedric Tallis Lou Gorman
Rodney Scott 2B 0.36 13.18 Cedric Tallis Lou Gorman
Jamie Quirk 3B 0.06 3.47 Cedric Tallis Lou Gorman
German Barranca 0 0 Joe Burke Lou Gorman
Ken Phelps 1B -0.06 0.01 Joe Burke
Frank White 2B -0.08 12.93 Cedric Tallis Lou Gorman
Onix Concepcion SS -0.18 0.05 Joe Burke
Mark Souza RP -0.27 0 Cedric Tallis Lou Gorman
Craig Chamberlain RP -0.35 0 Joe Burke John Schuerholz
Mike Jones SP -0.41 0 Joe Burke John Schuerholz
Steve Busby SP -0.61 0 Cedric Tallis Lou Gorman
Jeff Twitty RP -0.61 0.06 Joe Burke John Schuerholz
Mark Littell RP -0.67 0 Cedric Tallis Lou Gorman
Renie Martin SP -0.72 5.03 Joe Burke John Schuerholz
Al Cowens RF -0.76 10.67 Cedric Tallis Charlie Metro
Jeff Cox 2B -0.78 1.32 Cedric Tallis Lou Gorman

Honorable Mention

The “Original” 2009 Royals                OWAR: 45.7     OWS: 268     OPW%: .544

Zack Greinke (16-8, 2.16) claimed the 2009 AL Cy Young Award while pacing the League in ERA and WHIP (1.073). Carlos Beltran furnished a .325 BA despite missing all of July and August due to injury. Johnny Damon (.282/24/82) slashed 36 two-base hits and scored 107 runs. Billy “Country Breakfast” Butler clubbed 51 doubles and launched 21 long balls while batting .301.

On Deck

The “Original” 2012 Rays

References and Resources

Baseball America – Executive Database

Baseball-Reference

James, Bill. The New Bill James Historical Baseball Abstract. New York, NY.: The Free Press, 2001. Print.

James, Bill, with Jim Henzler. Win Shares. Morton Grove, Ill.: STATS, 2002. Print.

Retrosheet – Transactions Database – Transaction a – Executive

Seamheads – Baseball Gauge

Sean Lahman Baseball Archive


Not Another Wilmer Flores Defense Post

It looks like the New York Mets are going to be entering the season with Wilmer Flores as their shortstop.  Flores has become a polarizing figure among Mets fans for a myriad of reasons, most notably of which would be his defensive capabilities at the position.  Scouts have long held that Flores is not a capable shortstop; however his defensive metrics were pretty good last year!  That being said we know a sample size of one season of defensive metrics is prone to a lot of statistical noise.  And THAT being said we know that Flores played just 443.1 innings at shortstop last season.  Uh oh.  What exactly can we take from that sample size?  How much weight should we place on these defensive metrics for Mr.Flores?

Are the scouts right?  Are the metrics right?  Or is the answer somewhere in between?  (Almost definitely.)

What follows is an exercise which will answer precisely zero of the above questions.  However, I cannot remember a situation quite like this Flores predicament, so I went on a quest (through FanGraphs) to find some comparables.  What shortstops have had the type of defensive metric success Flores has had in such a short sample size, and how have they fared outside of that season?

I looked at a sample of players from 2003-2014 who played from 400 to 500 innings at the position with a UZR/150 from 5 to 19 (Flores was at 12.5).  All these parameters are quite arbitrary, but this whole exercise is quite arbitrary so let’s move along.

This brings us a list of ten seasons excluding Flores.  The seasons are as follows:


2014    Jose Ramirez (498.2 Innings, 18.9 UZR/150)

2008    Marco Scutaro (472.1, 17.6)

2008    Maicer Izturis (448, 15.9)

2009    Robert Andino (478.1, 14.1)

2010    Jerry Hairston (489.2, 8.9)

2006    Alex Cora (434, 8.7)

2012    Paul Janish (450.1, 8.6)

2014    Stephen Drew (413.1, 8.1)

2012    John McDonald (426.1, 6.1)

2010    Wilson Valdez (458, 5.2)

What this list of players lacks, is a very poor fielding shortstop.  The lowest career shortstop UZR/150 of the bunch belongs to Mr. Izturis at -3.1 in 1697.1 innings.  This seems to be a list of humans in which you can confidently state “Hey!  None of these players were atrocious major-league defensive shortstops over their careers!”

So what does this mean in regards to Flores?  Basically, nothing.  However, Mets fans can now take solace in knowing that the 10 players (from the last 12 seasons), who had the most similar statistical defensive season to Flores’ 2014, had careers in which they were able to play the shortstop position not horribly.  Now, if Flores himself can play the shortstop position not horribly then the Mets might just have them a nice little player.

Then again, there is always this:


The Horrors of Jackie Bradley Jr.’s 2014 Season

Jackie Bradley Jr. is not a terrible baseball player, and honestly he probably didn’t have a terrible 2014 season. Well at least, it wasn’t as bad as what people perceived. That, however, is due to his impeccable fielding and good baserunning. What follows will include none of that. It is rather a complete and utter breakdown of Bradley’s hitting performance, for 2014, and the trends he displayed. They, as you might have guessed, are not pretty.

First, it seems important to mention that Bradley’s numbers were great in the minors. Not just fielding but hitting as well. After A ball (Greenville), Bradley never had a wRC+ below 120 and he never had a BB% lower than 10%. Now BB% is not always predictive, as Chris Mitchell has displayed through his KATOH metric. KATOH, however, does show that BB% is predictive in AA and AAA, and Bradley’s BB% was good in AA and AAA.

Now on to 2014. This was suppose to be Bradley’s big break, it was supposed to be his year, he was going to replace Jacoby Ellsbury in center, and become the next great Red Sox center fielder. None of that happened; Bradley did play good defense but his offense was atrocious, finishing with a 47 wRC+.

So what happened? How did a player lauded for not just his defense but also his hitting ability, finish the year with a 47 wRC+? First, let’s acknowledge that hitting is extremely difficult, especially at the major-league level. There are also many components that go into hitting and all of them have an impact on a why a hitter hits a certain way. It’s also important to look at how pitchers work a hitter, and I think that’s where will start. Below is a graph, of the hard, breaking, and off-speed pitches Bradley faced in 2014.

lql

From this, it’s pretty evident that pitchers predominantly attacked Bradley with fastballs. This was after all his first major league season, and pitchers will often test young hitters or rookies with fastballs. If the hitter starts to hit the fastball well, then typically a pitcher will make an adjustment. As you can see, no adjustments were made because no adjustments were needed.

Now that we know what pitchers were throwing at Bradley, lets look at what Bradley did with those pitches. The graph below will display the outcome of Bradley’s at-bats in 2014.

poppp

This is where my eyes started to hurt. Bradley, as you can see, got off to a good start, but everything fell off quickly after that. In fact, things fell apart so badly that Bradley didn’t get a single extra base hit in the last two months of the season. While I like this graph, in explaining Bradley’s struggles, I think the pie chart below will give you an even better example of just how bad Bradley was in 2014. The graph was provided by Baseball Savant.

iiiiii

There are many outcomes that can come from a pitch: a foul, a whiff, a called strike, a ball, a ball in play, and finally a hit. Bradley, got a hit considerably less often than any other outcome. This is not a recipe for success. Hold on, let me clarify that. The fact that Bradley’s hits were his most infrequent outcome was not the problem. Mike Trout’s most infrequent outcome after all was his hits. The problem was Bradley’s 4.6 hit%.

Another problem here is that Bradley was simply not putting the ball in play enough, and the balls in play, unfortunately, were not resulting in enough hits (.284 BABIP). This, however, is only one of the problems. To get a better understanding of why Bradley didn’t get enough hits, it seems imperative that we examine where Bradley was hitting the ball. For this, we’ll look at a spray chart provided by Brooks Baseball, to examine exactly where Bradley was hitting the ball, and if there are any consistent trends.

rrrrr
Here are the outcomes when Bradley put the ball in play. What is distinctively clear is that Bradley pulled the ball a lot, especially in the infield. He also doesn’t seem to have been hitting a lot of hard ground balls, which would explain his lack of hits in the infield. As you can see Bradley over a full season of baseball only mustered four hits in the infield and none the other way. The Red Sox have talked about working on Bradley’s swing, they’ve suggested that his swing is too uppercut-y and he needs to start swinging down on the baseball. From this chart it seems pretty evident why they want to do that. They probably want Bradley to be able to hit the ball the other way, not just in the air but also on the ground, as to maximize his ability to get hits.

While fixing a swing is important, it’s only one of the problems. There are more elements that go into hitting and someone doesn’t end up with a 47 wRC+ without some kind of approach problem. This is where we’ll take our final investigation, into Bradley’s plate approach and the tendencies he’s been displaying.

There are a few factors and components that can be attributed to a hitter’s approach. One of them is the hitter’s tendency to swing. The more one swings the less he is likely to be a patient hitter, and the less likely he is to have a good approach at the plate. Below is a graph of Bradley’s month-by-month swing percentage on hard, breaking, and off-speed pitches for 2014.

eeeeee

This as you might be able to tell is not good. Bradley’s tendency to swing got gradually worse as the year went on. This meaning that as the year went on Bradley either got further away from his approach or he simply got frustrated. Let’s not panic, however, just because a hitter has a high swing% doesn’t mean that he can’t be a successful hitter, especially if he makes contact on a lot of his swings. Vlad Guerrero was a great hitter and he swung at everything; he also hit everything. So let’s look at Bradley’s whiffs per swing (whiff/swing). Why? Well because if you’re swinging a lot, you don’t want to have a low whiff per swing rate because it means that most of the pitches you’re swinging at aren’t going to become hits. It also probably means you’re striking out a lot and that you’re chasing a lot of pitches.

ssssss

As you might be able to tell, Bradley in 2014 swung and missed a lot. I think it’s also important to note that in the last two months of the year, Bradley’s plate appearances were significantly reduced. He only got 35 plate appearances in August and only 36 in September. So while it might seem that in the last month, Bradley started swinging and missing less, that was in a very small sample size.

Finally, lets look at Bradley’s overall plate approach tendencies. What follows is a chart provided by Brooks Baseball that examines a players overall plate approach. It examines, through the use of PITCH f/x data his passiveness and his aggressiveness at the plate. It does this through the use of detection theory, which analyses the decisions one makes in face of uncertainty. There are essentially two parameters to detection theory, C and d’. C, which is the one used for this graph, reflects the strategy of the response. Ok, that’s enough on the subject.

tototot

Just like Bradley’s swing tendencies, his overall plate approach was going in the wrong direction. Throughout the year, Bradley had consistently gotten more and more aggressive. He’s essentially lost what made him a successful hitter in the minors. These are the signs that probably made the Red Sox sign Rusney Castillo from Cuba to a seven-year deal. It also might be a reason why the Red Sox are in serious talks with the Braves about a potential trade involving Bradley.

That being said, while it is certain that Bradley’s tendencies and approach were all heading in the wrong direction, this doesn’t mean that he can’t turn things around. Players make adjustments all the time, and I’m not sure that these stats are necessarily predictive of future performance. Baseball after all is a game of adjustments, pitchers make adjustments on hitters, and then the hitters counter with their own adjustments. It doesn’t seem that Bradley will ever be a great hitter or even a good hitter, but what he can be is a league-average hitter. I’ve spent a lot of time discussing Bradley’s offense and not nearly enough on his defense. Bradley is a great defensive center fielder, maybe the best, and that has real value. If Bradley can simply become an average hitter, he should have a spot in the majors for many years to come.

All graphs can be found on Brooks Baseball and the circle graph on Baseball Savant. A lot of the stats can also be found on FanGraphs.  


Delayed Overanalysis of Casey Janssen

The Nats signed reliever Casey Janssen, formerly of the Blue Jays, to a one-year, $5-million contract a few weeks ago (feel free to stop reading now to avoid the existential dread associated with over-analyzing Casey Janssen). Overall, it’s hard not to like this pick-up. One year and five million dollars is basically nothing (except when it comes to signing a second baseman), and the Clippard trade certainly left a hole in the bullpen. There was also a recent stretch of time when Janssen was quite good. From 2011-2013, Janssen averaged 57.1 IP, 8/9 strikeouts per 9 innings, and a sub 3 FIP. WAR isn’t the best way to measure relievers, but he averaged 1.2 WAR a season over those three years, which put him squarely in the pretty damn good category of relief pitchers.

So why did a recently good closer sign for a seemingly below market sum? Because 2014 was mostly terrible. Strikeouts were way down (5.5 Ks/9 in 2014 compared to 8.5 in 2013), Homers were way up (1.2 HR/9 in 2014 compared to 0.5 in 2013), and his groundball percentage dropped from 48% to 34%. These are all fairly alarming trends for a relief pitcher that is 33 and doesn’t throw very hard (2014 average fastball velocity: 89.3 miles per hour). Every analysis for relief pitchers should contain small sample size warnings in all capital letters, but important indicators trending that strongly generally indicate something wrong happening.

In July of last season, Janssen came down with a particularly awful bout of food poisoning, and he probably came back too quickly. And looking at the mid-season splits, there’s a case to be made that it was the (negative) turning point for the rest of Janssen’s season. Let’s compare:

1st half: 22 IP, 1.23 ERA, 0 HR, 14 Ks, 1 BB, .218 wOBA against
2nd half: 23.2 IP, 6.46 ERA, 6 HR, 14 Ks, 6 BBs, .378 wOBA against

In the first half, Janssen made opposing hitters look like Austin Kearns. In the second half, they all looked like Yasiel Puig. His numbers did take a nosedive in July when he was sick, but got worse in August when one would have expected him to be feeling better (or put on the DL to recuperate). It’s impossible for anyone to really know how he was feeling, and if food poisoning actually was the main cause of Janssen’s second-half struggles. But, his velocity didn’t change from the first half to the second half, and his strikeout rate remained about the same. The uptick in walks and home runs in the second half are troubling, but maybe first-half Janssen was a fluke based on a year over year decrease in velocity (lost about .8 MPH on his fastball from 2013 to 2014)  and a decrease in strikeouts. For comparisons sake, here is an unnamed reliever’s 1st and 2nd half splits in 2014:

1st half: 37 IP, .97 ERA, 1 HR, 36 Ks, 11 BBs, .208 wOBA against
2nd half: 25 IP, 6.48 ERA, 3 HR, 23 Ks, 8 BBs, .375 wOBA against

This reliever? Rafael Soriano. There wasn’t an injury narrative to fault for his falling off a cliff bad second half, but he stunk nonetheless. Screwy things can happen in small samples, which is why we try to avoid over-analyzing them. Janssen may have just had impeccable timing, and his new true talent level as a command relief pitcher is that of a 4.00 ERA. But unlike with Soriano, there is a realistic narrative for Janssen that fits the timeline of his struggles. Here’s another 1st half/2nd half comparison

1st half:

2nd half:

While his K rate was basically the same from the first half the second half, these charts show that his whiff rates weren’t. Janssen had much more success both down and up in the zone earlier in the season in terms of swings and misses, so while his velocity was the same between the first half and second half, it appears that his stuff wasn’t.

Again, in such small samples, it’s impossible to draw any definitive conclusions. It’s true that first-half Janssen looked pretty similar to 2011-2013 Casey Janssen, while second-half Janssen looked more like Brian Bruney. It’s reasonable to look at the splits and say that Janssen’s bout with food poisoning ruined what looked to be a promising season. It’s also reasonable to look at his decrease in velocity and strikeout rate and think this was money not well spent. But for a paltry (in the context of the MLB) five million dollars, it’s not that much money anyways, so why the hell not?