Does Seeing More Pitches Lead to More Runs?
There are many notions or perceived notions in baseball that are commonly false. For example, pundits throughout time have often suggested that a good hitter provides protection for another good hitter. Studies have been done on this and it is false. Another commonly stated notion, is that seeing a lot of pitches is a good thing. This notion is not only stated by former players, making constant sets of statements based on no evidence or facts, or by TV broadcasters who use a never-ending array of cliché lines, but also by smart sabermetricians.
But is this notion true? Does seeing more pitches really lead to more runs? First and foremost, I want to thank Owen Watson, who on September 30th 2014, came out with an article for The Hardball Times displaying that there is a correlation between seeing pitches and drawing walks (you can find his article here). This is basically where I got the idea for this study. The study was well done, however, I don’t think it was asking the right question. While yes, there is a correlation between seeing pitches and walks, and walks are good, this doesn’t necessarily mean that seeing more pitches leads to more runs or that seeing more pitches is necessarily a good thing. There are other factors that one must consider in order to be able to come to this conclusion (Watson’s article was on pitching efficiency, and I want to make it clear that I’m only focusing on this specific aspect of the article).
For example, the Red Sox in 2014 saw a lot of pitches yet they weren’t one of the top teams when it came to run scoring. Also, the Royals went all the way to the finals last year, and they don’t exactly see a lot of pitches. In fact they’re famous for having a bunch of free swingers on the team. Finally, while getting into deep counts leads to more walks, it’s also very possible that it will lead to more strikeouts. This is what made me question whether seeing more pitches is a good thing. While Watson’s study looked at the correlation between walks and pitches per plate appearance, it ignored several other factors that could contribute to seeing a lot of pitches being counterproductive.
Ok, now let’s get to the fun stuff. The way I constructed this study was rather simple and I basically used the same model Watson did for his study, I just changed the BB% to R/G (runs per game). Below is a chart that examines the correlation between Pit/PA (pitches per plate appearance) and R/G (runs per game) for every team, for the 2014 season. The X-axis represents the teams. Then you will notice two data points on the Y-axis — the blue represents R/G, and the red represents Pit/PA. Oh and if you don’t know what LgA is on the X-axis, that’s the league average.
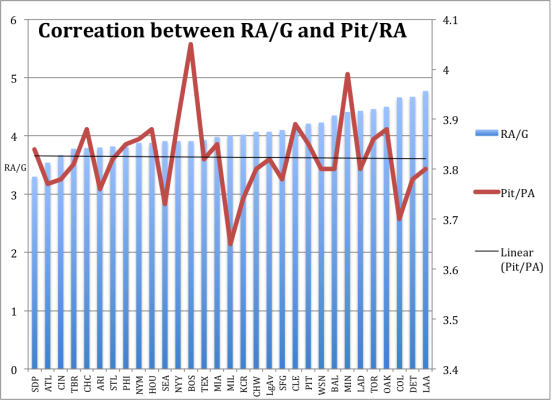
So there it is. As you might be able to tell there is no real correlation between pitches seen and runs scored. The correlation coefficient, by the way, is R = -0.0486. If you are unfamiliar with correlation coefficients, all you really need to understand is a correlation coefficient of 0 displays no real correlation between the data. The correlation here is slightly negative but it’s too small or too close to zero to really be interpreted as a negative correlation.
You might, at this point, find this data hard to believe. Well, I would ask you to consider this; strikeouts as I’ve already mentioned, and can’t keep mentioning enough, are at an all-time high. Going deeper into counts therefore puts one at a higher risk of getting struck out. This may be one of the explanations for the data above. Also, seeing more pitches means you are wearing the starting pitcher out, meaning you are far more likely to face the bullpen. This is not necessarily a good thing! Bullpen pitchers are better than ever. Facing the bullpen, in today’s game, may actually be counterproductive.
Now let’s consider one final element. This study is not perfect and has a few flaws. Most notably, it only takes into account 2014. This after all may have just been a blip on the radar. I will therefore be looking at more of this data to truly examine whether this data is 100% accurate. I will also take a look at the correlation between pitches seen and K% to get a better and further understanding of whether it is beneficial to see a lot of pitches. I just thought that this data point was simply too interesting not to be shared especially as we head into a new season of baseball. Hopefully this will allow people to be more critical when they are watching the game and listening to pundits speak on TV. Remember, just because someone says something doesn’t mean it is true.
Thanks to Owen Watson for doing his study in The Hardball Times; he now writes for FanGraphs. The data was also all found at Baseball Reference.
Julien Assouline is a journalism student at Ryerson University, and writes for Baseball Prospectus Milwaukee. Follow him on Twitter @JulienAssouline.
This is really interesting, and I’ve wondered the same thing, especially because of the bullpen point you made. With increased effectiveness of pitchers in short stints and more specialization (e.g. LOOGYs), it seems like getting into the bullpen might actually be a bad thing a lot of the time.
I wonder if a better measure might be runs/inning (or runs/inning*9 if you’re looking for something on a similar per-game scale). It probably wouldn’t make much of a difference, but theoretically a good offense could be punished (slightly) by winning a lot of home games in 8.5 innings and not getting their 9th at bat. And the occasional rain-shortened game or extra inning game could impact the numbers as well. I’m not sure how easy it would be to get data for innings at the plate, though, short of counting each individual game.
Thanks a lot for the comment Brendan, and all definitely take a look at the runs/inning*9. I think this will give us more insight into the results I got. I think another interesting element, which I forgot to mention, is how hitters due late in the count and see if there therefore more prone to strikeouts.
This is great stuff. Thanks for posting your early findings. Couple of related/unrelated thoughts
– it doesn’t seem like a large range for pitches/pa ~3.7 – 4…. i guess that’s ranging ~15 pitches and someone on the staff has to absorb that. In the long run, a team in a more patient division could experience more usage. I wonder if that’s meaningfull.
– is there a way to incorporate the linear weight values for BB and K into your future analysis on outcomes?
– foul balls, This makes me think about players that have a propensity to see more pitches by way of foul balls. Theoretically, these types of players would have higher swing percentages than players who get deep into counts looking to walk. Or maybe I am describing the same plate approach.
Anyway again good stuff
Hey Bill this is a really great comment. For the wighted values for BB and K, I could look at the correlation between them although I’m not sure that would give us a clearer answer. For the first comment, that’s definitely possible, this gives us a sense of the situation in pertaining to runs scored, thats it. For the final comment, that could be the case, it’s also possible that 2014 was just an outlier, I’m in the process of writing my next post so hopefully my next findings will give us a better perspective on the situation.
A couple of points:
– Why not use a scatter plot? Your bar/line graph is confusing.
– Wouldn’t it make more sense to use the same denominator for both metrics? Something like pitches/PA and runs/PA, which would avoid various biases (such as the 8.5 inning games)
By the way, if you expand this to 2004-2014, the correlation between pitches/PA and R/G is 0.036. The correlation between pitches/PA and R/PA is 0.008. So it doesn’t seem like there’s much there.
I’m guessing there’s a lot more to dig out of this however, as this simple correlation analysis doesn’t tell me much.
I wanted to display the teams and I’m not sure what you find confusing about the chart I think it tells exactly the story I wanted it to. This chart is actually rather simplistic. As for the second comment I don’t think that it would give us a much different answer or an answer with a significant difference. Finally I finished writing the rough draft for the second article and I agree that this chart on it’s own doesn’t tell us much, think of it more as the appetizer for my second article. Also as for your point about correlations, and my reason for expand the research, my goal was to see if 2014 was an outlier or part of a consistent trend or if the results were unreliable. I do use a scatter plot in my next article. I thought that using this specific chart would tell a better story for a single season worth of data.
You have proven that there is no correlation between team runs and team pitches against per PA. This doesn’t say that teams might not score more if they were more patient or might score more if they were less patient. It just suggests that the game is being played in a roughly optimal way. It would be surprising or at least suggest that coaching is bad if this weren’t the case.
An alternative analysis, something Bill James might do, might focus on the 5% of batters who are most patient and the 5% of batters who are least patient. Do batters following longer at bats do better than batters following shorter at bats? I can think of two reasons they might. More pitches in an inning could wear on a pitcher. More views of pitches prior to batting could help a batter to time pitches.
Also, is there is data suggesting that more pitches per batter (in a given inning) corresponds to more runs against or higher OPS against or wOBA? If there is, that would seem to negate the point you are making. This data should also be available. Looking at it from the pitchers POV rather than the batter’s POV might make a conclusion more clear.
To address your first point this data gives us a general idea of the situation, for one season. Of course it’s not a specific look at each individual team.
As for the Bill James comment, well that would again require a far more in-depth analysis, and one would be looking at players. Not exactly relevant to this article, I was looking at a more general angle.
I’m not sure there is, if there is you should probably look at it in baseball reference. Looking at it from a pitchers point of view would be interesting that being said I’m not sure the results would be that different, but if your that curious you can do a study on it 🙂
The increase of SO rates each year because the expansion of the strike zone and better framing skills by the catchers should be a red light for a patience approach because are the strikes the type of pitches that are increasing, not balls. Hitters as Ted Williams today probably will be making more swings looking for more contact, and good contact, and taking less walks.
That would be my hypothesis although further studies need to be done to make sure this is accurate.
Julien – would you be able to do this year by year going backwards in time?
I think there may have been a point in the past where teams that took a lot of pitches got a benefit out of wearing out starters sooner to get to the bullpen (I’m thinking about teams like the Yankees in the late 1990’s). But we have now reached an era where middle relievers are generally as good or better than the starters they replace (I believe this was summarized recently in a Grantland article by either Jonah Keri or Ben Lindbergh).
Hi tz, yes and I did it for my next post, which I’ve just submitted, I looked at twenty years worth of data. The title is “It’s Time to Re-Evaluate the Value of the Walk”.
The headline is somewhat misleading, as the article isn’t seeking out a cause/effect relationship at all – rather looking for correlation. I do think that it seems like a good stepping-off point for a lot of discussion/study.
1. The most valuable conclusion (and the one implied by the headline) would be to identify, either on a team or individual level, whether changes in P/PA (in either direction, I suppose) lead to meaningful changes in runs.
2. The very mild negative correlation between P/PA and runs makes intuitive sense – the only real offensive skill that shows up in that stat is the ability to put the bat on the ball, and it would have a reductive effect on P/PA and an additive effect to runs.
3. I hope that even without this information, nobody was claiming that taking pitches leads to runs, completely without qualifier. I think a study like this needs to be done in bands controlling for batting quality, as opposed to what is simply a measure of approach. When the whole spectrum of ability is considered, you know who sees the most pitches? The poor kid in little league whose dad makes him play and he stands in the back corner of the box, hoping to walk or strike out before he gets hit. Extreme example aside, the valuable conclusions in #1 can realistically only be given for particular classes of hitters. Lousy hitters should probably take a lot of pitches, great hitters fewer.
Anyway, though-provoking and a nice read.
Good comment vonstott, I suppose if one was expecting an answer to the question then yes the title was misleading. The purpose was not necessarily to answer the question but more to create further questions and analysis. I do think, however, before one starts delving into a study of this matter a larger sample size of the data is required, which is what I did in my next piece. After that I think it’ll help us or direct us in a better direction to possibly come up with an answer.
I’m not sure whether this comment leads in another direction or points to another line of research, but it seems to me after watching thousands of MLB games that when an AB goes on and on and on (8+ pitches), more times than not the pitcher eventually “gives up” and the batter either walks or gets a hit. And this makes some sense – as a pitcher, why waste effort extending an AB on and on, piling up your pitch count? If you can’t figure how to get the guy out by the 9th pitch, why beat your head against a wall? Why waste 10% or more of your bullets (pitch count) on one AB? Move on to the next guy, situationally-dependent of course.
I guess the analogy in football would be throwing at Darelle Revis. Why target his receiver 12 times if only 2 will be successful? Put the energy into picking on the other CB, where you can complete 8 of 12.
I think that a lot of people just don’t realize how good bullpens are now a days. An element which one seriously needs to consider is that getting to the bullpen is not exactly a good thing. So lets say if a hitter wheres out a a pitcher, than there is a higher chance of getting to the bullpen. Thus facing a 95+ mph fastball and a fresh arm. This might be an answer to the results although it is just a hypothesis of course.