Author Archive

Pitch Grades vs. Relative Pitch Grades

When deciding on the grade for a pitcher’s breaking pitch, a scout relies on the pitch’s velocity and movement (although command can be factored in as well).  These factors are combined into a single number on a scale from 20-80, with major league average as a 50 and a standard deviation recorded at 10.

Clayton Kershaw’s curveball has long been regarded as one of the best in the business, yet by my systematic calculation factoring in velocity, horizontal movement, and vertical movement, his curveball rated among the bottom third of curveballs.  Its below-average velocity and below-average horizontal movement held it back despite its above-average vertical movement.  While I was pondering this conundrum, I remembered another fact–Kershaw’s fastball happens to have a lot of rise.  What if movement was recorded by the difference between the pitcher’s fastball movement and the breaking ball movement instead of the breaking ball’s movement compared to an arbitrary point?  I was about to find out.

(This paragraph is solely methodology, so skip it if you wish.)  Using Baseball Prospectus’ excellent pitch f/x leaderboard, I selected all pitchers who threw at least 200 four-seam fastballs and at least 100 curveballs in 2014.  A breaking pitch’s horizontal and vertical movement was recorded as the difference between the pitch’s raw movement and the pitcher’s four-seam fastball’s movement.  I calculated the z-scores for the curveball’s velocity and the z score for the combination of the z scores of the curveball’s relative movements.  (I gave a 150% weight to vertical movement over horizontal movement).  Then, I combined the z scores of the velocity and combined relative movement to calculate a relative pitch score.  (I gave a 150% weight to combined relative movement over velocity).  Finally, I calculated a scouting grade on the 20-80 scale based off the relative pitch score.  Below is a table showing my results.

While I may not have solved the difference of evaluation among Kershaw’s curveball, the relative scouting grade at least opens discussion on how movement and velocity of pitches should be evaluated.  Is it better for a breaking pitch to be faster, or is it better to create a wider difference in velocity between the fastball and breaking ball?  Is it better for a pitcher’s breaking ball movement to be as different from the fastball as possible, or do some similarities create greater deception because a hitter can’t recognize the pitch earlier?

Player CU Vel CU H Mov CU V Mov Rel SG Unadj SG
Garrett Richards 79.68 5.85 -12.33 76.26 71.63
Sonny Gray 82.45 9.21 -5.44 76.09 67.11
Justin Grimm 81.63 7.15 -6.92 72.63 64.67
Blaine Hardy 78.62 1.55 -9.74 71.28 53
Adam Wainwright 75.37 9.34 -9.23 69.59 60.71
John Axford 78.77 4.37 -9.81 69.07 59.61
Carlos Torres 79.9 6.43 -9.09 68.1 64.79
Robbie Erlin 74.28 0.81 -10.64 68.01 43.53
Felix Hernandez 80.97 7.25 -8.16 67.84 66.62
Yu Darvish 78.16 8.5 -7.46 67.83 60.8
Yordano Ventura 83.76 2.28 -5.63 65.12 55.81
Clay Buchholz 78.25 8.88 -7.36 64.52 61.56
Brandon Workman 77.09 4.68 -9.35 64.24 55.08
Tyler Skaggs 77.58 6.64 -8.92 63.97 59.31
Jake Arrieta 80.12 5.81 -9.46 63.55 64.97
Juan Gutierrez 81.1 6.16 -6.77 62.94 60.89
Kevin Jepsen 84.52 3.9 -6.89 62.68 64.44
James Paxton 82.54 0.39 -2.69 62.49 41.05
Chris Tillman 76.22 3.31 -10.43 62.3 52.94
Craig Kimbrel 86.3 4.84 -5.95 62.14 68.18
Adam Warren 81.94 4.9 -6.62 61.45 59.77
Dellin Betances 83.85 7.04 -3.79 61.29 61.37
Edinson Volquez 80.67 5.95 -7.3 60.89 60.83
Wade Davis 85.56 3.29 -4.69 60.28 59.75
Tom Wilhelmsen 78.85 6.01 -7.58 60.26 57.4
Trevor May 77.76 7.56 -6.23 59.46 54.56
Cody Allen 86.88 5.09 -3.71 59.12 64.13
Tyler Thornburg 78.45 2.83 -7.21 59.01 48.63
Casey Janssen 74.81 9.84 -5.38 58.98 50.23
Trevor Bauer 79.18 5.17 -8.33 58.51 58.36
Brad Peacock 77.37 5.91 -7.39 57.85 53.18
Brett Oberholtzer 79.73 1.73 -3.22 57.83 38.69
Cole Hamels 79.01 3.23 -6.2 57.81 48.13
Josh Tomlin 76.76 4.39 -7.46 56.34 48.65
Drew Pomeranz 81.77 4.9 -7.41 56.24 61.47
Gio Gonzalez 78.4 5.35 -8.64 56.18 57.73
Andre Rienzo 79.26 6.3 -6.52 55.97 56.17
Scott Atchison 80.83 4.81 -8.52 55.78 62
Scott Kazmir 77.03 0.12 -3.35 55.77 29.19
Ian Kennedy 78.23 6.26 -9.1 55.71 60.51
Nick Tepesch 78.82 5.36 -8 55.71 57.04
Cory Rasmus 76.65 5.44 -7.84 55.67 51.66
Tom Koehler 79.92 5.1 -8.64 55.42 60.79
Marco Estrada 77.92 4.66 -6.27 55.31 48.81
Mike Fiers 72.93 3.7 -11.31 55.29 48.33
Odrisamer Despaigne 76.43 8.24 -7.25 55.08 55.59
Francisco Rodriguez 76.96 7.14 -6.73 54.97 53.1
Anthony Ranaudo 78.16 4.35 -7.93 54.82 53.13
Stephen Strasburg 80.69 7.59 -7.28 54.74 64.35
Mike Minor 81.66 0.98 -3.82 54.69 43.24
Yovani Gallardo 79.95 4.01 -6.75 54.68 53.49
Jeremy Hellickson 76.7 7.51 -9.53 54.53 60.71
Justin Verlander 79.98 4.97 -6.45 54.29 54.83
Dillon Gee 74.91 8.15 -7.75 54.19 53.13
J.A. Happ 78.27 2.13 -4.71 53.89 40.06
Kevin Quackenbush 77.17 5.05 -7.88 53.7 52.15
Roenis Elias 79.81 7.16 -6.09 53.3 58.18
Marcus Stroman 83.34 8.96 -2.3 53.27 60.33
Jason Vargas 75.68 1.63 -5.08 53.05 33.84
Clayton Kershaw 74.61 2.35 -8.93 52.85 43.08
Collin McHugh 73.68 8.26 -9 52.55 53.77
David Phelps 80.72 2.7 -5.06 52.51 48.01
Tommy Hunter 83.55 6.01 -3.14 52.48 56.72
Wesley Wright 79.8 3.86 -4.65 52.48 47.24
Miles Mikolas 75.4 6.22 -9.7 52.36 55.32
Javy Guerra 77.99 3.47 -7.42 52.2 49.48
Jason Hammel 77.19 6.3 -7.76 52.1 54.57
Vic Black 82.68 3.57 -3.91 51.95 51.46
Phil Coke 80.48 0.98 -3.37 51.9 39.25
Nick Martinez 76.92 3.84 -8.05 51.86 49.41
Jordan Zimmermann 79.71 5.65 -6.73 51.77 56.4
Phil Hughes 77.22 6.62 -7.84 51.53 55.54
Zack Greinke 72.88 6.58 -7.08 51.41 43.17
Colby Lewis 77.7 6.12 -5.81 50.97 50.21
Joe Kelly 79.88 6.94 -8.44 50.7 64.12
David Price 80.37 2.84 -1.58 50.68 38.24
Tim Lincecum 75.63 3.81 -8.37 50.62 47.15
Junichi Tazawa 76.12 6.87 -8.14 50.61 54.27
Matt Garza 75.25 4.66 -8.62 50.4 48.74
Jake Peavy 80.56 2.49 -1.91 50.39 38.81
Joba Chamberlain 79.74 5.1 -6.03 50.25 53.43
John Lackey 79.16 5.54 -5.39 50.13 51.3
Grant Balfour 82.74 2.44 -1.31 50.07 42.27
Wei-Yin Chen 74.9 3.11 -6 50 37.62
Danny Duffy 78.22 3.8 -6.76 49.95 48.98
Michael Wacha 75.4 4.99 -6.15 49.88 43.24
Zack Wheeler 79.61 6.2 -8.2 49.75 61.25
Anthony Varvaro 80.73 4.14 -5.43 49.68 52.11
Shelby Miller 77.76 7.65 -5.21 49.51 52.05
Edwin Jackson 79.94 1.31 -3.97 49.41 40.28
Miguel Gonzalez 77.47 5.77 -6.3 49.39 50.22
Anibal Sanchez 79.85 3.27 -3.53 49.35 43.11
Jesse Hahn 74.64 8.63 -8.05 49.33 54.32
Brandon McCarthy 82.24 5.96 -4.24 49 56.44
Mat Latos 76.95 3.64 -4.84 48.99 40.53
Tanner Roark 74.25 6.13 -9.04 48.69 50.65
Vance Worley 77.87 6.06 -5.44 48.53 49.5
J.J. Hoover 75.78 6.82 -6.21 48.49 48.24
Jose Fernandez 83.56 8.96 -1.82 48.41 59.58
Felix Doubront 75.43 2.87 -8.77 48.33 45.72
Jordan Lyles 81.77 2.16 -3.92 48.31 46.3
Santiago Casilla 82.01 4.48 -5.46 48.18 55.95
Kevin Correia 79.47 6.02 -3.46 48.15 47.94
Erik Bedard 74.86 4.96 -6.51 48.07 42.86
James Shields 80.39 3.11 -4.08 47.79 45.51
Gerrit Cole 84.65 6.34 -3.47 47.79 60.91
Chase Anderson 77.79 4.59 -7.32 47.24 51.15
Rick Porcello 78.15 7.45 -5.93 46.98 54.45
Travis Wood 72.92 1.78 -6.47 46.64 31.32
Samuel Deduno 81.59 6 -5.39 46.63 58.04
Johnny Cueto 81.53 2.02 -1.73 45.52 39.62
David Buchanan 77.95 4.31 -8.22 45.48 53.31
Ian Krol 79.05 5.17 -4.38 45.11 47.56
Erasmo Ramirez 80.4 3.22 -1.79 45.05 39.68
Charlie Morton 78.99 9.72 -7.1 45.02 64.43
Matt Cain 78.2 7.49 -5.26 44.99 52.88
Jose Quintana 80.94 2.22 -2.39 44.96 40.41
A.J. Burnett 82.4 4.23 -5.31 44.89 55.94
Vidal Nuno 77.29 4.84 -5.16 44.68 44.76
Daisuke Matsuzaka 75.37 8.38 -6.13 44.63 50.41
Hector Noesi 81.07 5.54 -4.12 44.59 52.45
Jake Odorizzi 70.24 4.97 -8.77 44.52 37.95
Joel Peralta 78.14 5.41 -3.91 44.15 44.68
Joe Nathan 82.63 2.69 -1.83 43.9 43.93
Carlos Carrasco 81.71 6.55 -5.33 43.55 59.35
Josh Beckett 73.88 7.73 -7.83 43.33 50
Fernando Salas 83.76 1.47 1.74 43.17 34.49
Lance Lynn 80.15 4.98 -5.79 43.07 53.5
Jered Weaver 69.96 6.47 -3.84 42.49 27.42
Will Smith 79.06 4.48 -4.32 41.86 45.94
Hector Santiago 77.64 3.59 -0.53 41.31 30.6
Jorge De La Rosa 74.81 4.56 -6.26 41.19 41.21
Hyun-jin Ryu 73.1 5.04 -7.88 41.17 42.5
Matt Shoemaker 76.24 6.77 -1.78 41.06 37.45
Fernando Abad 78.63 4.08 -4.74 40.75 45.18
Ryan Vogelsong 77.55 2.32 -4.13 40.71 37.22
Nathan Eovaldi 76.8 7.12 -7.37 40.45 54.37
Jon Niese 74.5 2.71 -5.81 39.94 35.31
Dan Haren 77.88 3.67 -3.65 39.66 39.63
Brad Hand 80.04 5.66 -2.5 39.15 45.96
Franklin Morales 74.71 5.81 -5.22 38.68 40.9
Alfredo Simon 78.2 5.32 -4.82 38.35 47.04
Eric Stults 68.63 1.8 -5.12 37.89 17.63
Madison Bumgarner 77.56 5.55 -4.39 37.85 44.88
Yusmeiro Petit 77.55 7.25 1.56 37.82 32.71
Jeremy Guthrie 76.14 4.86 -3.22 37.74 36.93
Masahiro Tanaka 74.41 5.28 -6.35 37.48 42.06
Gavin Floyd 81.7 5.13 -3.23 37.24 50.69
Aaron Harang 74.67 2.85 -4.36 36.79 32.16
Jacob deGrom 80.26 4.49 -1.82 36.32 42.16
Jon Lester 75.95 4.82 -4.15 36.25 38.87
Homer Bailey 80.44 5.72 -2.91 36.13 48.13
Jose Veras 76.8 10.11 -5.62 35.11 56.15
Jerry Blevins 74.84 6.77 -4.32 35.1 40.88
Drew Smyly 78.4 3.38 -0.21 34.68 31.1
C.J. Wilson 77.18 5.52 -4.61 34.67 44.5
John Danks 74.15 2.51 -1.84 34.63 23.5
Julio Teheran 74.02 6.32 -4.89 34.54 39.49
Jacob Turner 79.14 3.29 -2.46 34.4 38.63
Tommy Milone 75.46 4.13 -2.38 34.24 31.52
Tim Hudson 76.14 8.32 -4.29 33.02 47.21
Max Scherzer 78.2 5.92 -2.31 32.64 41.66
Hiroki Kuroda 77.15 4.58 -2.65 31.98 37.2
Paul Maholm 72.76 5.41 -5.55 29.91 36.31
Carlos Villanueva 76.58 4.05 -1.53 29.9 31.74
Scott Carroll 77.43 7.38 -2.75 25.13 44.15
Mark Buehrle 72.16 3.91 -3.74 23.02 26.85


Using Gifs to Visualize Curveballs on the Scouting Scale

After reading Kiley McDaniel’s articles on explaining the scouting scale, I thought that I would take a different approach in trying to explain it–namely the approach of gifs.  Although the scale is normally reserved for players who haven’t lost their rookie status in the majors, perhaps a visualization can better illustrate what “major league average,” “plus,” or “below average” looks like.

To show the differences between curveballs in different positions along the scouting scale, major league curveballs must first be graded.  To do this, I pulled up Baseball Prospectus’ pitch f/x leaderboard and set it to filter for pitchers who threw at least 100 curveballs in 2014.  The way in which pitch movement is measured and the fact that lefties’ curveballs’ horizontal movement appeared to be measured lower than righties forced my methodology.

I split up righties and lefties into separate groups for analysis.  Pitch movement was recorded based on the inches a pitch broke more than the the pitch with the least break.  Total movement was recorded as the square root of the combined horizontal and vertical movement squares (C2 = A2 + B2).  Z Scores were recorded for each curveball’s velocity and movement, and then were added (with movement receiving a 1.5 times greater weight) to form a grade.  The grades were then transferred into Z Scores with a median of 50 and each standard deviation being 10.  Finally, the righties and lefties were combined to make a final scouting scale.

Name / Throws / Total Movement Z Score / Velocity Z Score / Scouting Grade

Garrett Richards R 2.081 0.289 73.4
Drew Pomeranz L 0.882 1.398 69.0
Tyler Skaggs L 1.757 0.047 68.8
Blaine Hardy L 1.356 0.410 67.1
Gio Gonzalez L 1.406 0.317 66.9
Alex Cobb R 0.907 0.948 66.0
Roenis Elias L 0.949 0.771 65.3
Sonny Gray R 0.589 1.187 64.4
Jarred Cosart R 1.125 0.289 63.8
Felix Hernandez R 0.812 0.712 63.5
Jake Arrieta R 0.972 0.428 63.2
Charlie Morton R 1.191 0.066 63.0
Carlos Torres R 0.973 0.350 62.7
Craig Kimbrel R -0.474 2.430 62.1
Sean Marshall L 1.795 -0.970 62.0
Yoervis Medina R -0.471 2.330 61.5
Joe Kelly R 0.852 0.341 61.4
Mark Melancon R 0.312 1.116 61.2
Stephen Strasburg R 0.633 0.612 61.0
Justin Grimm R 0.404 0.915 60.8
Robbie Erlin L 1.711 -1.022 60.7
Jamey Wright R 0.958 0.057 60.6
Adam Wainwright R 1.731 -1.106 60.6
Wandy Rodriguez L 1.401 -0.639 60.1
Kevin Jepsen R -0.315 1.861 59.9
Jeremy Hellickson R 1.367 -0.664 59.9
Clay Buchholz R 1.007 -0.166 59.6
Scott Atchison R 0.429 0.683 59.5
Will Harris R 0.538 0.518 59.5
Michael Bolsinger R 0.524 0.521 59.3
John Axford R 0.857 0.015 59.3
David Robertson R -0.245 1.619 59.0
Jeremy Affeldt L 1.197 -0.497 59.0
Ian Kennedy R 0.943 -0.186 58.8
Yu Darvish R 0.941 -0.182 58.8
Eric Surkamp L 0.624 0.320 58.7
Nick Masset R 0.680 0.182 58.6
Tom Koehler R 0.551 0.360 58.5
Marcus Stroman R -0.189 1.455 58.4
Zack Wheeler R 0.604 0.263 58.4
Jose Fernandez R -0.255 1.532 58.3
Scott Downs L 1.405 -1.064 57.2
Edinson Volquez R 0.240 0.609 57.1
Felix Doubront L 1.093 -0.629 56.9
Juan Gutierrez R 0.110 0.744 56.7
Jesse Chavez R 1.076 -0.731 56.5
Jeremy Jeffress R 0.264 0.476 56.4
Danny Duffy L 0.446 0.272 56.4
Cody Allen R -1.180 2.630 56.4
Mike Leake R 0.210 0.515 56.2
Dellin Betances R -0.552 1.635 56.0
Trevor Bauer R 0.416 0.147 55.8
Jose Veras R 0.924 -0.638 55.6
Adam Warren R -0.220 1.022 55.2
Clayton Kershaw L 1.119 -0.906 55.2
Chris Tillman R 0.987 -0.828 55.0
Cole Hamels L 0.142 0.517 54.9
Miles Mikolas R 1.158 -1.093 54.9
Jeff Locke L 0.268 0.317 54.9
Gerrit Cole R -0.845 1.884 54.7
Josh Fields R 0.233 0.257 54.7
Nick Tepesch R 0.370 0.018 54.4
Brandon Workman R 0.743 -0.544 54.4
Carlos Carrasco R -0.275 0.954 54.2
Cesar Ramos L 1.941 -2.290 54.2
Tom Wilhelmsen R 0.309 0.034 53.9
Jenrry Mejia R 0.117 0.308 53.9
Trevor Cahill R 0.202 0.153 53.7
Odrisamer Despaigne R 0.813 -0.770 53.6
Collin McHugh R 1.350 -1.635 53.2
Jesse Hahn R 1.150 -1.345 53.2
Phil Hughes R 0.573 -0.502 53.0
Samuel Deduno R -0.389 0.906 52.8
Brett Cecil L -1.373 2.483 52.8
Ian Krol L -0.094 0.555 52.7
Wade Davis R -1.260 2.184 52.6
Jordan Zimmermann R -0.034 0.308 52.3
Andre Rienzo R 0.052 0.170 52.3
Junichi Tazawa R 0.731 -0.857 52.2
Jason Hammel R 0.477 -0.512 52.0
Wesley Wright L -0.302 0.764 52.0
Mike Fiers R 1.376 -1.890 51.8
Nathan Eovaldi R 0.542 -0.644 51.8
Alex Wood L -0.385 0.851 51.7
Jake Buchanan R 0.570 -0.709 51.6
Dillon Gee R 0.926 -1.261 51.5
Trevor May R 0.298 -0.328 51.4
David Buchanan R 0.247 -0.263 51.3
Hyun-jin Ryu L 1.074 -1.395 51.3
Rick Porcello R 0.171 -0.189 51.1
Yordano Ventura R -1.045 1.603 50.9
Anthony Ranaudo R 0.136 -0.195 50.7
Aaron Loup L -0.110 0.282 50.6
Brad Hand L -0.491 0.851 50.6
Brandon McCarthy R -0.757 1.116 50.5
Will Smith L -0.282 0.526 50.5
Vidal Nuno L 0.094 -0.043 50.5
Justin Verlander R -0.301 0.415 50.4
Tommy Hunter R -1.053 1.539 50.4
Santiago Casilla R -0.726 1.038 50.3
Brad Peacock R 0.257 -0.447 50.2
Madison Bumgarner L 0.013 0.043 50.2
Fernando Abad L -0.223 0.397 50.2
C.J. Wilson L 0.077 -0.066 50.1
Francisco Rodriguez R 0.334 -0.586 50.1
A.J. Burnett R -0.847 1.167 49.9
Erik Bedard L 0.572 -0.842 49.9
Tanner Roark R 0.889 -1.455 49.8
Kevin Quackenbush R 0.264 -0.531 49.7
Casey Janssen R 0.767 -1.287 49.7
Yovani Gallardo R -0.366 0.376 49.5
Matt Cain R -0.007 -0.173 49.4
Cory Rasmus R 0.332 -0.683 49.4
J.P. Howell L -0.488 0.652 49.2
Shelby Miller R 0.046 -0.328 48.9
Joba Chamberlain R -0.417 0.331 48.7
Mike Minor L -1.028 1.373 48.6
Lance Lynn R -0.505 0.441 48.5
Josh Beckett R 0.835 -1.587 48.4
Daisuke Matsuzaka R 0.510 -1.109 48.3
Chase Anderson R -0.043 -0.318 48.1
Jorge De La Rosa L 0.397 -0.845 48.0
Danny Farquhar R 0.214 -0.725 47.9
Nick Martinez R 0.107 -0.599 47.7
Jerry Blevins L 0.348 -0.825 47.6
Matt Garza R 0.444 -1.141 47.5
Franklin Morales L 0.340 -0.874 47.2
Craig Stammen R -0.732 0.563 47.1
Javy Guerra R -0.179 -0.266 47.1
Scott Feldman R 0.326 -1.041 46.9
Anthony Varvaro R -0.810 0.638 46.8
Hector Noesi R -0.910 0.741 46.5
Miguel Gonzalez R -0.144 -0.428 46.3
John Lackey R -0.520 0.128 46.3
Kevin Correia R -0.427 -0.015 46.3
Kyle Kendrick R -0.313 -0.186 46.3
Tyler Thornburg R -0.364 -0.118 46.2
Colby Lewis R -0.216 -0.344 46.2
Donn Roach R 0.008 -0.683 46.2
Tim Lincecum R 0.226 -1.022 46.1
Chris Capuano L -0.013 -0.507 46.0
Josh Tomlin R -0.062 -0.618 45.9
J.A. Happ L -0.568 0.275 45.7
James Paxton L -1.519 1.643 45.3
Vance Worley R -0.360 -0.289 45.1
J.J. Hoover R 0.093 -0.973 45.1
Tim Hudson R 0.007 -0.854 45.0
Wei-Yin Chen L 0.065 -0.809 44.7
Marco Estrada R -0.419 -0.286 44.5
Kyle Lohse R 0.091 -1.109 44.1
Vic Black R -1.482 1.248 44.1
Gavin Floyd R -1.285 0.951 44.1
Bruce Chen L 0.405 -1.421 44.0
Phil Coke L -1.232 1.003 43.8
Jon Lester L -0.249 -0.478 43.7
Paul Maholm L 0.340 -1.492 42.8
Jose Quintana L -1.420 1.134 42.7
David Phelps R -1.211 0.622 42.7
Zach Duke L -0.491 -0.288 42.5
Brett Oberholtzer L -1.197 0.751 42.4
Homer Bailey R -1.197 0.538 42.2
Jon Niese L -0.078 -0.954 42.2
Alfredo Simon R -0.751 -0.179 41.9
Jim Johnson R -1.275 0.605 41.9
Zack Greinke R 0.308 -1.903 41.0
Scott Carroll R -0.685 -0.431 40.9
Jason Vargas L -0.469 -0.562 40.8
Travis Wood L 0.088 -1.443 40.5
Heath Bell R -1.696 0.948 40.0
David Price L -1.564 0.954 39.9
Doug Fister R 0.071 -1.726 39.8
Jordan Lyles R -1.731 0.961 39.7
Michael Wacha R -0.378 -1.112 39.4
Masahiro Tanaka R -0.204 -1.413 39.2
Joel Peralta R -1.008 -0.208 39.2
James Shields R -1.514 0.518 38.9
Jake Odorizzi R 0.579 -2.759 38.0
Andrew Heaney L -1.515 0.568 37.7
Max Scherzer R -1.307 -0.163 36.5
Anibal Sanchez R -1.676 0.357 36.2
Julio Teheran R -0.450 -1.539 35.9
Scott Kazmir L -1.244 -0.124 35.7
Yusmeiro Petit R -1.253 -0.402 35.4
Mat Latos R -1.151 -0.586 35.2
Jacob deGrom R -1.879 0.473 35.0
Tommy Milone L -0.975 -0.626 35.0
Joe Nathan R -2.412 1.271 35.0
Edwin Jackson R -1.821 0.370 34.9
Matt Shoemaker R -1.126 -0.802 34.0
Drew Smyly L -1.762 0.330 33.4
Dan Haren R -1.545 -0.292 33.2
Hector Santiago L -1.609 0.069 33.2
Grant Balfour R -2.631 1.274 32.8
Ryan Vogelsong R -1.631 -0.405 31.6
Mark Buehrle L -0.593 -1.691 31.5
Erasmo Ramirez R -2.280 0.528 31.3
Jeremy Guthrie R -1.384 -0.854 31.1
Jacob Turner R -2.033 0.102 31.0
Hiroki Kuroda R -1.637 -0.528 30.7
Johnny Cueto R -2.591 0.880 30.6
Jake Peavy R -2.414 0.573 30.3
Josh Collmenter R -0.839 -1.884 29.7
Sam LeCure R -1.215 -1.461 28.7
Bronson Arroyo R -1.320 -1.416 28.0
Aaron Harang R -1.461 -1.319 27.2
John Danks L -1.548 -1.051 25.9
Eric Stults L -0.448 -2.837 24.9
Fernando Salas R -3.656 1.613 24.8
Carlos Villanueva R -2.102 -0.718 24.8
Jered Weaver R -0.725 -2.840 24.4

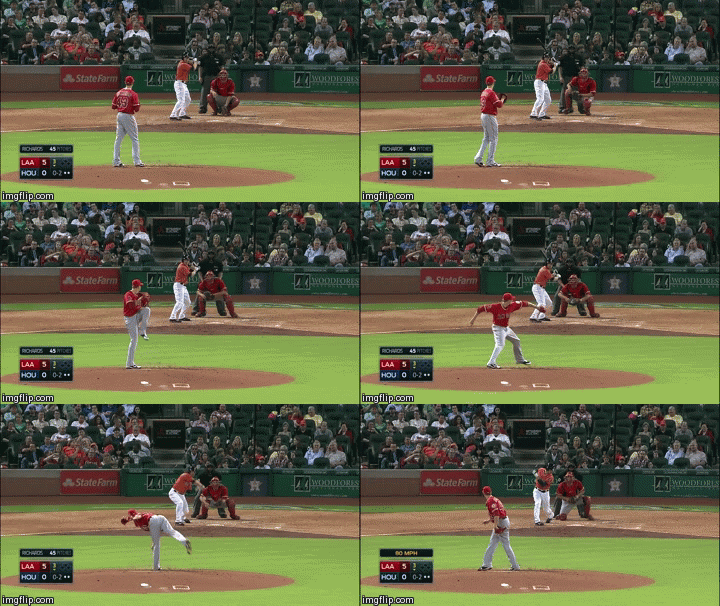
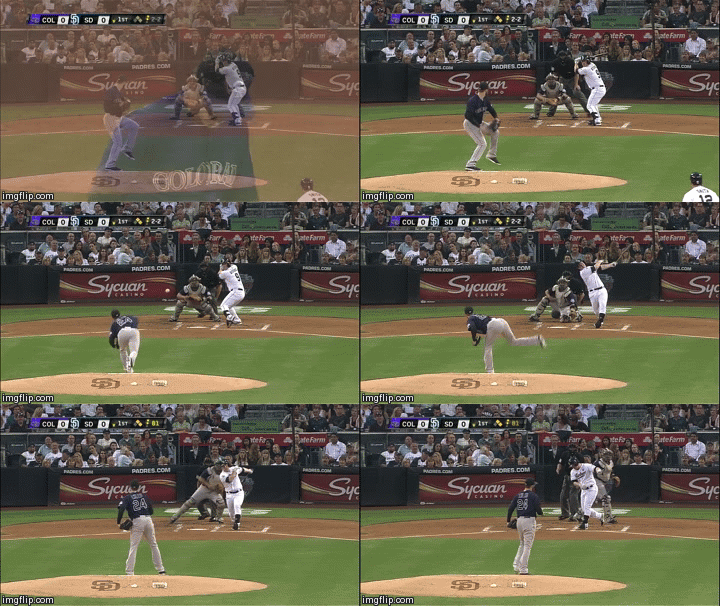
For our first gifs, we’ll look at two of the top curveballs on the by-the-numbers scouting scale.  At an slightly above average velocity of 79.7 mph with the highest amount of break above than the baseline (sorry, Fernando Salas), Garrett Richards’ curveball is a sight to behold and grades out as a 73:

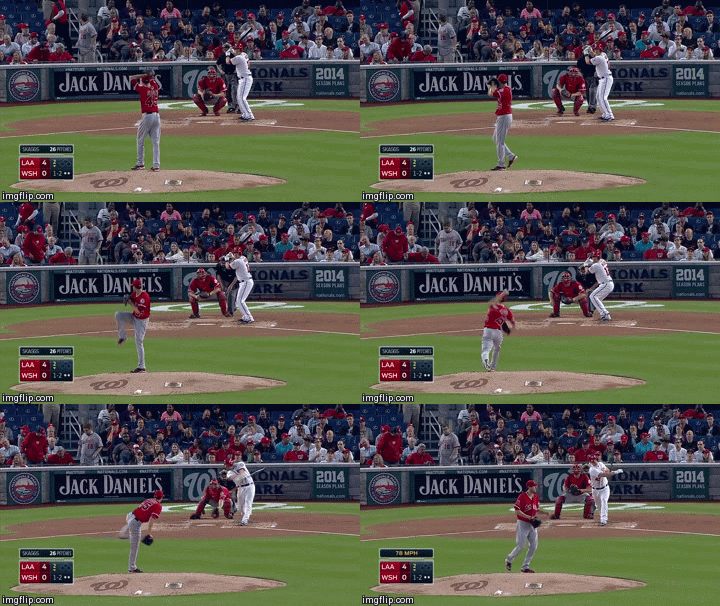
Next, we’ll look at Tyler Skagg’s curveball, which, features great horizontal and vertical movement while maintaining average velocity.  It grades out as a 69:

With the plus-plus-type (70) curveballs out of the way, we’ll take a look at some plus (60) curveballs.  Wandy Rodriguez fits this category.  His curveball has slightly less, but similar, movement as Skagg’s but it’s lesser velocity makes it a lesser-quality pitch.  Notice how it has defined break, but it appears a bit loopy due to its velocity:

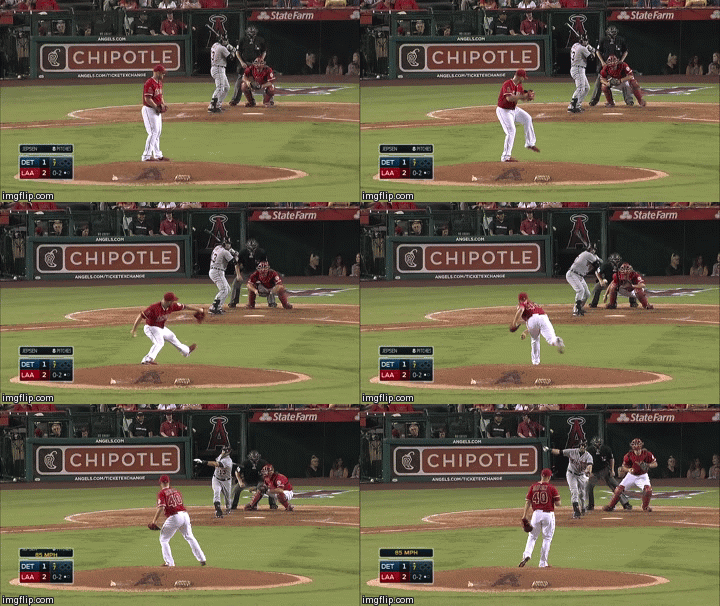
With Kevin Jepsen, we see a curveball that is graded similarly but looks much different than Wandy’s.  Although its break looks sharp because of its velocity, the total movement is slightly below average.  This pitch may actually be a slider, but Jepsen’s breaking pitches tend to run together so consider it a representative picture of his curveball.

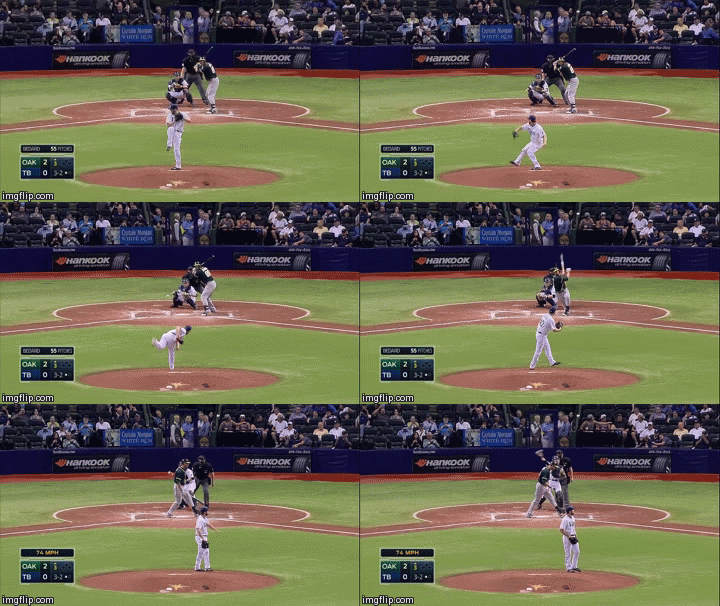
Next, we’ll look at an average (50 on the scale) curveball.  Erik Bedard gets slightly above average break, but with below average velocity.  It has solid two-plane break, but it doesn’t look very sharp:

Next, we’ll look at a below average (40 on the scale) curveball.  Jordan Lyles has good velocity on his curveball, averaging 81.75 mph, but he also averages nearly two standard deviations less break than an average curveball in this sample.  The following is a tough angle to see the break, but it lacks the sharp break of a better curveball.

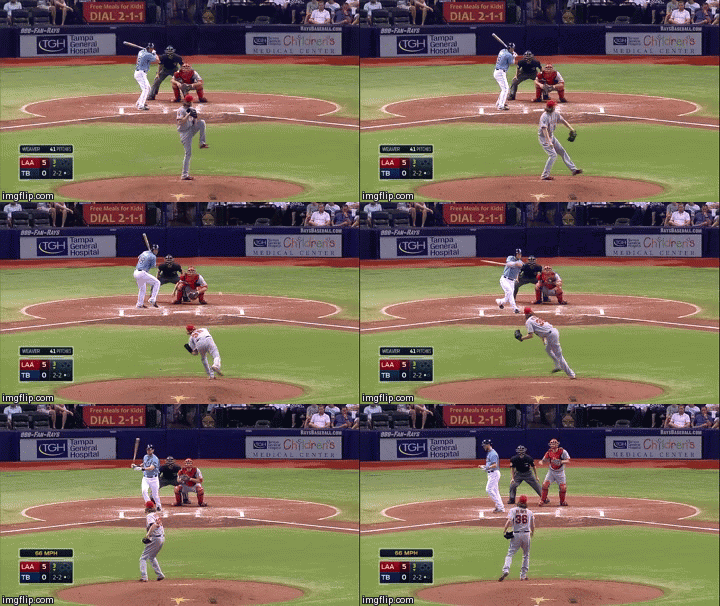
Finally, we’ll look at Jered Weaver’s well below average (24 on the by-the-numbers scale!) curveball.  His curveball was the slowest in the sample and also featured below average break (much of the perceived break is from its low velocity).  It’s still an effective pitch for him, but it’s probably a result of his height and delivery combination than his curveball.  With just about any other pitcher, it would likely be ineffective.


Will Neftali Feliz Be Back to Form in 2015?

On August 3, 2009, Neftali Feliz made his major league debut against the Athletics, pitching two perfect innings with four punchouts. In those innings, he mowed down hitters with 23 fastballs that averaged 99.45 mph, 4 changeups that averaged 91.13 mph, and 3 sliders that averaged 82.43 mph. He would end his rookie season with a 1.74 ERA (2.48 FP), a 33.3 K%, and a 6.8 BB%. As a 21 year-old, he already looked like a bonafide bullpen ace for the Rangers.

Fast forward to the end of spring training in 2014. Feliz is 25 years old and in the prime ages of his baseball career. And he’s starting in AAA. With a fastball that is 91-93 mph. Rangers’ General Manager Jon Daniels said of him, “He’s healthy and his work ethic has been solid, but he needs some work and the best place to get him that is in Round Rock right now. I expect he’ll be back as soon as he’s ready to help us.” A team whose bullpen for opening day included Seth Rosin thought that Feliz wasn’t ready to contribute for them out of the gate. Clearly something was off.

On August 1, 2012, Neftali Feliz underwent Tommy John surgery. Tommy John surgery generally requires at least 12 months for recovery, and he was back in the majors by September 2013. He averaged 94.19 mph with his fastball during his 6 games in September 2013. While his velocity was a step down from his 97+ mph heat in 2009-2011, pitchers often have to slowly build their arm strength up again to pre-surgery levels and there was no reason to believe he wasn’t on track to doing so. When his velocity failed to reach that level through most of his 2014 campaign, though, it became unclear if he would ever regain his pre-surgery stuff.

By some measures, his time in AAA was a success. He struck out 9.73 batters and walked only 2.51 per 9 innings. He produced a 3.14 ERA compared to the Pacific Coast League’s league-wide 4.64 ERA. His biggest problem was home runs—he gave up 6 in only 28.2 innings. When was he called back up to the major league squad on July 4, there were reasons to be cautiously optimistic that he could find some success again as a reliever. The Rangers noted that he was throwing in the mid 90’s some games while in others he would sit in the low 90’s.

Feliz didn’t exactly dominate during his early outings. Through July 23, he had pitched 10.1 innings with only 4 strikeouts, 3 walks, and 2 home runs given up. Yet, out of the playoff race, Texas dealt their closer Joakim Soria to the Tigers and anointed Feliz their new closer. While it’s possible that the team merely liked his shiny ERA at the time over his FIP (2.61 to 5.75), perhaps they started to see some signs of life in him. Regardless, his 1.69 ERA and 13 saves out of 14 save opportunities the rest of the way probably made them feel validated in their decision. With his end of the season performance, it appears likely that he will be the Rangers’ opening day closer.

Projecting into 2015, Feliz’s 4.90 FIP and -.1 WAR from 2014 provide red flags. His home run rate also look to be an issue. His extreme flyball tendencies (51.1 FB% versus 27.3 GB%) resulted in 1.42 HR per 9 innings despite a fairly ordinary 11.1 HR/FB% rate. His 17.2 K% and 9 BB% doesn’t exactly inspire confidence, either. Steamer isn’t a fan and projects him for .1 WAR in 65 innings.

But there are reasons for optimism, too. He kept up his low BABIP streak at .176 (.215 career) thanks to his impressive 20 IFFB% (17.8 career). Among relievers with 200 innings since his debut, he has the lowest BABIP, the 6th lowest LD%, and the highest IFFB%. Steamer projects him for a .284 BABIP next year, but I’m willing to bet his will be much lower than that figure and will continue to let him beat his FIP by around a full run.

Next, we’ll look at his home run rate. His 2014 figure was the highest of his career, caused primarily by his 11.1 HR/FB% (6.9 career). What may have caused that? Well, it may have been caused at least in part by his changeup. A changeup is a pitch designed to fool hitters who are looking for a fastball: it is supposed to be thrown with identical arm speed as the fastball to make it harder to pick up, and then its velocity and/or movement difference makes it effective. For a pitcher throwing in the upper 90’s with hitters already struggling to catch up to their fastball, a changeup may be less effective because the velocity reduction may sometimes help the hitter instead of hurting him (of course, there are exceptions). When Feliz was throwing in the upper 90’s in 2009-2011, he threw his changeup just 4.4 percent of the time. When Feliz was throwing in the low to mid 90’s in 2014, he threw his changeup 12.4 percent of the time. For his career, opponents have a .212 ISO against his changeup compared to a .119 ISO against his fastball.  In 2014, hitters had a .429 ISO against the pitch, including 3 of his 5 home runs given up on the year.

His velocity provided another reason for optimism as well. While his early- to mid-season velocity wasn’t great, he improved as time went on: in July he averaged 92.88 mph; in August he averaged 93.7; and in September he averaged 95.81. The ISO against his fastball decreased each month as well (from .107 to .107 to .053), even as he increased his usage of his fastball (from 64.7% to 77.36 to 77.78).  His velocity increase had an added bonus as well: it allowed him to use his changeup less (from 14.72% to 11.32 to 3.17). The biggest question is whether he can maintain his September velocity, or even improve upon it.

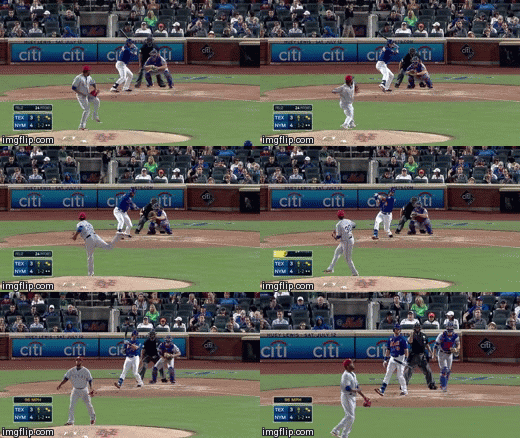
Overall, I don’t think Neftali Feliz is a safe bet to be great in 2015. But I do think that he has a real chance to be much better than the projections project him to be. To end this post, I’ll post a few gifs of Feliz at his best in 2014:

* All pitch usage, velocity, and movement numbers are obtained from Brooks Baseball. All pitch results numbers are obtained from Baseball Savant.


A Gif-tastic Review of Arizona Fall League Pitching Prospects

Rogers Hornsby was once quoted as saying, “People ask me what I do in winter when there’s no baseball. I’ll tell you what I do. I stare out the window and wait for spring.”  While staring out of a window for several months may be a worthwhile way to spend our limited time on Earth, I wish to propose a marginally more enjoyable choice: watching gifs of top pitching prospects.

With the 2014 Arizona Fall League featuring several top pitching prospects, and with the plentiful high-quality videos posted on Youtube by our good friends at MLBProspectPortal.com, I was able to create a collection of gifs that showcase these pitchers’ talents.

Kyle Zimmer

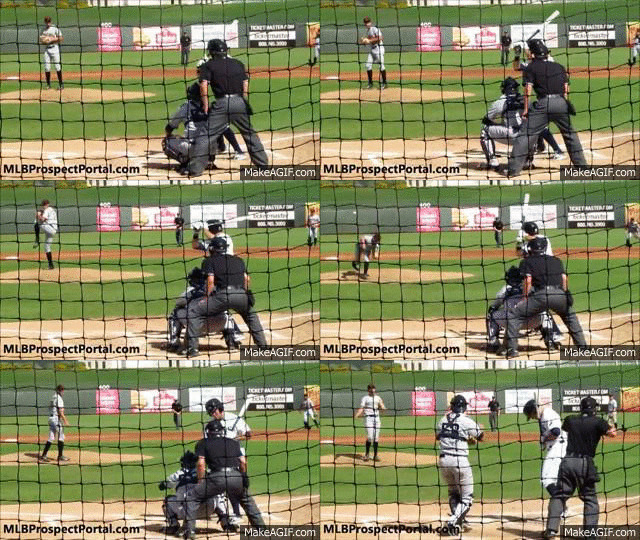
Zimmer finished the AFL with an incredible 41.7 K%.  Unfortunately, due to injuries, he only made three starts.  When he has been healthy, though, he has been known to throw mid 90’s fastballs and biting curveballs.  Below is a gif of his curveball thrown to Pirates’ outfield prospect, Josh Bell.  It should be noted both that Bell missed this curveball by a lot, and that he rarely swings and misses versus left-handed pitchers (9.9 K% against them).

Kyle Zimmer 2014 AFL

In the pitch following the curveball, Zimmer threw a high fastball that Bell couldn’t catch up to:

http://cdn.makeagif.com/media/11-26-2014/M0iguz.gif

In the pitch following the curveball/fastball combination, Zimmer threw either a changeup or two-seam fastball that had Bell out in front:

http://cdn.makeagif.com/media/11-26-2014/DmBK3j.gif

Tyrell Jenkins

A former 1st round supplemental draft pick by the Cardinals in 2010, Tyrell’s statistics have been erratic in the minors, including his 13.3 K%/7.4 BB%/4.31 FIP in High A in 2014.  His athletic frame and power stuff are still coveted, though, and the Braves acquired him in the recent Jason Heyward trade.  Below is a curveball from Jenkins to Addison Russell, who happens to be one of the top prospects in all of baseball:

http://cdn.makeagif.com/media/11-26-2014/CFVYNx.gif

Below is a high fastball to Dalton Pompey that resulted in a strikeout.

http://cdn.makeagif.com/media/11-26-2014/mPI9aR.gif

Archie Bradley

Archie Bradley is likely the most well-known name on this list, and some sources had him as the #1 pitching prospect entering this season. FanGraphs’ own Kiley McDaniel gave him a future 70 grade on his fastball, along with a future grade of 65 on his curveball.  Below is one such curveball thrown to Addison Russell:

http://cdn.makeagif.com/media/11-26-2014/g_VnqS.gif

Not content to merely acquire a strikeout against Russell, Bradley went with his fastball with good arm-side run to create a double play-inducing weak grounder:

http://cdn.makeagif.com/media/11-26-2014/r52BEN.gif

Tyler Glasnow

Tyler Glasnow posted a league-leading 31.9 K% and .171 opposing batting average  in 2014 in High A.  The third highest K% in the FSL was 23%, and the second lowest opposing batting average was .216.  These numbers may seem incredible to you, but they’re actually a step down from his 2013 season in Low A where he posted a 36.3 K% and a .141 opposing batting average.  You may have guessed that Glasnow has good stuff.  You’d be right.

Below, the batter sticks his bat out for a bunt and then spins back as if the pitch were going to hit him.  It was called a strike.

http://cdn.makeagif.com/media/11-26-2014/p2TYOo.gif

Finally, we have a called strike three on a curveball.  Notice the defeatism in the batter.; he has been bested by the pitcher but is glad that he has been allowed to keep his life.

http://cdn.makeagif.com/media/11-26-2014/FkmhjH.gif

*Credit for all of the videos goes to MLBProspectPortal.com.