The Horrors of Jackie Bradley Jr.’s 2014 Season
Jackie Bradley Jr. is not a terrible baseball player, and honestly he probably didn’t have a terrible 2014 season. Well at least, it wasn’t as bad as what people perceived. That, however, is due to his impeccable fielding and good baserunning. What follows will include none of that. It is rather a complete and utter breakdown of Bradley’s hitting performance, for 2014, and the trends he displayed. They, as you might have guessed, are not pretty.
First, it seems important to mention that Bradley’s numbers were great in the minors. Not just fielding but hitting as well. After A ball (Greenville), Bradley never had a wRC+ below 120 and he never had a BB% lower than 10%. Now BB% is not always predictive, as Chris Mitchell has displayed through his KATOH metric. KATOH, however, does show that BB% is predictive in AA and AAA, and Bradley’s BB% was good in AA and AAA.
Now on to 2014. This was suppose to be Bradley’s big break, it was supposed to be his year, he was going to replace Jacoby Ellsbury in center, and become the next great Red Sox center fielder. None of that happened; Bradley did play good defense but his offense was atrocious, finishing with a 47 wRC+.
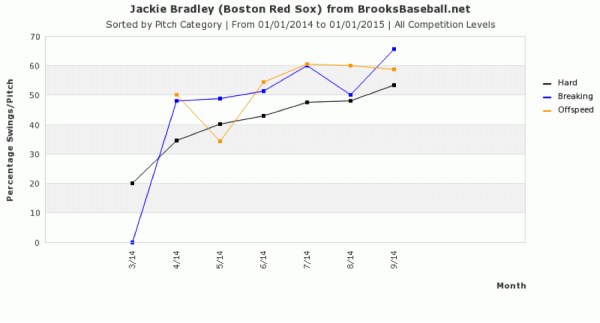
So what happened? How did a player lauded for not just his defense but also his hitting ability, finish the year with a 47 wRC+? First, let’s acknowledge that hitting is extremely difficult, especially at the major-league level. There are also many components that go into hitting and all of them have an impact on a why a hitter hits a certain way. It’s also important to look at how pitchers work a hitter, and I think that’s where will start. Below is a graph, of the hard, breaking, and off-speed pitches Bradley faced in 2014.
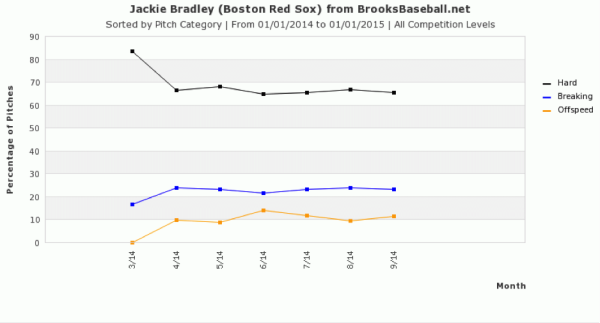
From this, it’s pretty evident that pitchers predominantly attacked Bradley with fastballs. This was after all his first major league season, and pitchers will often test young hitters or rookies with fastballs. If the hitter starts to hit the fastball well, then typically a pitcher will make an adjustment. As you can see, no adjustments were made because no adjustments were needed.
Now that we know what pitchers were throwing at Bradley, lets look at what Bradley did with those pitches. The graph below will display the outcome of Bradley’s at-bats in 2014.
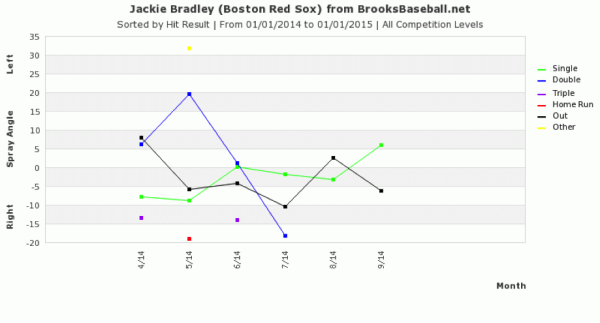
This is where my eyes started to hurt. Bradley, as you can see, got off to a good start, but everything fell off quickly after that. In fact, things fell apart so badly that Bradley didn’t get a single extra base hit in the last two months of the season. While I like this graph, in explaining Bradley’s struggles, I think the pie chart below will give you an even better example of just how bad Bradley was in 2014. The graph was provided by Baseball Savant.
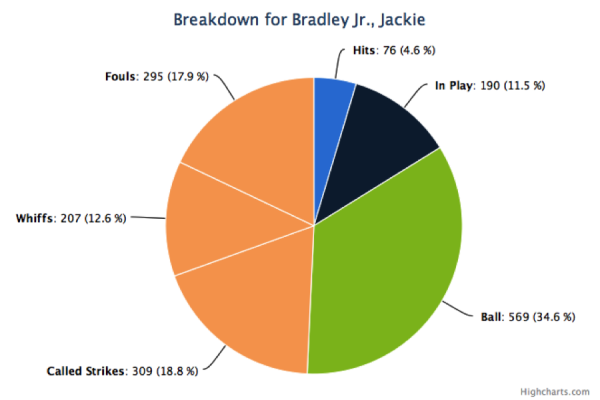
There are many outcomes that can come from a pitch: a foul, a whiff, a called strike, a ball, a ball in play, and finally a hit. Bradley, got a hit considerably less often than any other outcome. This is not a recipe for success. Hold on, let me clarify that. The fact that Bradley’s hits were his most infrequent outcome was not the problem. Mike Trout’s most infrequent outcome after all was his hits. The problem was Bradley’s 4.6 hit%.
Another problem here is that Bradley was simply not putting the ball in play enough, and the balls in play, unfortunately, were not resulting in enough hits (.284 BABIP). This, however, is only one of the problems. To get a better understanding of why Bradley didn’t get enough hits, it seems imperative that we examine where Bradley was hitting the ball. For this, we’ll look at a spray chart provided by Brooks Baseball, to examine exactly where Bradley was hitting the ball, and if there are any consistent trends.
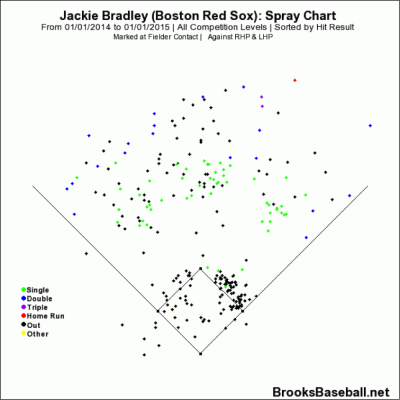
Here are the outcomes when Bradley put the ball in play. What is distinctively clear is that Bradley pulled the ball a lot, especially in the infield. He also doesn’t seem to have been hitting a lot of hard ground balls, which would explain his lack of hits in the infield. As you can see Bradley over a full season of baseball only mustered four hits in the infield and none the other way. The Red Sox have talked about working on Bradley’s swing, they’ve suggested that his swing is too uppercut-y and he needs to start swinging down on the baseball. From this chart it seems pretty evident why they want to do that. They probably want Bradley to be able to hit the ball the other way, not just in the air but also on the ground, as to maximize his ability to get hits.
While fixing a swing is important, it’s only one of the problems. There are more elements that go into hitting and someone doesn’t end up with a 47 wRC+ without some kind of approach problem. This is where we’ll take our final investigation, into Bradley’s plate approach and the tendencies he’s been displaying.
There are a few factors and components that can be attributed to a hitter’s approach. One of them is the hitter’s tendency to swing. The more one swings the less he is likely to be a patient hitter, and the less likely he is to have a good approach at the plate. Below is a graph of Bradley’s month-by-month swing percentage on hard, breaking, and off-speed pitches for 2014.
This as you might be able to tell is not good. Bradley’s tendency to swing got gradually worse as the year went on. This meaning that as the year went on Bradley either got further away from his approach or he simply got frustrated. Let’s not panic, however, just because a hitter has a high swing% doesn’t mean that he can’t be a successful hitter, especially if he makes contact on a lot of his swings. Vlad Guerrero was a great hitter and he swung at everything; he also hit everything. So let’s look at Bradley’s whiffs per swing (whiff/swing). Why? Well because if you’re swinging a lot, you don’t want to have a low whiff per swing rate because it means that most of the pitches you’re swinging at aren’t going to become hits. It also probably means you’re striking out a lot and that you’re chasing a lot of pitches.
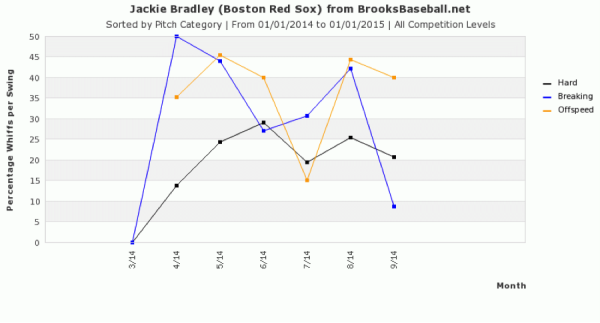
As you might be able to tell, Bradley in 2014 swung and missed a lot. I think it’s also important to note that in the last two months of the year, Bradley’s plate appearances were significantly reduced. He only got 35 plate appearances in August and only 36 in September. So while it might seem that in the last month, Bradley started swinging and missing less, that was in a very small sample size.
Finally, lets look at Bradley’s overall plate approach tendencies. What follows is a chart provided by Brooks Baseball that examines a players overall plate approach. It examines, through the use of PITCH f/x data his passiveness and his aggressiveness at the plate. It does this through the use of detection theory, which analyses the decisions one makes in face of uncertainty. There are essentially two parameters to detection theory, C and d’. C, which is the one used for this graph, reflects the strategy of the response. Ok, that’s enough on the subject.
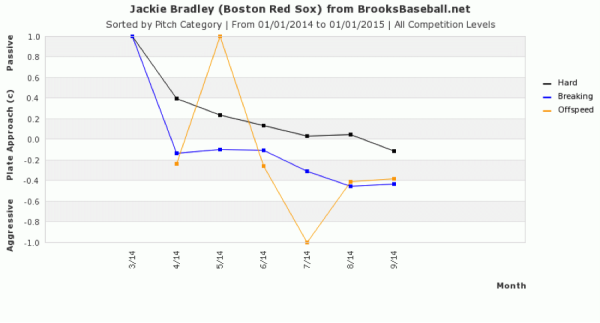
Just like Bradley’s swing tendencies, his overall plate approach was going in the wrong direction. Throughout the year, Bradley had consistently gotten more and more aggressive. He’s essentially lost what made him a successful hitter in the minors. These are the signs that probably made the Red Sox sign Rusney Castillo from Cuba to a seven-year deal. It also might be a reason why the Red Sox are in serious talks with the Braves about a potential trade involving Bradley.
That being said, while it is certain that Bradley’s tendencies and approach were all heading in the wrong direction, this doesn’t mean that he can’t turn things around. Players make adjustments all the time, and I’m not sure that these stats are necessarily predictive of future performance. Baseball after all is a game of adjustments, pitchers make adjustments on hitters, and then the hitters counter with their own adjustments. It doesn’t seem that Bradley will ever be a great hitter or even a good hitter, but what he can be is a league-average hitter. I’ve spent a lot of time discussing Bradley’s offense and not nearly enough on his defense. Bradley is a great defensive center fielder, maybe the best, and that has real value. If Bradley can simply become an average hitter, he should have a spot in the majors for many years to come.
All graphs can be found on Brooks Baseball and the circle graph on Baseball Savant. A lot of the stats can also be found on FanGraphs.
Julien Assouline is a journalism student at Ryerson University, and writes for Baseball Prospectus Milwaukee. Follow him on Twitter @JulienAssouline.
Nice work! I really think this would benefit from including his zone percentages, especially when discussing his swing rate. The increase in swings could have come from pitchers throwing more strikes as they were less afraid of the results.
Ya your definitely right. All keep that in mind for next time. Thanks for the advice.
Although the plate approach (c) is designed to take a hitters plate discipline into account.
Cool work. The fact that he still managed to “put up” an overall WAR of -0.1 with that wRC+ is astounding.
Ya he was like a fun baseball experiment, of just how bad you can be on offence and yet be better than replacement level.
“The problem was Bradley’s 4.6 hit%.”
Mike Trout’s hit% was only 5.5.
Carlos Santana, Adam Dunn, Josh Willingham all had lower hit% than Bradley but still managed wRC+ above 110. Big difference (apart from hitting the ball harder when they did connect) for those three guys compared to Bradley is they all had at least 41% balls, compared to Bradley’s 35%.
Jon Singleton looks like he had more pitches/PA than anyone else, and less pitches (3.2%) turn into hits than anyone else in the majors last year. Suspect that the 10.9% of pitches put in play was the lowest of the year, too. Makes Bradley’s 15.1 look reasonable.
I think it’d be interesting to see how balls in play/total strikes would look as a leaderboard. Singleton’s 18.3%, Bradley’s 24.7%, carlos santana’s was 26.5, and a free swinger like Marlon Byrd, who turned 6.6% of pitches into hits is also around 25%.
Hi Matt thanks for the comment,
Carlos Santana’s hit% was 4.4 which was basically the same as Bradley and you just described three power hitters and one wana be power hitter. Bradley as displayed in the majors is not that, .68 ISO. If he wants to survive in the majors he needs to become more of a contact hitter. Bradley also didn’t put the ball in play enough he ranked 14th in the league in K% last year, with guys who had at least 400 PA and he had by far the worst ISO out of anyone near his K%. Essentially meaning that he is not hitting the ball hard enough when he is able to make contact. The point I was trying to make was that he needs to either hit the ball harder or make more contact. Maybe the chart I used was not the best way to display that. I just thought it was a creative and fun way to show the information. Also the point of the chart was merely to display one of the problems with Bradley’s AB’s not the hole thing. Finally I don’t see the relevance of the Balls% or any of the Jon Singleton references. Jon Singleton sucked last year the reason he had a higher wrc+ was because again he hit for more power. Comparing the two is illogical. Bradley’s low hit% is relative to his player type.
Singleton’s not relevant, he was just interesting for being even worse than Bradley, almost certainly worst in the league, at the same things.
Most of the rest is simply thinking aloud about potentially interesting ways to look at it, see how else Bradley might be compared to others.
Compared to other guys with minimal power, Bradley sees more pitches/PA.
Compared to other guys who turn so few pitches into hits, Bradley takes a lot less balls, and has far less power.
I’m not sure that being more aggressive is a step in the wrong direction, as you assert. Most (all?) speedy, low power slap hitters are more aggressive than Bradley was, less pitches/PA, more swings, higher % of pitches put in play.
That’s a really good point Matt although as Bradley got more aggressive, his numbers got even worse. Now does that mean that a more aggressive approach is the wrong strategy? No and to be honest I have no idea which strategy would be good for Bradley. Maybe being more aggressive will garner better future results, however that remains to be seen.