K-BB vs. the RotoGraphs Top Starting Pitcher Rankings
Back on January 1, I wrote an article proposing a “quick-and-easy” way to rank starting pitchers for fantasy baseball. The TL; DR (Too Long; Didn’t Read) summary is that you can take the projections of your starting pitchers and rank them by the simple metric “strikeouts minus walks” (K-BB). I also looked at slightly more complex metrics like “strikeouts minus walks minus home runs” (K-BB-HR) and “strikeout rate minus walk rate, divided by games started” (K%-BB%/GS) and both of those had a slightly better correlation, but are not as simple.
The correlation between the starting pitcher rankings based on K-BB and starting pitcher rankings based on dollar values was around 0.80 for each of the last three years.
At the time, I created a list of the top starting pitchers based on Steamer projections, as those were the only readily available projections out there. Now that we’re getting closer to the season, more projections are available. At Fantasy411, they have a downloadable spreadsheet with the composite projections from 12 different providers. It’s a true “wisdom of the crowds” approach.
Using this collection of projections, I ranked the starting pitchers using the very simple K-BB metric and compared those rankings to the consensus rankings for starting pitchers on the updated RotoGraphs Top 300. I downloaded the spreadsheet from the post on February 17th by Paul Sporer where he explained that players not ranked by a writer would get a “last ranked+1” for that particular player. There were 87 starting pitchers ranked in the Top 300. [Note: I would have used K-BB-HR but the composite projections did not have home runs allowed for pitchers]
First off, the correlation between the RotoGraphs Top 300 rankings for these 87 starting pitchers and my rankings based on K-BB came out to 0.81. Also, 46 of the 87 pitchers (53%) were within 12 spots of each other on the two lists, or the equivalent of one round in a 12-team league. Seventy-four of the 87 pitchers (85%) were within 24 spots of each other, the equivalent of two rounds in a 12-team league.
The charts below show the starting pitchers based on the RotoGraphs Top 300, along with their rank by K-BB, the difference between the two, and the composite projection from the Fantasy411 sources for selected pitchers who were off by a significant number of picks. By looking at the projections for these pitchers, we may better understand why the rankings differ so much.
The Top 20:

Most of the pitchers in the top 20 are similarly ranked by the RotoGraphs’ Five and the K-BB method. Just one of these 20 pitchers has a rankings difference that is off by more than 12 (one round in a 12-team league). Carlos Carrasco has the biggest difference in this group of pitchers between his K-BB rank of 44th and his RotoGraphs’ rank of 16th. Carrasco is a popular sleeper. He’s such a popular sleeper that he’s probably no longer a sleeper. I think most people are wide-awake on Carlos Carrasco by this point. The composite projection has Carrasco down for 156 innings in 2015. Steamer projects 163 innings, ZiPS has him for 119, and the optimistic Fans are projecting 191 innings, which is more than Carrasco has pitched in the last two seasons combined.
The Next 20 (21-40)
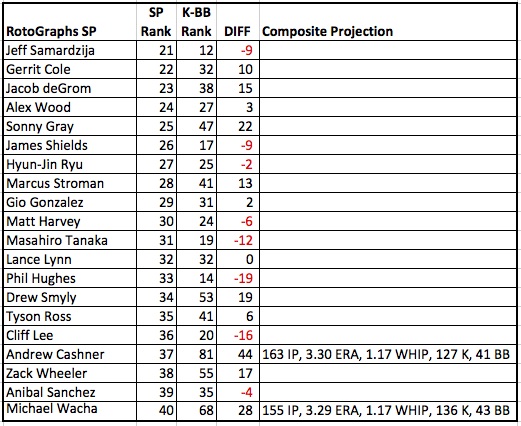
There are more differences as we move down the list of starting pitchers. Sonny Gray (ranked 25th by RotoGraphs, 47th by K-BB) is an interesting guy to look at. For his career, Gray has a 2.99 ERA and 1.17 WHIP, but his FIP is 3.39, xFIP is 3.34, and SIERA is 3.44. Gray’s ERA and WHIP have been helped by a .277 career BABIP. That’s quite low, but Oakland as a team allowed a .276 BABIP in 2013 (2nd best in baseball) and .272 BABIP in 2014 (tops in baseball). If you expect that to continue, then Gray is probably better ranked by the RotoGraphs Five. Steamer (3.75 ERA, 1.29 WHIP) and ZiPS (3.36 ERA, 1.26 WHIP) are not so optimistic.
Phil Hughes’ impressive ability to limit bases on balls might have him ranked too highly by K-BB.
Andrew Cashner has the second largest difference between his ranking by K-BB (81st) and RotoGraphs (37th) of any pitcher in the RotoGraphs Top 300. Cashner has a history of injuries and he’s on record as saying he’s focusing more on getting quick outs than strikeouts. Over the last two seasons, his K% has been 18.1% and 18.4%. That 18.4% mark last year placed him 80th among pitchers with 120 or more innings. His 5.7% BB% placed him 41st and that was the best BB% of his career. Looking at just strikeouts and walks it’s easy to see why Cashner is ranked by K-BB among pitchers like Matt Cain and Jon Niese rather than Cliff Lee and Zack Wheeler (Cashner is between those two in the RotoGraphs starting pitcher rankings).
The Next 20 (41-60)

Garrett Richards’ composite projection calls for 137 strikeouts in 160 innings, which comes out to a 7.7 K/9. Steamer and ZiPS both project Richards to strike out around 8.2 batters per nine innings. If Richards’ composite projection is upped to a strikeout rate of 8.2 K/9, he would move up to 64th on the K-BB list.
Dallas Keuchel was very successful last year, posting a 2.93 ERA and 1.18 WHIP despite a middling strikeout rate (6.6 K/9). He succeeded last year with a terrific ground ball rate (63.5%) and by allowing far fewer home runs than he had in his first two years in the big leagues. The K-BB metric ranks Keuchel 77th among starting pitchers based on the two things a pitcher has the most control over.
Justin Verlander and Ian Kennedy are the two pitchers with the biggest difference in rankings in favor of K-BB over the RotoGraphs Five rankings and Drew Hutchison and Scott Kazmir are both in the top seven. Verlander is coming off an ugly 4.54 ERA, 1.40 season in which his strikeout rate dropped just below 7.0 K/9 after being around 9 K/9 for the bulk of his career. The composite projection expects his strikeout rate to go back up to 7.7 K/9 and his ERA to come down close to his 2014 FIP of 3.74. With a projection of 208 innings, Verlander is ranked 25th by K-BB, 34 spots ahead of where he’s ranked by the RotoGraphs’ writers. Similarly, Ian Kennedy is ranked 23rd by K-BB and 55th by RotoGraphs. He’s coming off a better year than you might realize, with 9.3 K/9 and a 3.21 FIP, but a 3.63 ERA.
The Final 27 (61-87)

In this final group of pitchers, the guys that K-BB likes much more than the RotoGraphs’ writers include John Lackey, Mike Minor, and A.J. Burnett. It’s possible that Lackey (36 years old) and Burnett (38 years old) were ranked lower by the RotoGraphs’ writers because of expected age-related decline. Also, Burnett had a 4.59 ERA and 1.41 WHIP with the Phillies in 2014. The composite projection may be looking at the 38-year-old Burnett through rose-colored glasses when he’s projected for 195 innings and an ERA below 4.00, but he has pitched an average of 202 innings over the last seven years and had 213 2/3 innings last season. Like Burnett, Minor is coming off a terrible year—4.77 ERA, 1.44 WHIP, which has him ranked 77th by the RotoGraphs Five. As bad as his results were in 2014, Minor’s strikeout rate was in the range of his two previous seasons and his walk rate was only slightly worse than his career mark. After the season he just had he’s a potential buy low candidate based on K-BB.
The three pitchers in this group who are much higher ranked by the RotoGraphs writers are James Paxton (the biggest difference in ranking of all the pitchers on this list), Tanner Roark (4th largest difference), and Henderson Alvarez (5th largest difference). Paxton (143 innings) and Roark (122 innings) have low playing time projections that limit their K-BB value. Henderson Alvarez is projected for a solid 182 innings, but with a projected strikeout rate of just 5.3 K/9 he gets little love from the K-BB metric.
This comparison included all 87 pitchers who were ranked in the RotoGraphs Top 300. The following pitchers are among the top 87 when ranked by K-BB and don’t show up on the RotoGraphs Top 300:
#60 CC Sabathia
#69 Wade Miley
#74 Bartolo Colon
#79 Yovani Gallardo
#81 Bud Norris
#84 Jon Niese
#84 Ricky Nolasco
#86 Trevor Bauer
I plan to revisit this at the end of the year. I’ll compare the RotoGraphs’ rankings and the K-BB rankings for these 87 pitchers to the actual end of season dollar value rankings for starting pitchers in 2015.
Bobby Mueller has been a Pittsburgh Pirates fan as far back as the 1979 World Series Championship team ("We R Fam-A-Lee!"). He suffered through the 1980s, then got a reprieve in the early 1990s, only to be crushed by Francisco Cabrera in 1992. After a 20-year stretch of losing seasons, things are looking up for Bobby’s Pirates. His blog can be found at www.baseballonthebrain.com and he tweets at www.twitter.com/bballonthebrain.
Very nice! Thanks.
This article begs to go back a few years and see how the categories compare historically.