Speculating the 2016 Toronto Blue Jays Lineup

We’re halfway through November and the winter meetings are right around the corner. Teams are gearing up for next year and taking a look at their rosters, deciding what direction they want their team to head. Today I want to look at the Toronto Blue Jays and hypothesize a direction they could go.

The Blue Jays had a great 2015 and continuing that momentum is crucial for the newly recharged fan base. They have a number of quality young players who contributed this past year. Kevin Pillar, Chris Colabello, Ryan Goins, Marcus Stroman, Roberto Osuna and Devon Travis (when healthy) all had nice seasons and remain under team control in some shape or form for the next 3-5 years. The Jays also have some large expiring contracts after the 2016 season in the form of R.A. Dickey, Edwin Encarnacion and Jose Bautista who have been important pieces to Toronto’s success. Add in Russell Martin, Josh Donaldson and Troy Tulowitzki and the Blue Jays should once again compete in the AL East in 2016. One of the glaring issues however is their starting rotation and bullpen.

With Marco Estrada signed the Blue Jays have a starting rotation of Dickey, Stroman, Estrada and Hutchison. Reports have come out and the Jays will reportedly have a similar budget to last year, around $140 million. After the guaranteed contracts, arbitration estimates and league-minimum salaries are accounted for the Blue Jays will have about $18-$19 million to spend on starting pitching and bullpen help. There are a number of directions the Blue Jays could go; it’s a solid class of starting pitching this year and with the $18 million left in the salary they could for sure pick up a quality starting pitcher to fill out the rotation. They could also spent the money on a lockdown relief pitcher and try to transition either Aaron Sanchez or Roberto Osuna to the rotation. Or they could split up the money and get an older starting pitcher and get whatever reliever is available for the remainder of the money. Another option, and the one that I’m going to explore, is the trade route.

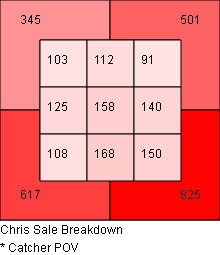
With all the moves the Blue Jays made at the deadline, their farm system isn’t as strong as it was at midseason last year but the recent developments with the Atlanta Braves got me thinking about trade ideas — mainly Julio Teheran. With the Braves set to open a new stadium in 2017 the mentality has been to shed money and stock prospects for the opening season in the new stadium. This works out great for the Blue Jays who have some talent left in the farm system that could be useful to the Braves. The fourth-ranked prospect in the Blue Jays system and coincidentally the fourth-ranked catching prospect in baseball is Max Pentecost. Atlanta has been stocking arms in recent trades but with Christian Bethancourt struggling in his time in the majors, the Braves clearly don’t have a long-term solution behind the dish. The former 1st round pick, 11th overall is currently in advanced-A ball and his estimated time of arrival in the majors is 2017, perfect for their rebuilding plans. If the Jays were to include one maybe two young pitchers on a similar timeline like Conner Greene and/or Marcus Smoral, perhaps that would be enough to pluck Teheran away from Atlanta.

Teheran is only 24 years old and will turn 25 for the 2016 season. He’s owed a bargain-basement price of $3,466,666 for next season, is under contract through 2019, and has a club option for 2020. With starting pitcher salaries estimated anywhere from $10-$25 million and up this offseason, Teheran and his $3.5 million in 2016 season seem like a steal. Plus the Blue Jays would be getting Teheran for the prime years of his career and although last year was an off year, he’s shown signs of being an ace. Teheran would complete the starting rotation for the Jays in 2016 and after Dickey’s contract expires, Toronto would be left with a rotation of Stroman, Teheran, Hutchison and Estrada for the 2017 season. The other nice thing about Teheran is that his $3.5 million contract leaves Toronto with roughly $15.5 million left over to fill out the bullpen or upgrade other areas. Teheran would be an affordable and valuable piece to a rotation that desperately needs it and would be far better then spending 3 to 4 times his annual 2016 salary on a pitcher that may already be or not far away from the decline of his career.

As I mentioned above, with the money saved on the Teheran trade, the Blue Jays could add a piece to the bullpen or upgrade other areas but in compiling data for this article, I got to thinking about what the Jays could do for the future. 2017 has roughly $36 million coming off the books for Toronto and with a young core of controllable players, the Jays have some room to make a move. One of the contracts expiring is RF Jose Bautista. I personally think the Jays should re-sign Bautista after 2017 but I don’t think putting him in right would make sense. With Encarnacion’s contract set to expire as well, the DH spot would be available for Bautista, should he choose to stick around. That would leave RF empty and looking at the outfield class of 2017 (Beltran, Suzuki, Gregor Blanco, Josh Reddick, Brandon Moss, Mark Trumbo and of course Bautista) the group leaves something to be desired.

That brought me to the 2016 class, led by arguable the best right fielder in the game, Jason Heyward. The Jays have been rumored to be after SP free agents David Price and Zack Greinke but for the amount of money they’ll command and the stages they’re at in their career, I think the money might be better spent on a player whose best days are ahead of him. That in my opinion is Jason Heyward. We know Heyward is a solid player, who’s shown flashes of brilliance and is young enough to still put it all together consistently. In a lineup like the Blue Jays’, Heyward would thrive much the way Josh Donaldson officially broke out as a superstar last year. Heyward would have the protection and opportunities to truly develop into the player he’s about to get paid to be. The problem with signing Heyward would be the Blue Jays would have to free up a sizable amount of money and the only real place to look is at shortstop in the form of Troy Tulowitzki.

Tulowitzki was a surprise addition for the Blue Jays last year and definitely added strength to an already dangerous lineup but with the depth that Toronto has with Ryan Goins able to play SS and the return of Devon Travis, the 31-year-old Tulowitzki becomes an expensive option for the remainder of his career. Perhaps the Jays should trade Tulowitzki to free up money to sign Heyward to a long-term deal? Instead of watching the expensive decline of Tulo for the remainder of his contract, Toronto could still sell high to a team willing to take on the contract, receiving bullpen help and possibly an extra outfielder to help address current needs.

I then started going through MLB teams to see which ones would possibly be in a situation to make the trade happen. The Diamondbacks, White Sox and Mets all stood out as possible suitors while the Rangers, Yankees, Padres and Mariners also seemed like possible options. For the purposes of this article I’m only going to focus on the first three.

With a 2015 budget of about $76,622,575 million the Arizona Diamondbacks definitely have room to financially take on Tulo’s contract; the question is, is that where LaRussa and Dave Stewart want to take the team? None of us truly know but if the asking price is right, perhaps Randall Delgado and Ender Inciarte, maybe the thought of Tulo and Goldschmidt would fit their plans. They did spend $68.5 million for 6 years of Yasmany Tomas and with the emergence of David Peralta and A.J. Pollock, the Diamondbacks have outfielders to spare. If the trade were to go through the Blue Jays would gain about $18,487,000 giving them a total available amount of about $33,980,334. That would definitely be enough to sign Heyward to a 7-10 year deal (depending on what the market drives his year amount to) at anywhere from $20-$29 million per season. With the $36 million coming off the books in 2017, Toronto would have about $37 million to spend on the DH spot (Possibly Bautista) and SP or RP spot open (depending on how they handle Sanchez and Osuna). Compared to the $50 million amount they could have in 2017 minus whatever they pay for a starting pitcher this off season. In reality that $50 million would probably be more like $30-$35 million with two rotation spots available as well as the DH. If the Teheran trade and Heyward signing were to happen, here is what the 2016 and 2017 Blue Jays lineup would look like.

2016 Lineup                2017 Lineup

C = R. Martin                C = R. Martin
1B = E. Encarnacion    1B = C. Colabello
2B = D. Travis              2B = D. Travis
3B = J. Donaldson       3B = J. Donaldson
SS = R. Goins                SS = R. Goins
LF = B. Revere              LF = B. Revere
CF = K. Pillar                CF = K. Pillar
RF = J. Heyward         RF = J. Heyward
DH = J. Bautista          DH = ?

SP = R.A. Dickey                 SP = M. Stroman
SP = M. Stroman                 SP = J. Teheran
SP = J. Teheran                   SP = D. Hutchison
SP = D. Hutchison            SP = M. Estrada
SP = M. Estrada                   SP = ?

RP = R. Osuna                     RP = R. Osuna
RP = A. Sanchez                  RP = A. Sanchez
RP = L. Hendricks              RP = L. Hendricks
RP = B. Cecil                        RP = B. Cecil
RP = R. Delgado                  RP = R. Delgado
RP = S. Delabar                   RP = S. Delabar
RP = A. Loup                        RP = A. Loup

BN = E. Inciarte                   BN = E. Inciarte
BN = J. Thole                        BN = D. Pompey
BN = C. Colabello                 BN = ?
BN = D. Barney                     BN = ?

If Heyward’s contract was structured so that his first year was set at $20 million, the Jays would enter 2016 with about $13-$14 million left in the budget for any additional moves. It would also shore up right field a year before it’s an issue while upgrading the bullpen and perhaps leading the way for Sanchez or Ozuna to enter the rotation for 2017. The point is Toronto has money coming available next year but in order to get the player that best fits their future needs, they might have to make a move now instead of waiting till next year.

The next team I thought might make sense as a trade partner was the Chicago White Sox, who recently released long time SS, Alexi Ramirez. The White Sox had a budget of $118,860,487 in 2015 and were supposed to be contenders with the additions of Melky Cabrera, Jeff Samardzija, David Robertson and Adam LaRoche but instead fell way short and put together an all-around forgettable season. With the release of Ramirez, shortstop seems to be an area of need for Chicago, and Tulowitzki with Abreu, Cabrera and LaRoche would be a great fit on the south side.

Unlike the Diamondbacks however the White Sox don’t have as much potential new money available, so off-setting the cost of Tulo’s contract would have to be taken into account when thinking about a trade. Someone like Zach Duke, who is owed $5,000,000 over the next two years might be a good addition to the Toronto bullpen. If the Sox would somehow include often-injured Avisail Garcia, this trade might really swing in Toronto’s favor but really saving money for a Heyward run would be more important then any name on the back of a jersey.

For argument’s sake I’m going to use the Duke/Garcia for Tulowitzki trade as an example. The difference in salaries would be about $12.7 million and that added to the $15,493,334 left over after the Teheran trade, Toronto would have about $28,193,334 left over to make Heyward an offer. And again, if the contract was structured so that the first year paid Heyward $20 million, the Blue Jays would have about $8 million left over for additional offseason/mid-season upgrades.

The last team that I thought would make sense for a potential Tulo trade was a team that was linked to him while he was still in Colorado, the New York Mets. Coming off a spectacular run to the World Series, the Mets are set to lose Yoenis Cespedes and Daniel Murphy to free agency. In 2015 they had a payroll of $120,415,688 and Cespedes and Murphy combined for $11,729,508 of that total budget, over half of what Tulowitzki is owed going into 2016. For the Mets, their quality rotation is under team control or earlier arbititration for the next few years, so continuing the winning environment at a fraction of the cost is of utmost importance. The health of David Wright is suspect and with a nice young group in Conforto, d’Arnaud, Duda, and Lagares, trading for someone of Tulo’s caliber might help their development and continue the winning environment.

The Mets would be in the same situation that the White Sox are — they can’t add too much salary, so off-setting costs would play into the equation. If the Mets traded Jonathan Niese, who’s owed about $9 million in 2016, and Kirk Nieuwenhuis, they’d clear about $10,688,729. Add that with the money saved from letting Murphy and Cespedes walk and they could easily bring in Tulowitzki’s contract. The Blue Jays would have about $26 million to work with and again, if Heyward’s first year was set at $20 million, they’d have about $6,182,063 to work with for offseason/mid-season upgrades.

All of this is unauthorized speculation but I do think that the Blue Jays are in a unique situation where they can really make some moves that could set them up for years of success. Chasing the big-name starting pitchers may seem like the obvious move but taking advantage of other team’s situations could allow them to acquire elite talent for minimal cost and the money saved on starting pitching could be used to solve future needs that aren’t quite here yet. As always, thanks for reading and let me know what you think.


Explaining Brandon Crawford’s 2015 Power Surge

Brandon Crawford is coming off an All-Star season in which he not only won his first Gold Glove, but his first Silver Slugger as well. The last to win both awards in San Francisco? Barry Bonds in 1997. Although Crawford may not have all the tools that Bonds did, he has come a long way since he made his debut at shortstop for the Giants in May of 2011. Crawford entered the league projected as a shortstop with plus defense, but also as an offensive project. So what sparked him to have the second-most home runs (21) among all shortstops, more than his totals from 2013 and 2014 combined, and a SLG% of .462 that led the all other qualified shortstops in the league by more than 20 points? An aggressive approach at the plate paired with slight mechanical adjustments. Consider Crawford’s Z-Swing%:

BC_Z-Swing

Now consider his hard-hit%:

BC_Hard

These graphs, courtesy of data from FanGraphs, tell an interesting story. For the first four years of his career, Crawford’s Z-Swing% and hard-hit% had a direct correlation. In the first two years of his career, Crawford had a Z-Swing% that was barely above average in the league and a hard-hit% that was below average. Last year, however, his Z-Swing% skyrocketed to more than 8% above league average and he had a hard-hit% that was, for the first time in his career, above average. Yet, there is something odd about his recent success at the plate.

Crawford was not making more contact than in the past; he had just improved on the quality of contact with his new swing and more aggressive approach. Last year, he posted the 16th-worst SwStr% (percentage of swings and misses) in the league at 13.6% and a below-average 73.6% Contact%. Crawford also showed more aggression on pitches outside the zone, posting an O-Swing% (percentage of swings on pitches outside the zone) of 35.2% which is also worse than the league average of 31.8%. All of these were the worst numbers in their respective categories for his young career.

Despite all of this, his aggression at the plate and his change in mechanics led him to become a top power hitter at his position last year and a legitimate threat in the second half of the Giants batting order. Although the trend in these numbers may be hard to fully validate due to the small sample size, the new-found pop in the bat could make Crawford a much more valuable player (as finding power among shortstops in today’s league is a rarity). If his Z-Swing% and hard-hit% continue to be linearly related, Crawford may very well continue his progress in 2016 and bring power to a Giants lineup that was fourth to last in total home runs last season. One thing is for certain: his flow will remain among the game’s elite.

(pearlswithplaid, pearlswithplaid.blogspot.com)


Collateral Damage of the Strikeout Scourge

In my first article for FanGraphs Community, I noted, in the summer of 2014, that batters were being hit by pitches at a near-record pace. Here is a graph showing the number of plate appearances per hit batter, from 1901 to present. I’ve reversed the scale—fewer plate appearances between HBP mean that batters are getting hit more frequently—in order to illustrate the steady climb from the World War II years to today. While the hit batter rate has flattened out since 2001 (the high point on the chart), the rate in 2015, a hit batter in every 115 plate appearances, is the 14th highest in major league history.

After I cast about for an explanation for the rise, a commenter came up with what I believe is the best explanation: strikeouts (or, as the Cistulli-designated viscount of the internet, Rob Neyer, has dubbed it, the strikeout scourge). Or, more specifically, the increase in pitchers’ counts vs. hitters’ counts during at bats. When the pitcher is ahead in the count, he is more likely to target the margins of the strike zone, either to try to get the batter to chase or to set up the batter for the next pitch. When the batter’s ahead, the pitcher doesn’t have that luxury, and must focus more on pitching in the zone for fear of losing the batter to a walk. When a pitcher’s aiming for the inside edge of the zone and misses inside, the batter can get hit.

For example, here are career zone breakdowns for Chris Sale (who was a co-leader in hit batters in 2015) against right-handed hitters. At left is his location on 0-1, 0-2, and 1-2 counts. The chart at right shows 1-0, 2-0, 3-0, 2-1, 3-1, and 3-2 counts. The charts are from the catcher’s point of view, so the left side represents inside pitches. When Sale’s ahead in the count, 38% of his pitches are in the five leftmost zones. When he’s behind, that proportion drops to 31%. That’s typical. (What’s not typical is that Sale is ahead in the count a lot more than he’s behind, but you probably already knew that. Images from Baseball Savant.)

              Ahead in the count                          Behind in the count

This dynamic was clearly evident in the past season. When looking at plate appearances that ended when the pitcher was ahead in the count, batters were hit once in every 90 plate appearances. In plate appearances that ended with the batter ahead in the count, batters were hit once in every 254 plate appearances. Batters were nearly three times as likely to be hit by the pitch when they were behind in the count.

This raises a question: what other outcomes are affected by the count? We know that batters don’t do as well in general when the pitcher’s ahead. Are there outcomes other than batting average and slugging percentage that are affected by pitcher’s count?

Before answering that, I wanted to verify that pitchers are, in fact, increasingly ahead in the count. With rising strikeout rates and falling walk rates, this would seem to be tautological, but I checked anyway. I looked at the counts on which plate appearances ended for every year from 2001 to 2015. For example, in 2015, there were 183,628 plate appearances in the majors. 60,513 ended with the batter ahead (1-0, 2-0, 3-0, 2-1, 3-1, 3-2), 62,0553 ended with the count even (0-0, 1-1, 2-2), and 61,062 ended with the pitcher ahead (0-1, 0-2, 1-2). Here’s how they’ve tracked:

I didn’t go back further than 2001, but that’s not because I was being selective; it’s because the data from 2001 forward tells the story. Prior to 2001 the trends simply continued. In 2000, batters were ahead in 38% of plate appearances and pitchers in 28%, compared to 35% and 30% in 2001. The advantage to pitchers has fairly steadily expanded. I think we can say with some confidence that the past two seasons are the first two in modern baseball history in which more plate appearances ended with the batter behind than with the batter ahead.

So, having established that there are indeed more pitchers’ counts, what events are most affected by this change? To find out, I calculated the frequency of outcomes in 2015 on plate appearances with the batter ahead compared to plate appearances with the pitcher ahead. For example, in the 60,513 plate appearances that ended with the batter ahead, there were 13,501 hits. That works out to 4.5 plate appearances per hit. In the 61,062 plate appearances that ended with the pitcher ahead, there were 12,311 hits, or 5.0 plate appearances per hit. The p value for those two proportions, given the sample sizes, is 0. In other words, the difference is statistically significant, and we can safely say there is a difference in hit frequency when ahead in the count compared to behind in the count.

Here’s the full list:

According to this analysis, when the pitcher’s ahead in the count, it results in a decrease in hits, doubles, triples, home runs, and sacrifice flies. When the pitcher’s ahead, it results in an increase in stolen-base success rate, hit batters, sacrifices, and wild pitches. Those mostly make intuitive sense: when the pitcher’s ahead, the batter’s more cautious with his swings, resulting in fewer hits and less power. Similarly, when the pitcher’s ahead, he’ll work away from the heart of the plate, and misses become wild pitches and hit batters. By contrast, when the pitcher’s behind, he works closer in to the strike zone, resulting in pitches that are easier for the catcher to handle, lowering his pop time and increasing the chance of catching the runner on a steal attempt. (Max Weinstein illustrated last year that caught stealings are more likely on pitches in the strike zone.) The increase in sacrifices seems non-intuitive, since 0-2 and 1-2 counts usually shoo away the bunt due to the risk of a strikeout on a foul ball, but 0-1 counts make up for it. Batters were more likely to successfully sacrifice on 0-1 counts (1.4% of 0-1 plate appearances) than any count other than 0-0 (2.7%) in 2015.

Given that pitchers’ counts have increased and hitters’ counts have decreased, this model would predict changes in outcomes for which the differences are statistically significant. I looked at the frequency of hit batters, sacrifice flies, and wild pitches, along with the stolen base success rate, for 1979-1981 (the recent low-water mark for strikeout rate) and 2013-15. I excluded sacrifices because they’re both down sharply due to strategic reasons (managers are calling for fewer bunts) more than anything else. They results are consistent with the model.

  • Strikeouts per plate appearance: up 61%
  • Hit batters per plate appearance: up 98%
  • Sacrifice flies per plate appearance: Down 16%
  • Wild pitches per plate appearance: up 39%
  • Stolen-base success rate: up 7% (though that increase, from 66% to 73%, is probably largely strategic, since there are were 54% fewer stolen base attempts per plate appearance in 2013-15 than 1979-81, even though that may not make sense)

The graphs below, while admittedly busy, track the offensive events for which the analysis of 2015 count-related data indicated statistical significance (again, excluding sacrifices). I’ve selected the past 30 seasons. First, the affected base hits (total hits, doubles, triples and homers):

Offense rose through the 1990s despite rising strikeouts but has fallen since.

Now, the less intuitive outcomes of hit batters, wild pitches, sacrifice flies, and stolen-base success:

As the 2015 count data suggest, increased strikeouts, and therefore increased pitchers’ counts, has yielded more wild pitches, fewer sacrifice flies, a higher stolen-base success rate (though, again, that’s probably a reflection more of strategy), and, most significantly, way more hit batters (73% higher than in 1986; I truncated the scale in order to make the rest of the graph more readable).

This isn’t to suggest that these changes are solely a result of pitchers getting ahead in the count more frequently, but it does seem to be a contributing factor. Admittedly, much of the fallout from the rise in strikeouts is pretty unremarkable. There are more strikeouts and fewer walks now than in the past, so the pitcher’s ahead in the count more and the batter’s ahead in the count less; that’s unremarkable. That’s resulted in less offense — specifically, fewer hits overall and fewer extra-base hits; that’s also unremarkable. What I find more interesting are the other trends trends unrelated to strategy: the increase in hit batters and wild pitches and the decrease in sacrifice flies. It’s easy to get upset about batters getting hit by pitches, pitches rolling to the backstop, and difficulties in driving in runners from third with fewer than two outs. What’s less apparent is the degree to which those events can be linked, like lower scoring, to the rise in strikeouts.


Get Nasty: Quantifying a Pitcher’s “Stuff”

This article was co-authord by Daanish Mulla (@DanMMulla)

A New York Times article by John Branch in October 2015 discussed the elusive definition of the pitching term “stuff”. Talk of “plus stuff” and feelings of “all the stuff being there” was scattered throughout the article. Despite interesting commentary discussing the ability for pitchers to over-power hitters, there was no true definition of the nastiness of a pitcher’s stuff.

Earlier this November, Eno Sarris wrote an article examining who had the best changeup in the 2015 season. This was evaluated by looking at the difference in speed and movement with respect to the pitcher’s fastball. This made us think, to truly quantify “stuff”, you would first need to understand what goes into a pitcher having a truly dominant repertoire.

Our definition of a pitcher’s “stuff”, or their overall nastiness, was based on three different factors: 1) fastball velocity; 2) change of velocity of a secondary pitch with respect to the fastball; and 3) movement with respect to the fastball. We downloaded all of FanGraphs’ PITCHf/x data from 2008 to 2015 to attempt solving this problem.

For a pitch to qualify for this analysis, it had to be thrown by an individual pitcher at a frequency equal to, or greater than, the average frequency for that pitch to be thrown throughout the entire data set. For example, in our data set, the curveball was thrown at an average of 12% of the time by all pitchers. Thus, a pitcher’s curveball was only considered if it was thrown at a frequency of greater than or equal to 12%. We then determined the maximum and minimum velocity for all eligible pitches for each pitcher. Working off of the fastball, we then determined the maximum change in movement in both the X direction, and the Z direction, for any qualifying pitches. We then calculated the maximum resultant movement for these values. Z-scores were then calculated and summed from the following factors to get a final pitcher “stuff” score: 1) maximum velocity; 2) change in velocity between maximum and minimum velocity; and 3) maximum resultant movement.

Here is an example as to how a pitcher with elite stuff performed in this analysis. David Price had a great year with the Blue Jays and Tigers. From FanGraphs data, his maximum pitch velocity was 94.1 mph, and the minimum pitch velocity was 85.2 mph – a difference of 8.9 mph. Working off the fastball, the greatest x direction break on a pitch was 15.1”, and the greatest z direction break was 10.9”.  This produced a resultant change in movement of 18.6”.

These values translated to a z scores for velocity, change in velocity, and resultant movement of 0.969, -0.08, 0.91, resulting in a stuff value of 1.80. Comparatively, another Blue Jays starter who struggled in 2015 was Drew Hutchinson. Hutchison had a fastball velocity of 92.4 mph, an offspeed pitch of 84.3 mph, an x direction break of 7.1, and a z direction break of 9.8. Corresponding z scores for velocity, change in velocity, and resultant break were 0.392, -0.24, -0.08, resulting in a stuff value of 0.1.

To break down how well our stuff rating was performing, we correlated stuff with K/9. Pitchers included in this analysis were all starting pitchers who pitched 90 innings in a season, between the 2008 and 2015 season. Average stuff and average K/9 was calculated during this time. Overall, the correlation was r = 0.42 (Figure 1). For the sake of these graphs, knuckleballers Tim Wakefield and R.A. Dickey were not included, as the stuff metric had them rated lower than -4 per season.

View post on imgur.com

Figure 1. Stuff vs K/9, between the 2008 and 2015 MLB season.

Here’s the top 25 starting pitchers from the 2015 season ranked by their stuff. While overall, we think this is a good starting point for evaluating a pitcher’s repertoire, there are a few notable pitchers that the stuff calculation doesn’t seem to do justice. Chris Archer, who has had his slider called one of the best pitches in all of baseball, has only a 1.12 stuff value, and is ranked as having the 67th best stuff. Max Scherzer, who threw two no-hitters, is ranked as only having the 60th best stuff.

View post on imgur.com

Table 1. Top 25 stuff for pitchers, with raw data on velocity and break

What’s worth stressing however, is that this metric serves to evaluate the individual pitches within their repertoire. There are pitchers which would be scouted to have the ability to throw hard, with lots of break. Pitching is clearly an art form that involves more than those two things, thus players like Mark Buerhle (-2.7), are clearly someone who has mastered the art of pitching, without having great stuff.  When comparing stuff against xFIP, correlation coefficients are smaller (r = -0.33) (Figure 2). Much like K/9 does not directly predict pitcher success, neither does stuff.

View post on imgur.com

Figure 2. Stuff vs. xFIP, between the 2008 and 2015 season.

We believe there’s great use for this metric. We think this metric can provide insight into how stuff changes with age, how stuff changes after a pitcher is injured, and how it can let a coach know when a player has returned to pre-injury form, and how a pitcher’s consistency with their stuff relates to success. As with any ranking that appears on the FanGraphs website, we’re sure that there will be debate – however, we are looking forward to the input from the community into how we can improve this technique.

References

Branch, J. (2015). The Mysteries of Pitching, and All That ‘Stuff’. Posted online, October 3, 2015. http://www.nytimes.com/2015/10/04/sports/baseball/the-mysteries-of-pitching-and-all-that-stuff.html

Sarris, E. (2015). The Best Changeups of the Year by Shape and Speed. Posted online, November 9, 2015. http://www.fangraphs.com/blogs/the-best-changeups-of-the-year-by-shape-and-speed/


Revisiting Vegas

Before the season began, I wrote an article comparing the Vegas odds of each team winning the World Series to the projected standings according to Steamer. This is a look back at that comparison.

Using the Vegas odds of winning the World Series and the Steamer-projected standings, there were some strong plays on the board before the season began. Let’s look at each division, in chart form, starting with the NL West. The first table shows the Steamer pre-season projections. The second table shows the actual standings.

RDif=Run differential
RS/G=Runs scored per game
RA/G=Runs allowed per game
EXT W=Wins greater or fewer than Steamer projected

What I wrote then: It’s interesting that Vegas is really excited about the Padres, at least compared to the Rockies and Diamondbacks, who don’t project to be that much worse but who face significantly longer odds. With the Giants’ recent success, they are probably the best play here. Even if you don’t think they can beat out the Dodgers for the division, they’ve proven that they can make a run if they get into the playoffs as a wild card team. Of course, this is an odd-numbered year, so you might want to save your money and look elsewhere.

What actually happened: Steamer nailed the top of the division, picking both the Dodgers and Giants to win just one fewer game than they each did. The Diamondbacks and Padres were flipped, with the Diamondbacks winning five more games than projected and the Padres falling five games short. The Rockies came in way under. Vegas was right about the Dodgers being the favorites, with the Giants having the next-best odds, but the hype around the Padres at the beginning of the year proved to be unfounded and the Diamondbacks finished better than 120 to 1 odds would have predicted.

What I wrote then: The play here is the Pittsburgh Pirates. They are projected to be just a game off the division lead, but with odds at 30 to 1. In a world full of parity, every team in baseball would have a .500 record and 30 to 1 odds and there would be no supermodels. That would be a sad, sad, world. In this world, the Pirates are projected to be better than .500 and should have better odds than 30 to 1. Meanwhile, Vegas is excited about the Cubs, giving them 14 to 1 odds (they opened at 45 to 1). Some of you may remember that in Back to the Future, the Cubs won the 2015 World Series (in a 5-game sweep over Miami) after starting the year with 100 to 1 odds. This could be the Cubs’ year, McFly!

What actually happened: Steamer nailed the order of this division, right down to the gap between the top three teams and the bottom two. In the upper half of the NL Central, the Cardinals and Cubs shared the third-best odds in the National League and finished 1st and 3rd in overall win-loss record. The Pirates, on the other hand, finished with the second-best record in the NL but Vegas had them tied for eighth with the Marlins at 30 to 1 odds before the season. The Brewers and Reds both disappointed, but the Reds were particularly bad. They entered the season with 70 to 1 odds but finished the season with just 64 wins, one more than the Philadelphia Phillies, who were giving 300 to 1 odds back in April.

What I wrote then: There aren’t any real good plays here. As good as the Nationals look now, especially after acquiring Max Scherzer, it would be foolish to put any money on a major league team at 5 to 1 odds to win the World Series. There’s just too much unpredictability come playoff time. None of the teams in this division have appealing odds, unless your name is Lloyd Christmas, in which case you have to jump all over the Phillies at 300 to 1 (“So you’re telling me there’s a chance?”).

What actually happened: So much for those 5 to 1 odds in Vegas for the Washington Nationals. I hope you didn’t put too much money on them. Vegas was optimistic about the Nationals, as you would expect, but also gave the Marlins nearly the same odds as the Mets. The Mets made it all the way to the World Series, while the Marlins were 20 games under .500. The Phillies were the longest of longshots to win the World Series and finished with the worst record in the National League.

What I wrote then: There’s no love for the Tampa Bay Rays in Vegas, with odds of 75 to 1 in what still looks like a tight division. The Rays opened at 35 to 1. Apparently, Las Vegas does not like their recent moves. Based on Steamer projections, the Rays look like your best longshot option of any team in baseball.

What actually happened: At 14 to 1, the Red Sox were tied with the Seattle Mariners for the second-best odds of any American League team, with only the Los Angeles Angels topping them. The Red Sox (and Mariners) finished well below Steamer’s expectations. In the case of the Red Sox, the pitching didn’t hold up their end of the bargain. On the other hand, the Toronto Blue Jays had worse odds than nine other teams in the AL but finished with the second-best record in the league. They had nine more wins than Steamer projected.

What I wrote then: No team jumps out here, but if I had to pick one, I’d take the Indians at 25 to 1. They look to be right there with the Tigers to win the division, but with slightly worse odds, so you’d get a bigger payout if they went all the way.

What actually happened: I picked the Indians as the team to take a chance on, but everyone now knows the Royals were the best play. The 2015 World Champion Kansas City Royals were given 25 to 1 odds before the season started. Those odds placed the Royals behind six AL teams and tied with two others. They ended up with 14 more wins than projected by Steamer. The Tigers were the anti-Royals, finishing with 11 fewer wins than projected. The Tigers’ 20 to 1 odds were in the top six in the league and they finished with the second-worst record. The team with the longest odds in the AL, the Twins, actually made a run at a wild-card spot and had seven more wins than projected by Steamer.

What I wrote then: I guess when you lose Josh Donaldson, Brandon Moss, Jeff Samardzija, Jon Lester, and Derek Norris, your odds to win the World Series should get worse, but 60 to 1, really? Steamer still has Oakland in the mix for the AL Wild Card and just 5 games back of the Mariners for the division.

What actually happened: Based on their 68-94 record, the Athletics deserved their pre-season 60-to-1 odds, but they weren’t as bad as their record. They had a run differential that was better than the Mariners, who won eight more games than the A’s. The Angels (10 to 1), Red Sox (14 to 1), and Mariners (14 to 1) were the top three favorites in the AL in Vegas before the season started and they finished, 6th, 11th, and tied for 12th, respectively, in wins. The Angels were within range of a wild card spot and actually had one more win than Steamer projected, but the Mariners were big disappointments in Vegas and compared to their Steamer projection. They had 13 fewer wins than Steamer projected. The 50 to 1 Rangers had the worst Vegas pre-season odds of any team that went on to win their division.

The following chart shows the teams in each league with their pre-season Vegas odds, their Steamer projected win-loss record, and their actual win-loss record.

What I wrote then: The Pirates have worse odds than the Padres and Mets, neither of whom are projected to contend for the Wild Card or even finish .500. Aye, this be the National League team you should wager your doubloons on and win some booty!

What actually happened: The Pirates weren’t a bad play, really. They did win 98 games. They just ran into the Jake Arrieta Experience in the one-game wild card matchup with the Cubs.

Based on pre-season Vegas odds, the top five teams in the National League were the Nationals, Dodgers, Cardinals, Cubs, and Giants. Three of those five made the post-season. Steamer, on the other hand, had a top five of the Nationals, Dodgers, Cardinals, Pirates, and Cubs, giving them four of the five post-season teams. Both Vegas and Steamer missed out on the Mets.

The Vegas pre-season odds did a good job of identifying the league’s worst teams. Five teams finished with fewer than 70 wins and they all had odds of 60 to 1 or worse before the season started. The 120 to 1 Diamondbacks were the exception among the teams expected to struggle in 2015, as they surprisingly won 79 games.

What I wrote then: In the American League, your best options are the Athletics and Rays, and possibly the Blue Jays. The A’s are right in the mix for the wild card, yet have the same odds as the Houston Astros and Atlanta Braves. The Rays are projected to be nearly as good as the A’s and have even worse odds, better than only four teams in all of baseball—the Phillies, Diamondbacks, Rockies, and Twins. The Blue Jays don’t look to be as good a play as the A’s and Rays but, like the Pirates, they have longer odds than other similarly competitive teams.

What actually happened: It turned out the A’s and Rays were not good plays, but how about those Blue Jays?

The Vegas pre-season odds suggested a top six of the Angels, Mariners, Red Sox, Tigers, Orioles, and White Sox, with all given odds of 20 to 1 or better. None of the six made the playoffs. You have to get down to the 25 to 1 Yankees and Royals to find a playoff team and they were joined by the 30 to 1 Blue Jays, 50 to 1 Rangers, and 60 to 1 Astros. Steamer projected a top seven that included the Mariners, Red Sox, Tigers, Angels, Indians, Blue Jays, and Athletics, all with 84 wins or more. Only the Blue Jays were a playoff team among this group.

The bottom line is that baseball is difficult to predict. Eleven teams had better odds than the World Series Champion Kansas City Royals and four teams had the same odds as the Royals. Yet, it was the Royals hoisting the World Series trophy when all was said and done.


Evaluating the Gap Between ERA and FIP

Fielding Independent Pitching (FIP) has displayed an ability to accurately measure a pitcher’s true skill. FanGraphs describes FIP succinctly as “a measurement of a pitcher’s performance that strips out the role of defense, luck, and sequencing, making it a more stable indicator of how a pitcher actually performed over a given period of time than a runs allowed based statistic that would be highly dependent on the quality of defense played behind him…”

This definition recognizes three factors that may differentiate the runs a pitcher is expected to surrender (FIP) versus the runs a pitcher actually surrenders.

  • Defense
  • Sequencing
  • Luck

FIP removes these factors by only measuring the events that are within control of the pitcher and therefore accurately reflect the skill of the pitcher. These events are strikeouts, walks, batters hit by pitch and home runs. All other events, which are balls put into play, may result in outs, bases, runs, or errors, but are outside the pitcher’s complete control.

The general measure of over- or under-performance of a pitcher’s true skill is ERA-FIP. ERA measures the earned runs given up by a pitcher based on all the events that happen, opposed to FIP’s measurement of runs given the limited events over which a pitcher has complete control. Therefore, the variance between ERA and FIP is attributed to the three factors noted above: defense, sequencing and luck.

But how much of the difference between pitching results and pitching skills are attributable to defense, sequencing, and luck, respectively? And shouldn’t the opponent get some credit for widening the gap between ERA and FIP, either to the benefit or detriment of the pitcher?

I compared Ultimate Zone Rating (UZR), Defensive Runs Saved (DRS), and FanGraphs’ Defensive Runs Above Average (DEF) to ERA-FIP for each team season between 2005–2015 to try to understand the effect of defense on pitching results.

All the metrics have similar correlations, but DRS has the highest adjusted r-squared (correlation coefficient) value (.39), which measures how much of the variance in ERA-FIP is correlated by the defensive metric. FanGraphs’ DEF was right behind DRS (.37) and UZR had an adjusted correlation coefficient of (.34).

The result was somewhat surprising, because DRS and UZR do not factor in positional adjustments (UZR also does not measure catcher or pitcher defense). These metrics measure a player against the average player at that player’s position. They do not measure the difficulty of the position in comparison to other positions.

DEF does apply positional adjustments. FanGraphs uses UZR, not DRS, as the metric they apply the positional adjustments to in order to determine DEF. (see notes below for further explanation of positional adjustments)

Still, the non-positionally adjusted DRS correlates most closely to ERA-FIP. However, it does seem that the advantage over DEF is negligible.

All in all, defense, considered alone, appears to explain 35–40% of a team’s ERA-FIP.

I chose to use a team’s Run Expectancy based on 24 base-out states (RE24) to measure the effects of sequencing. RE24 measures the change in run expectancy between the time a batter comes to the plate and the run expectancy after the plate appearance. The up and down of these changes will reflect the sequence of events experienced by each team (see notes below for further explanation of RE24).

The relationship between ERA-FIP and RE 24 has a similar correlation coefficient (.38) as ERA-FIP and the defensive metrics. Sequencing seems to play a role nearly equal to defense in determining the over- or under-performance of pitchers.

Defense and sequencing are not exclusive though. The reason that the single in the bottom of the 9th occurred is likely related to the fact that the shortstop and/or third baseman did not have enough range to get to the groundball hit between them. Therefore, I measured the correlation of ERA-FIP to defense and sequencing.

Again, DRS+RE24 (.54), DEF+RE24 (.53), and UZR+RE24 (.51) all yielded similar adjusted correlation coefficients.

This suggests roughly 50% of the difference between ERA and FIP are correlated to defense and sequencing. The other half of the difference is not the great unknown, but it’s (sort of) immeasurable.

Luck is part of the other half of the gap between ERA and FIP, but is luck really 50% of what separates a pitcher’s result from a pitcher’s skill?

The skill of the opponent in running the bases is probably a greater part of the other 50% than luck is. This was on display in the playoffs, whether it’s Lorenzo Cain scoring from first on a single, Daniel Murphy taking third base from first base on a walk, or one of the other examples of aggressive (and smart) baserunning witnessed throughout the playoffs. These events change run probabilities and create runs. These base running events tend to be less noticed during the 162-game season, but they still happen.

Some of the ability for catchers and pitchers to prevent stolen bases is cooked into the defensive metrics, but not much else is. FanGraphs’ Base Running (BsR) measures the baserunning abilities of players and teams, from an offensive perspective, but to my knowledge there is no accumulated stat to measure opponents’ BsR. The data is out there. The same measures used to determine BsR would only have to be aggregated from the perspective of the pitching team.

A measure of Opponents’ BsR would likely cover a good amount of the uncorrelated variance between ERA and FIP. There would still be a lot of luck left in play, but probably not as much as there is thought to be now.


AFL Thoughts, Part 2: Meadows, Profar, etc.

In case you missed Part One of my AFL notes, I covered Clint Frazier, Dominic Smith, Ian Clarkin and five other interesting prospects playing in this year’s Arizona Fall League. Just a disclaimer: I was out in Arizona for fun, and I wasn’t paying too much attention to defensive ability for any one player. These scouting reports would be more complete if I was actually scouting for an MLB organization.

Austin Meadows, L/L OF (PIT)
He’s 6’2″/200 and a plus athlete. He hit .307/.357/.407 in the Florida State League (High-A) and won’t turn 21 until next May. I was excited to watch him play, given the hype around his name, but I wasn’t impressed. Maybe he’s tired, or maybe he doesn’t care about the Fall League, but in those eight PAs, there wasn’t a single one that instilled faith in me. Despite a noticeable confidence approaching the box, he seemed almost apathetic at the plate. I can’t remark on him as a defender, but he’s clearly a good athlete, so I doubt corner outfield would give him too much trouble. With McCutchen, Marte, and Polanco ahead of him though, he’s got a tough road to major-league playing time. In my opinion, the Pirates would be smart to trade him during the offseason and improve their 2016 MLB roster.

Yandy Diaz, R/R 3B (CLE)
Pretty impressive stature; listed at 6’2″…weight could be anywhere between 185-205, but he has above-average athleticism for his size. A Cuban-born defector with fairly natural motions at third base, and good arm action making the throws across the diamond. He turned 24 in August, but he had a pretty solid year at AA (.315/.412/.408). With his size, you’d expect him to hit for more power, but he compensates with the type of plate discipline that may allow him to stick around until something clicks. Based on body alone, I’d compare him to a young Edwin Encarnacion (not anywhere the raw power, though). By no means is Diaz a surefire MLB contributor, but his main detractor is something he has a real chance to build upon. With the frame he has, I still see room for the power to develop, and he could turn into a quality everyday MLB third baseman.

Alex Blandino, R/R INF (CIN)
I just didn’t see the ballplayer in this guy. He made one fairly challenging play at second base, but he had so many empty plate appearances; swinging at first-pitch breaking balls, or taking called third strikes down the heart of the plate. In a hitter-friendly league, he seemed like an automatic out. Blandino was a first-round pick in 2014, and had a pretty solid year at High-A in 2015, but he’ll be 23 to start the season next year. I’d be surprised if Blandino ever lives up to his first-round price tag. Insert pun about him being a ‘bland’ prospect.

Brett Phillips, L/R OF (MIL)
One of the key pieces in the deal that brought Carlos Gomez to Houston, Phillips has a shot to contribute for the Brewers as soon as Opening Day 2016. He’s similar to Clint Frazier, with slightly less muscle mass (and power). As one of my friends noted, “He’s a good downhill runner.” As with Frazier, Phillips strikes out a bit too much, and it could easily be the difference in Phillips being a Quad-A player and an MLB regular. The tools are impressive, though; I could see some Alex Gordon seasons in him.

Adam Brett Walker II, R/R DH/1B (MIN)
Built like a tight end; 6’4″/230+. Great athleticism for his size, yet he was limited to DHing in the AFL. He needs to shorten his swing. His hands drop, causing the barrel of his bat to loop through the zone. He swings and misses at way too many pitches because of a weak top hand. I had essentially written him off after 11 PA…and then he hit a ball over 450 feet.

Photo Credit: Buck Davidson (@BuckDavidson)

The raw power is enormous. At least a 7. When he gets his pitch, he hits it a long way. He hit 31 HRs and stole 13 bases at Double-A Chattanooga, showing the power and athleticism are very real, but only to the tune of a .239/.309/.498 triple-slash as a 23-year old. He lead the Southern league in K-rate, striking out 35% of the time. He’d be lucky to hit .150 in the Majors right now, but he’s not unfixable. If Minnesota’s player development staff can get him to fix his swing plane, this guy could theoretically hit 40 home runs.

Gary Sanchez, R/R C (NYY)
Another big guy, Sanchez looks the part of a major-league catcher. 6’2″/220+, with decent athleticism and an average arm. He’ll never be a stud defensively, but he could theoretically stick as a 120-game catcher. He displayed some pretty lively power, driving home runs to left- and right-center. I spoke with a cranky, yet knowledgeable, Yankees fan who didn’t think much of Sanchez, but I’d be happy to have him in my system. He turns 23 this December, and he’s already posted a .295/.349/.500 slash at AAA Scranton/Wilkes-Berre. He could become more of a 1B/DH type with age, but his bat seems good enough to be around average for a DH. If he can stick behind the plate, the Yankees have a very valuable asset on their hands. He could develop into a .260/.340/.450 catcher.

(UPDATE) Jurickson Profar, switch-hitting MI (TEX)
I had the pleasure of seeing his first PA back my first day out there…and (true story), he laced a double to right field and as he was sliding into second base, Nate Orf turned to the dugout and simply said, “He’s back.” The respect this guy gets from his peers is enough to justify the hope alone. Profar’s already had a taste of the dream, whereas many of these guys are working to get there. His swing looks as natural as ever. When I was in attendance, it was a hit parade for the former LLWS Champion. Texas will have a very nice problem come Opening Day 2016, with Odor, Andrus, and Profar. Where he’ll play defensively, I’m not too sure (left field?), but I’m fairly certain he’ll be right back on track come April of next year. Kid’s a special talent.

Overall general thoughts on the AFL from a fan’s perspective: it’s incredible. I stayed with a few friends in the greater Phoenix area, and we split a $120 ‘family pass’ — which permits entrance for up to six people to any and all of the AFL games for the season (including the Fall Star Game and the championship). The four of us were able to attend nine games each in a seven-day span, and we sat in the first row behind home plate or the dugout every time, all for $30 a piece…that’s a little over $3 a game(!). I was able to witness a literal team-wide drum circle going on in the Surprise Saguaros dugout, which rallied them to a dominant 18-3 victory over the Glendale Desert Dogs. The entire week was a fantastic experience at such a reasonable price. If you have a family and want to take your kids to a bunch of professional baseball games, and take in ‘the future of baseball’, do yourself a favor and book a trip for the Arizona Fall League for the same price as taking the family to a regular season MLB game.

I have some more thoughts, particularly on a handful of pitchers, so I’ll be writing up another (shorter) post in the next few days. Again, thanks for reading.


Determining the Market Value for Greinke, Price and Cueto

With the World Series over and all the free agents declared it’s now time for my second-favorite part of the MLB season: the offseason. The 2015 free-agent class is pretty deep and includes some elite players. In this article I wanted to figure out a way to determine monetary value for the top three starting pitchers available this year: Zack Greinke, David Price and Johnny Cueto. All of them are aces and certainly heading for a big pay day but I wanted to develop a way of using the recent big contracts pitchers have signed and the production of great players in the past to determine what kind of pay day these guys are heading for.

Since 2009 there have been nine pitchers to sign a major deal: Clayton Kershaw, Max Scherzer, Justin Verlander, Felix Hernandez, C.C. Sabathia, Jon Lester, Zack Greinke, Cole Hamels and Matt Cain. (I didn’t include Masahiro Tanaka because he didn’t face big-league hitting until he signed his contract.) The average salary amount for these contracts was $168 million and had an average year length of about 5-6 years. When we’re looking at contracts there are many things to consider but two of the biggest factors has to be dollar and year amount. For all three of these pitchers, this may be their last big contract, so maximizing potential is crucial. Every team would love to add a pitcher of their caliber but not every team is in a position to pay for them. That’s part of the reason I wanted to figure out a way to see what dollar amount these pitchers’ production has warranted so far, in comparison to the big contracts signed since ’09 and speculate what can be expected of them for the length of the contract.

To figure out the dollar amount I looked at the nine players’ contracts and figured out the average yearly salary for each individual. I then took that number and divided it by their career WAR, essentially figuring how much it cost the team for the player’s WAR production. Here are the results I got (in millions).

Clayton Kershaw – $5.2m
Justin Verlander – $7m
Felix Hernandez – $6.5m
Jon Lester – $8.9m
C.C. Sabathia – $6.7m
Cole Hamels – $7m
Matt Cain – $9.4m
Zack Greinke – $7.7m
Max Scherzer – $7.5m

I averaged out the numbers, rounded off and got $7.3 million per WAR created. I then took that 7.3 number and multiplied it by Greinke’s career WAR to get, 27.7. So theoretically a year of Zack Greinke pitching is roughly $27.7 million. For David Price it’s $29.2 million and for Johnny Cueto it’s $21.1 million. It’s hard to predict where the market will go once teams start the bidding war, and I’m sure some team is willing to pay above the WAR value to ensure they get their man but for now I’m going to use these numbers to speculate year amount and production.

To determine the amount of years each player could receive, I decided to compare their career production with that of a similar type of pitcher. Let’s start with Zack Greinke. For Greinke I went with Greg Maddux as a comparison; obviously Greinke throws harder but I felt their command of the strike zone and pitches put Maddux and Greinke in the same boat. Below I’ve compared Greinke’s first 12 years in the big leagues to Maddux’s and I certainly think they’re close.

Zack Greinke      Greg Maddux

ERA = 3.49          ERA = 3.06
IP = 2,092.1         IP = 2,596.7
BABIP = .299       BABIP = .283
WAR = 3.8           WAR = 5.5
K/9 = 7.97            K/9 = 6.27
BB/9 = 2.37          BB/9 = 2.23
FIP = 3.52            FIP = 3.06
HR/9 = .92           HR/9 = .49

At age 32 Maddux had a better WAR than Greinke and threw about 500 more innings, but the latter may work in Greinke’s favor. The next part will help determine how many years a team can reasonably expect Greinke to pitch at an elite level. I looked at Maddux’s career numbers from age 32-38 and these were the results.

Greg Maddux (Age 32-38)

ERA = 3.21
IP = 1,581.6
BABIP = .285
WAR = 5.3
K/9 = 6.18
BB/9 = 1.50
FIP = 3.46
HR/9 = .81

As you can see from the results, Maddux was still pitching at an elite level from ages 32-38. From the ages of 39-41 however, you have a different story.

Greg Maddux (Age 39-41)

ERA = 4.20
IP = 827
BABIP = .291
WAR = 3.5
K/9 = 4.93
BB/9 = 1.39
FIP = 3.88
HR/9 = .91

Still good enough to be a major-league pitcher but a far cry from his prime. For Greinke’s situation I think you can expect a similar outcome, so a contract of 6 years at $166 million would be incredibly reasonable for a team. But this is America and money talks; whichever team is willing to pay the elite price tag for more then six years, I think, will be the winner of his services. A seven-year contract between $27-$29 million would be palatable and completely plausible but I think you start to handcuff yourself as a team going for eight years at that rate. Greinke had a dominant 2015 and if there ever was a time for him to test the open market, it’s now. We’ll see what teams are willing to shell out for him but for now let’s move on to David Price.

Unlike Greinke, David Price has never had a chance to test the open market and after another stellar season in the big leagues, Price is gearing up for a big pay day. As I mentioned before Price has a WAR value of about $29.2 million per season and at the age of 30 could see a lengthier contract then Greinke. To figure out future production I could only go with another tall, hard-throwing left-hander by the name of Randy Johnson. Price has eight years under his belt and his comparison to Randy Johnson looks something like this.

David Price          Randy Johnson

ERA = 3.02          ERA = 3.44
IP = 1,439.8         IP = 1,457.8
BABIP = .275       BABIP = .279
WAR = 4              WAR = 4
K/9 = 8.34            K/9 = 9.78
BB/9 = 2.43          BB/9 = 4.46
FIP = 3.30            FIP = 3.43
HR/9 = .80           HR/9 = .76

Price and Johnson compare very well, with Johnson having the advantage in K/9 but Price’s BB/9 is significantly better. Both have a WAR of 4 and nearly identical IP, BABIP, FIP and HR/9. Over the next eight years Johnson went on to be one of the most dominating pitchers in the game and during that stretch had some of the greatest seasons we’ve seen from a pitcher, period. Here are his numbers from 1996-2003.

Randy Johnson (’96-’03)

ERA = 2.93
IP = 1,660.8
BABIP = .308

WAR = 7
K/9 = 12.04
BB/9 = 2.79
FIP = 2.85
HR/9 = .94

This was by far the prime of Johnson’s career and although Price may not put up those types of numbers, he has a good shot of coming close. An 8-year deal for $233 million would be a steal if Price could come close to Johnson’s numbers. Price’s situation is similar to Greinke’s whereas whichever team is willing to pay elite prices for the most years will probably win out. Like Maddux, if you look at the back end of Johnson’s career, you’ll see the decline in results. Still effective for a major-league pitcher but not worth the elite money they once were.

Randy Johnson (’04-’09)

ERA = 4.00
IP = 1,011.6
BABIP = .290

WAR = 3.8
K/9 = 9.09
BB/9 = 2.21
FIP = 3.70
HR/9 = 1.21

Again, whichever team is willing to pay the elite price tag for these years of Price’s career will probably be the winner. It’s a gamble for sure to exceed eight years but eight elite seasons of David Price might be worth a year or two of mediocre Price. This brings us to our last top-tier starting pitcher and the one who perhaps stands to gain the most by being in the same class as Greinke and Price: Johnny Cueto.

First off, I want to say that I think Cueto is a great pitcher and one who deserves the “ace” title, and I know he’s spent most of his career in a hitter-friendly ballpark, but I don’t think his numbers warrant the price tag that Greinke and Price may receive. That being said, pitching is crucial for success in the big leagues and there are only a few top-tier pitchers available via free agency. A team that loses out on Greinke and Price could very well overpay for Cueto’s services to ensure they get one of the best available. For comparison I decided to use Jake Peavy; although Peavy is still playing I think his time as the ace for San Diego and his funky delivery pair nicely with Cueto. Here are the comparisons for the two pitchers through the first eight seasons of their careers.

Johnny Cueto          Jake Peavy

ERA = 3.31            ERA = 3.34
IP = 1,418.7           IP = 1,360.1
BABIP = .272         BABIP = .286
WAR = 2.9             WAR = 3.7
K/9 = 7.35              K/9 = 9.00
BB/9 = 2.65            BB/9 = 2.94
FIP = 3.87              FIP = 3.46
HR/9 = .94             HR/9 = .90

Through similar innings pitched Cueto and Peavy have comparable ERA, BABIP, WAR, BB/9, FIP and HR/9. The WAR value that I came up with for Cueto was $21.1 million per season, a number I think he can certainly get for a number of years. He’s only 29 and unlike Greinke and Price, may be able to sign two major contracts in his career if he can maintain elite status throughout the first one he is about to sign. If he were to sign a four- or five-year deal (4 years/$84 million or 5 years/$105), it’s not crazy to think that a team will pay the elite price tag for another three or four years of a quality Johnny Cueto.

The red flag I see with Cueto is the amount of innings he’s thrown; at 29 he’s only 21.1 innings away from David Price’s total of 1,439.8. As is the case with Jake Peavy, injuries completely derailed effectiveness and Peavy quickly went from “ace” to a 3rd or 4th starter. I’m not saying Cueto is destined to get hurt — his chances are the same as anyone, but paying the high price required to get him makes the possible injury sting even more. Here are the numbers Jake Peavy has put up over the past 6 seasons.

Jake Peavy (’10-’15)

ERA = 4.06
IP = 893.8
BABIP = .281
WAR = 2.3
K/9 = 7.39
BB/9 = 2.31
FIP = 3.82
HR/9 = 1.04

As I mentioned above, injuries greatly affected Peavy’s last six seasons and that’s not the best situation to compare future production from Cueto but it could be a caution to whichever team signs him as to the other end of the spectrum. We all hope for the best but you have to plan for the worst and shelling out $21m+ per season for those types of numbers doesn’t necessarily make sense.

Again I think Cueto is in a great position here, he’s young enough to sign a big deal and still have the potential to land another one down the road. It just depends on effectiveness and health; if both of those stay on his side, he should have no problem getting another big contract around 34 or 35.

After it’s all said and done, we’ll truly know the answer and that’s part of the fun. Speculating how much, how long and where players will end up helps get through the grueling winter months and I, for one, love it. Let me know what you think below and as always, thanks for reading.


Hardball Retrospective – The “Original” 1907 Philadelphia Phillies

In “Hardball Retrospective: Evaluating Scouting and Development Outcomes for the Modern-Era Franchises”, I placed every ballplayer in the modern era (from 1901-present) on their original team. Therefore, Rusty Staub is listed on the Astros roster for the duration of his career while the Athletics declare “Shoeless” Joe Jackson and the Blue Jays claim Tony Fernandez. I calculated revised standings for every season based entirely on the performance of each team’s “original” players. I discuss every team’s “original” players and seasons at length along with organizational performance with respect to the Amateur Draft (or First-Year Player Draft), amateur free agent signings and other methods of player acquisition.  Season standings, WAR and Win Shares totals for the “original” teams are compared against the “actual” team results to assess each franchise’s scouting, development and general management skills.

Expanding on my research for the book, the following series of articles will reveal the finest single-season rosters for every Major League organization based on overall rankings in OWAR and OWS along with the general managers and scouting directors that constructed the teams. “Hardball Retrospective” is available in digital format on Amazon, Barnes and Noble, GooglePlay, iTunes and KoboBooks. The paperback edition is available on Amazon, Barnes and Noble and CreateSpace. Supplemental Statistics, Charts and Graphs along with a discussion forum are offered at TuataraSoftware.com.

Don Daglow (Intellivision World Series Major League Baseball, Earl Weaver Baseball, Tony LaRussa Baseball) contributed the foreword for Hardball Retrospective. The foreword and preview of my book are accessible here.

Terminology

OWAR – Wins Above Replacement for players on “original” teams

OWS – Win Shares for players on “original” teams

OPW% – Pythagorean Won-Loss record for the “original” teams

Assessment

The 1907 Philadelphia Phillies    OWAR: 56.2     OWS: 349     OPW%: .527

Based on the revised standings the “Original” 1907 Phillies finished in a tie for fourth place, only six games behind the front-running Cubbies. Philadelphia paced the National League in OWS and OWAR.

Sherry Magee batted .328 with a League-best 85 RBI and a team-leading 37 Win Shares. Elmer Flick supplied a .302 BA and legged out 18 three-base hits. Nap Lajoie rapped 30 doubles and pilfered 24 bases. The keystone combo of Ed Abbaticchio and Kid Elberfeld swiped 57 bags. Roy A. Thomas posted a .374 OBP and led the League in walks for the seventh time in eight seasons. “Silent” John Titus provided a solid option as a fourth outfielder, belting 23 doubles and 12 triples while hitting at a .275 clip.

Nap Lajoie places sixth among second basemen according to Bill James in “The New Bill James Historical Baseball Abstract.” Teammates listed in the “NBJHBA” top 100 rankings include Magee (21st-LF), Flick (23rd-RF), Thomas (29th-CF), Kid Gleason (72nd-2B), Elberfeld (75th-SS) and John Titus (76th-RF).

LINEUP POS WAR WS
Roy Thomas CF 2.55 20.78
Nap Lajoie 1B/2B 7.5 30.2
Sherry Magee LF 7.13 37.68
Elmer Flick RF 4.95 34.39
Kid Elberfeld SS 2.9 21.36
Fred Jacklitsch C 0.84 8.17
Ed Abbaticchio 2B 2.27 20.54
3B
BENCH POS WAR WS
John Titus RF 2.16 23
Doc Marshall C 0.44 2.67
George Browne RF 0.39 12.1
Mickey Doolin SS 0.06 12.08
Paul Sentell SS -0.06 0.02
Red Dooin C -0.21 7.72
Del Howard LF -1.08 7.34
Kid Gleason 2B -1.44 1.12

Doc White fashioned a 2.26 ERA and a 1.058 WHIP while topping the leader boards with a 27-13 record. Tully Sparks delivered a 22-8 mark with a 2.00 ERA and 1.026 WHIP as he completed 24 of 31 starts. Johnny Lush (10-15, 2.68) and “Smiling” Al Orth (14-21, 2.61) rounded out the Phillies’ rotation. George McQuillan (4-0, 0.66) yielded only three earned runs in 41 innings pitched during his inaugural campaign.

ROTATION POS WAR WS
Doc White SP 4.37 23.84
Tully Sparks SP 3.63 23.54
Johnny Lush SP 0.53 12.13
Al Orth SP -0.06 15.29
BULLPEN POS WAR WS
Harry Coveleski RP 0.7 2.75
King Brady RP -0.02 0.13
George McQuillan SP 2.32 7.19
Fred Burchell SP -0.09 0.27
Jesse Whiting RP -0.28 0
John McCloskey RP -0.58 0
Bill Duggleby SP -1.42 1.9
Bill Bernhard SP -1.54 0

The “Original” 1907 Philadelphia Phillies roster

NAME POS WAR WS General Manager Scouting Director
Nap Lajoie 2B 7.5 30.2
Sherry Magee LF 7.13 37.68
Elmer Flick RF 4.95 34.39
Doc White SP 4.37 23.84
Tully Sparks SP 3.63 23.54
Kid Elberfeld SS 2.9 21.36
Roy Thomas CF 2.55 20.78
George McQuillan SP 2.32 7.19
Ed Abbaticchio 2B 2.27 20.54
John Titus RF 2.16 23
Fred Jacklitsch C 0.84 8.17
Harry Coveleski RP 0.7 2.75
Johnny Lush SP 0.53 12.13
Doc Marshall C 0.44 2.67
George Browne RF 0.39 12.1
Mickey Doolin SS 0.06 12.08
King Brady RP -0.02 0.13
Paul Sentell SS -0.06 0.02
Al Orth SP -0.06 15.29
Fred Burchell SP -0.09 0.27
Red Dooin C -0.21 7.72
Jesse Whiting RP -0.28 0
John McCloskey RP -0.58 0
Del Howard LF -1.08 7.34
Bill Duggleby SP -1.42 1.9
Kid Gleason 2B -1.44 1.12
Bill Bernhard SP -1.54 0

Honorable Mention

The “Original” 1978 Phillies   OWAR: 57.7     OWS: 320     OPW%: .547

Clashing with the Expos and the Bucs into the final week of the ’78 season, Philadelphia emerged in third place, only two games behind Pittsburgh. The Fightin’ Phillies led the circuit in OWAR and placed runner-up to the Pirates in OWS. Greg “The Bull” Luzinski launched 35 moon-shots and knocked in 101 baserunners. First-sacker Andre Thornton blasted 33 long balls, tallied 105 RBI and scored a personal-best 97 runs. Larry Hisle delivered a .290 BA with career-bests in home runs (34) and RBI (115). Mike Schmidt struggled through a sub-par season at the dish but played stellar defensive at the hot corner, winning his third of nine consecutive Gold Glove Awards. Shortstop Larry Bowa contributed 27 steals and a .294 BA while backstop John “Bad Dude” Stearns pilfered 25 bases. Fergie “Fly” Jenkins furnished a record of 18-8 with a 3.04 ERA and 1.080 WHIP. Dick Ruthven provided 15 wins with a 3.38 ERA. Mike G. Marshall anchored the relief corps with 10 victories and 21 saves.

On Deck

The “Original” 2001 Mariners

References and Resources

Baseball America – Executive Database

Baseball-Reference

James, Bill. The New Bill James Historical Baseball Abstract. New York, NY.: The Free Press, 2001. Print.

James, Bill, with Jim Henzler. Win Shares. Morton Grove, Ill.: STATS, 2002. Print.

Retrosheet – Transactions Database

Seamheads – Baseball Gauge

Sean Lahman Baseball Archive


Mostly Useless Information About the World Series In the Wild Card Era

We could easily call my decision to publish an article with playoff predictions using a brand-new theory about previous success predicting future success ballsy (or stupid). To summarize, research by Rosenqvist and Skans (2015) [1] showed that golfers who barely qualified for a golf tournament would go on to have more success in future tournaments than golfers who barely missed the cut in the same tournament. Seemingly accidental success created confidence, which led to more success in the future. So, using this logic, I wanted to see if this same phenomenon occurred at the team, rather than the individual level. The attempt was to predict all divisional victors from this year’s 2015 MLB playoffs using previous playoff experience and success as the predictor. As it turns out, the teams with more experience/success were only 1 for 4 in the first round of the playoffs.

This time, instead of making predictions, I did the smart thing and looked at previous trends. Instead of using the first round of the playoffs (which arguably is more erratic given that it’s only a five-game series), I focused solely on the World Series. I totaled all the previous playoff experience, age, and WAR for every player on each 25-man World Series team roster in the Wild Card Era (1995 – 2015, n = 42 teams).

WAR doesn’t predict the winner of the World Series

Is this old news? I don’t know. Tallying up a team’s WAR correlates with the actual number of wins that team will have by the end of the regular season (somewhere around r = .82 last time I checked), but it doesn’t correlate with the victor of the World Series. In fact, 13 out of the last 21 (62%) World Series victors had average WARs lower than their opponent’s.

Differences in experience at the team level relate to the duration of the World Series

The difference in previous playoff experience between the two World Series teams is a good predictor of the number of World Series games that will be played in a series. Specifically, at the team level, the greater the difference in the average previous playoff series won (r = -.45, p < .05, n =21), the average number of World Series appearances (r= -.45, p < .05, n =21), and the average number of World Series titles (r = -.46, p < .05, n =21) between the two teams, the less World Series games played that year. You’re saying, “yeah but what about the 2014 World Series that went 7 games when the seasoned Giants played the inexperienced Royals?” It’s just a trend, not a guarantee.

Other tidbits

  • The higher the average of previous World Series appearances across both World Series teams, the higher number of television viewers (r = .45, p < .05).
  • The World Series victor with the highest average WAR per player was the 1998 Yankees (m = 2.57); the lowest WAR was the 2006 Cardinals (m = 1.26).
  • Oldest World Series victors were the 2000 Yankees (m = 30.7); youngest were the 2002 Angels (m = 27.4).
  • Most experienced victor was also the 2000 Yankees (96% of the team had previous playoff experience), and least experienced were the 2002 Angels (0%).

More needs to be understood about this theory

There was however, no relationship between previous playoff experience and that year’s World Series outcome. In terms of playoff experience, the results from Rosenqvist and Skans could not be replicated in this setting. Baseball isn’t golf, and baseball isn’t an individual sport, it’s a team sport. Perhaps the average and/or aggregate levels of experience within a team might manifest differently than for an individual. So, too, are there other ways to operationalize this hypothesis of previous experience/success, so I wouldn’t write this off as a done deal. We’re still a long ways away from determining how and if this theory occurs within the context of baseball – more research into the theoretical underpinnings is always the answer.

Back to the drawing board.

[1] Rosenqvist, O. & Skans O.N. (2015). Confidence enhanced performance? – The causal effects of success on future performance in professional golf tournaments. Journal of Economic Behavior & Organization, 117, 281-295.