Author Archive

The Pirates Are Probably Better (This Year) After These Trades

Are the Pirates actually worse after trading Andrew McCutchen and Gerrit Cole? Probably not. The trades addressed their weakest spot on the field, even though they caused sore spots off the field.

It’s usually doom and gloom when big names leave, and small names come back in return. But, the value of the smaller players can add up. In this situation they do.

The most important thing is to understand the context of who the Pirates are. The Pirates were not a World Series contender before the trades, or even strong playoff contenders. They were, and still are, a team that needed things to break the right way in order to compete for a playoff spot in a division with the Cubs, Cardinals, and Brewers. 

However, a small market team can compete on the fringes, and the Pirates are doing that.

The Pirates weakest spot in 2017 was the 7th inning. Their starters had a 7.08 ERA in 47 innings pitched after the 6th. The team, as a whole had a 5.00 ERA in the 7th inning. The Pirates were nearly a whole run worse than the league in the 7th inning, which posted a 4.19 ERA. Over 162 innings that’s 14.58  (let’s call it 15) runs. Overall, the Pirates were an above average pitching team, but the 7th inning was their downfall.

 Inning Pirates ERA League ERA Difference
1st 5.17 4.8 0.37
2nd 3.67 3.97 -0.30
3rd 4.67 4.51 0.16
4th 3.72 4.62 -0.9
5th 4.28 4.53 -0.25
6th 4.11 4.45 -0.34
7th 5.00 4.19 0.81
8th 3.28 4.1 -0.82
9th 4.05 3.87 0.18

The mid-game struggles are further highlighted by the Pirates inability to keep up with the league average when entering the 6th and 7th. Teams that entered the 6th with the lead won 82.8% of the time; those who entered the 7th with the lead won 87.1% of their games. The Pirates only won 77.3% and 86.4% of those games, respectively.

League       Pirates
Inning W L W% W L W%
Wins Below League Average
6 1762 365 0.828 51 15 0.773 3.6
7 1872 278 0.871 57 9 0.864 0.5

On average, teams that entered the 6th inning tied won 50% of their games. The same applies to teams entering the 7th inning tied. The Pirates won 52% of the time when tied going into the 6th inning. They only won 45.8% of the games in which they were tied going into the 7th inning.

League       Pirates
Inning W L W% W L W%
Wins Below League Average
6 303 303 0.5 13 12 0.52 -0.5
7 279 279 0.5 11 13 0.458 1.0

Moreover, the Pirates were less adept at making comebacks than other teams. The league average winning percentage for teams trailing entering the 6th inning was 17.2%, and 12.9% when trailing entering the 7th inning. The Pirates ended the season with a 15.5% and 9.7% winning percentage in each respective situation.

League       Pirates
Inning W L W% W L W%
Wins Below League Average
6 365 1762 0.172 11 60 0.155 1.2
7 278 1872 0.129 7 65 0.097 2.3

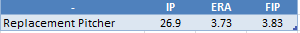
Juan Nicasio left the team in free agency this off-season. His stellar 2017 is the reason for the Pirates’ great 8th inning performance last year, but the Gerrit Cole trade addressed this loss through the acquisition of Michael Feliz, who will likely, at least in part, take over Nicasio’s 8th inning role. The Cole trade also alleviated the loss of Cole himself, as the Pirates acquired Joe Musgrove, who Steamer projects to have a nearly identical season, if not better season than Cole himself. (Editor’s note: Steamer has not yet accounted for Musgrove’s projected switch from the bullpen to the rotation in regard to his rate stats).

What about the 7th inning? This is what the McCutchen trade addresses. Kyle Crick may seem underwhelming, but he may be exactly what the Pirates need in order to extend and bolster their bullpen.  Crick will be relied upon to team up with A.J. Schugel, George Kontos and Daniel Hudson to address the 7th. The four of them are unlikely to be dominant, but the Pirates will be well-served if the four players can mimic, or slightly exceed the league average. More important, the group will need to provide Clint Hurdle with enough confidence to remove his starters by the 6th inning. The group is ill-equipped for the final third of games, but they are seemingly capable of providing average to above-average performance in the first 6 innings of a game.

Kyle Crick and Michael Feliz may not inspire passion in a fan base that lost a face of the franchise, and head of their rotation, but those are the types of players the Pirates need to stay competitive, with or without Cole and McCutchen.

This doesn’t address the loss of McCutchen on offense, but there’s a reasonable expectation that players on the team will be able to patch together those losses in the form of a healthy Starling Marte (Steamer 2018 Projection: 3 WAR, 2017 1.2 WAR), a healthy Gregory Polanco (Steamer 2018 Projection: 1.8 WAR, 2017 0.5 WAR), a more developed Josh Bell (Steamer 2018 Projection: 1.2 WAR, 2017 .8 WAR), etc.  The team will also need to add a veteran outfielder to hedge against a likely Adam Frazier regression and to provide time to figure out where Austin Meadows fits into the 2018 Pirates.  However, the picture as a whole suggests that this team is no worse off in the field than it was with the 2017 version of Andrew McCutchen (3.7 WAR).

The Pirates rightly buried the memories of the past to focus on the present and the future. They addressed their weakest spots by picking up players that will contribute now, and provide them a cost-controlled future. McCutchen and Cole were not the right places to invest for the future, therefore the Pirates rightly divested now, and they are, at worst, not worse off for it.

It’s going to be really hard for the Pirates to win 90+ games again. This was the case with Cole and McCutchen. It’s also the case without them. But, they may actually have a better shot now than they did before the trades. Bullpen depth isn’t sexy, but it’s necessary.  Particularly for this team.

***All stats in the tables above were taken from Baseball-Reference.com. All Steamer projections and 2017 WAR citations are from Fangraphs


Follow-Up: Which Player Would You Rather Have For the Rest of the Season?

Last week I offered a poll in the Community Blog. The poll compared three anonymous players — Frank, Tom, and Dan, asking: which player would you rather have for the rest of the season?

The descriptions of each player provided a brief background of their performance in the first half of this season, some non-relevant details of how they have been described by others, and their history of performance, to the extent that there was any. Additionally, the poll provided the major-league averages of certain offensive statistics for the first half of this season. These stats were comparable to the stats given about the individual players.

The poll was not meant to take defense into account and the descriptions were quiet on any defensive characteristics of the players, including the position they played. There was also no indication that one player was more susceptible to injury than another. Therefore, the poll selection should have been focused solely on the player’s offensive potential for the second half of this season.

I came into the poll thinking that Dan is the player I would prefer to have for the rest of the season. I started leaning towards Tom as responses to the poll came in. I never considered Frank a viable option.

After doing some research, I think all three players are viable options. However, I think Tom stands above the rest and resembles the closest thing to an objective choice when faced with a decision to take only one of these players for the rest of the season. Before explaining why, the results of the poll can be found here. Here is a summary of the 62 responses:

Question 1: Which Player Would You Rather Have For The Rest of This Season?

Dan: 37.1% (23)

Frank: 32.3% (20)

Tom: 30.6% (19)

Question 2: What Best Describes You?

I am a professional. I get paid to assess baseball players for a team, media, or other company: 3% (2)

I am extremely knowledgeable in sabermetric analytics, but not a professional: 22% (13)

I am knowledgeable in sabermetric analytics: 53% (31)

I am familiar with sabermetric concepts: 22% (13)

No Response: (3)

The Analysis of Dan

There are likely three scenarios you have in mind if you would choose Dan for the rest of the season. They all revolve around the idea that he will likely perform at a level that he has over the course of his career or above that level, bringing his total season number closer to his career average.

Below are the results of the three likely scenarios you could play out in your mind when you choose Dan.

The “Good” result is Dan performing at career averages.

The “Better” result is Dan performing 50% better or worse than his under-/over-performance in the first half of the season, on top of his career averages. For example, Dan’s BABIP of .234 was .067 points lower than his career average. Therefore, his BABIP in this scenario is .0335 better than his career average of .301, bringing it to .334 in this scenario. Conversely, his BB% was 1.6% better in the first half, so in this projection it would be .08% worse than his career average, or 6.2%.

The “Best” result is Dan performing 100% better or worse than his under-/over-performance in the first half of the season, on top of his career average. For example, his .234 BABIP, .067 point lower than his career average, is reversed completely in this projection, where his BABIP is .368. His 1.6% improvement on his career BB% is reversed completely, and his BB% is projected to be 5.4%. 

PA BABIP K BB HR BIP 1B 2B 3B wOBA
Good 360 0.301 61 25 14 259 58 18 2 0.336
Better 360 0.334 56 22 13 269 67 21 2 0.358
Best 360 0.368 50 19 12 278 76 24 2 0.380

The Analysis of Tom

The analysis for Tom isn’t quite as complicated. That may be why you chose Tom.

Tom’s numbers are very close to his career averages. The three likely scenarios you have for Tom were probably one where he hits at his career averages, one where he hits as he did in the first half, or one where he performs as Dan did in the “best” case scenario, described above.

This is what those three scenarios look like:

PA BABIP K BB HR BIP 1B 2B 3B wOBA
Same 352 0.299 84 37 23 208 46 15 1 0.373
Career Average 352 0.320 99 39 26 188 44 14 1 0.383
Best 352 0.341 113 39 29 172 44 14 1 0.399

The Analysis of Frank

The analysis of Frank is the most difficult because we have very little information about what we should expect from him. You should be confident that, despite his first half, he will not go on to have one of the luckiest and best baseball seasons in history, only because those seasons are extremely rare.

The prospect of someone having something good happen over 50% of the time his bat touches the ball is untenable. So is Frank’s .427 BABIP, which you could have backed into or just ballparked by the numbers given. In light of the league averages, and our general knowledge of baseball, we know that these results are on the extreme of a spectrum and are a product of a great talent coupled with a large amount of luck.

So, these numbers tell us Frank is talented and that he has been really lucky, but we have no context of historical performance to place that talent and luck in. Therefore, I thought the following three scenarios would be most appropriate for Frank.

The “League Average” scenario, where Frank’s performance reverts to league average for the rest of the season. These numbers coupled with his first-half numbers still result in an impressive rookie season.

The “Towards Average” scenario, where Frank’s  performance comes back toward, but not all the way to the league average. In this scenario I have brought all his numbers back half-way. Therefore, his 30% strikeout rate, 8.6% above league average, is scaled back to 25.7%, which is 4.3% lower than it was during the first half of the season.

The “Best” case scenario, where Frank’s performance from the first half of the season continues.

PA BABIP K BB HR BIP 1B 2B 3B wOBA
League Average 352 0.301 76 30 12 234 51 16 1 0.314
Towards Average 352 0.334 91 45 21 195 49 15 1 0.377
Best 352 0.427 104 59 29 160 51 16 1 0.468

Which Player Would I Rather Have For the Rest of The Season?

I’d imagine everyone knew Frank was Aaron Judge. The other two may have been more mysterious, but Tom is Giancarlo Stanton and Dan is Manny Machado.

The one scenario that I didn’t account for in my analysis is things going very poorly for any of these players in the second half. That is a real possibility, but it’s unlikely things will get much worse than what I projected for these players (I’ll discuss that a little more for each player below).

I thought Machado would be the best answer when I created the poll. A lot of that was based on bias, not the information given. Machado’s most recent seasons have been much better than his career averages suggest. That probably shaded my thoughts about how he would perform for the rest of this season. In reality, the career numbers look right, particularly in light of the struggles Machado faced in the first half of the season, which is factored into those career numbers.

I mentioned the lack of exploration of a “worst” case scenario above. In my opinion, the projection for Machado is most vulnerable to this omission. I don’t think the vulnerability is that large, though. Machado’s .234 BABIP is on the opposite, yet nearly as extreme, end of the spectrum as Aaron Judge’s .427 BABIP. While it’s possible that the bad luck continues, it’s probable it does not. The BABIP number from the first half says a lot more about luck, not Machado’s talent level.

Machado’s main issue, in a comparison with these players, is that his best-case scenario is needed to get him in the conversation. The mean wOBA of his three scenarios is .358, which is very good, but it’s not on the level of the others. His wOBA in the best scenario is .380. It is a level where the risk is not worth the reward (in the context of this poll).

In actuality, Machado has another asset: he is a very good third baseman, but for purposes of this poll that is irrelevant. Based on this, Manny Machado is not the player I would want for the rest of the season.

I’m an Aaron Judge skeptic. I think he’s likely to remain an All-Star player, but I don’t think he is one of the best players ever.  The average wOBA of his three scenarios is .386, with a high of .468 in the “best” scenario, replicating his first-half performance. The potential of such high performance tempers the risk of Judge’s floor of a .314 wOBA laid out in the “League Average” scenario.

There are a lot of scenarios that I’m leaving out here. I have brought all of Judge’s numbers down to league average, or half-way to league average. That predicts regression in areas such as BABIP and power, but it also attributes a fake ability to not swing and miss to Judge.  However, even if we said that the “League Average” scenario has a 20% chance of happening, the “Towards Average” scenario has a 70% chance of happening, and the “Best” has a 10% chance of happening, Judge’s average wOBA would be .374. This does not necessarily eliminate the issue of attributing “fake” qualities to Judge, but those “fake” qualities run both ways, as the “League Average” scenario severely underestimates his ability to hit home runs and draw walks. Either way, I hesitantly will take Aaron Judge over Manny Machado for the rest of the year.

That leaves Stanton. Why is he the best bet? Because he is not much of a gamble at all. Stanton is performing very close to his career averages, if not a shade under many of them. His projected scenarios reflect this. Stanton is close enough to his career averages that it’s not unreasonable to believe he can perform above those averages in the second half of this season and create a season meeting his career averages. It’s certainly not an unreasonable thought that he will close out the year performing in line with his career averages, nor is it unreasonable to think that his first half represents a new, slightly lower level of baseline performance for Stanton. All of this adds up to very little uncertainty. The average wOBA of the three scenarios is .385. If you had to take one of these player for this second half of the season you would take Stanton. He’s much of the upside and none of the downside. You know what’s coming and it’s going to be very good to great.

Notes:

  • These projections aren’t very scientific or complex. They are based on three scenarios that come to mind and then a basic application of standard baseball stats.
  • I used wOBA to measure the players projected success in the scenarios laid out. This version of wOBA does not account for the value of  a stolen base, caught stealing, hit by pitch, or sacrifice fly. I used the 2017 weights from FanGraphs’ GUTS to calculate wOBA. I used the weights that were available around July 21st.
  • I projected how many hits were singles, doubles, and triples by determining the percentage of non-home-run hits that were singles, doubles, and triples, respectively, between 2012-2016 and applying that percentage to each player’s overall hits (which is calculated using BABIP).
  • I projected home runs using HR/PA.

Thank you to everyone that voted in the poll!


Poll: Which Player Would You Rather Have for the Rest of the Season

I have included anonymous descriptions of three players. The descriptions include stats that were compiled by  those players a little before the All-Star break.

I have included a link to a Google Survey (at the end of this article). No information is being collected other than your responses. (The survey also includes an optional question about your personal assessment of your baseball knowledge).

The question is: Which player would you rather have for the rest of this season?

Please keep the following facts in mind when answering the question:

  1. The league average BABIP is .299.
  2.  The league average K% is 21.6%
  3. The league average BB% is 8.6%
  4. The league average HR/H is 14.5%
  5. On average in the league, 33% of the time a bat touches the ball, a hit occurs.


Player 1: “Frank”

Frank is a young hitting prospect. He has little major-league track record outside of the first half of this season, and he was considered a top prospect coming up through the minor leagues. He has been described as “freakish” in his size.

Frank strikes out nearly 30% of the time and walks nearly 17% of the time. 53% of the time his bat touches the ball a hit occurs. 30% of those hits are home runs.

Frank compiled these numbers through 81 Games and 352 PA.

Player 2: “Tom”

Tom is a young player, but he has been around long enough that he is verging on a veteran. He has been described as a “model slugger.”

Now in his eighth season, Tom has a career BABIP of .320, K% of roughly 28%, BB% of roughly 11%, and HR/H Ratio of 26%.

This season his BABIP is .299, his BB% is 10.5%, and his K% is roughly 24%. 38% of the time his bat touches the ball a hit occurs. 27% of those hits are home runs.

Tom complied these numbers through 83 Games and 352 PA.

Player 3: “Dan”

Dan is a young player, but he has a considerable track record. He has been described as one of “the most valuable properties in the game.”

Now in his sixth season, Dan has a career BABIP of .301, K% of roughly 17%, BB% of roughly 7%, and HR/H Ratio of 16%.  

This season his BABIP is .234, his BB% is 8.6%, and his K% is roughly 20%. 29% of the time his bat touches the ball a hit occurs. 24% of those hits are home runs.

Dan compiled these numbers through 82 Games and 360 PA.

Here is the survey link: https://goo.gl/forms/Fd7StZznZqQ5Brth2

I will follow up with an article a week after this is published, showing the results, revealing who the players are, and assessing what the projections expect from those players the rest of the year.


The Best Bets for Over/Under Team Win Totals

Typically, projections and conjecture about the upcoming baseball season serve the general purpose of piquing your interest. However, sometimes they are good for making money. In this instance, here are some gambles you can make based on the Atlantis Race and Sports Book. 

This article was written on February 28, 2016 and the initial lines from this Fox Sports article were published on February 12, 2016.

The team win projections referenced are some basic (keyword, “basic”) projections I made for this season. 

  1. Colorado Rockies — Over 68 1/2 Wins, -110

The projection for the Rockies is shockingly bullish at first glance. But, take a step back and put it in context. The Rockies gave up 844 runs last year, the highest amount in MLB. This year they are projected to surrender 757, or 87 less runs; an improvement of over a half-run per game.

This is not ridiculous considering what you can expect from their pitching staff. They will have a full season from a maturing Jon Gray and they bolstered their bullpen with Jason Motte, Chad Qualls, and Jake McGee. These highlights may not be awe-inspiring, but they don’t need to be. The 757 projected runs against is the worst projected runs against in the NL. The projection doesn’t signify the Rockies are good; they signify they are not as bad as last year.

The Rockies offense is projected to keep chugging along, with 761 runs scored, which would be the ninth-lowest runs scored for a Rockies team from 1995–2015, and only 24 runs greater than last year’s Rockies team. It’s not all that extreme.

You don’t need to buy into the projections to view this as a good bet. You just need to buy into the idea that the Rockies are better than they were last year (when they won 68 games). The Rockies are the best bet at the dawn of spring training.

  1. Chicago Cubs — Over 89, -110

A pessimist may ask some of the following questions of the Cubs: (1) It’s the Cubs. Will they find some way to blow it?; (2) Will Jake Arrieta be able to carry over his performance of the past season and a half?; (3) Will Kris Bryant and Kyle Schwarber suffer a decline in performance now the league has had an off-season to study their strengths and weaknesses?

A pessimist would probably have more questions along these lines, but a pessimist would have more of these types of questions about other teams. So, don’t be a pessimist; play the odds, particularly if you’re betting. The odds say the Cubs are the best team in the league.

You may not want to bet on the Cubs’ projected win figure of 100, but it seems foolish to not bet on 90+ wins. Teams can be ravaged by injuries (see 2015 Washington Nationals) and teams can be ravaged by bad luck, but don’t let the world of possibilities cloud the virtue of probabilities. The probability that the Cubs win over 90 games for the second year in a row is greater than the pessimistic possibilities that may (but probably aren’t) dancing through your head.

  1. Los Angeles Dodgers — Over 87, -115

How much can one man be vilified? Snark surrounded Andrew Friedman and the Dodgers’ offseason, beginning with the departure of Zack Greinke. It continued as the Dodgers added more starting pitchers to their pitching staff than they did former general mangers to their front office staff. But that’s okay. You know better, don’t you?

This writer is hard-pressed to think of a team so well-equipped to survive the maladies and booby traps that a major-league-baseball team may encounter in a trek through a 162-game season (well, all but Clayton Kershaw’s arm falling off). They have a cadre of infielders (Kendrick, Turner, Utley, Seager, Guerrero), outfielders (Puig, Pederson, Ethier, Crawford, Van Slyke, Thompson), and Enrique Hernandez is essentially baseball’s equivalent to the utility knife. As suggested in the first paragraph, the Dodgers’ positional depth may only blush when it encounters the depth of their own pitching staff.

If you doubt the Dodgers, you may be the kind of person who’d choose a wallet with a $100 bill over another with ten $20 bills. But, don’t fear if you did that, you can turn that $100 into $187 if you bet on the Dodgers to win more than 87 games this year.

If you’re still unsure, you should have chose the wallet with ten $20 bills. You wouldn’t need to gamble at all if you did that.

  1. Washington Nationals — Over 87, -115

I will not blame you if you begin to feel a greater degree of uncertainty at this point. The luster may have come off the Nationals last year, but don’t you believe they could be re-polished? It’s feasible the Mets and Nationals (and maybe the Marlins) take the battleground of the mid-80s to determine the NL East champion, but it’s more likely that the division winner will walk away with more than 90 wins, or the Nationals will surpass everyone at that level.

You may not want to bet on the health of Stephen Strasburg, Anthony Rendon, and Jayson Werth. Or, you may just want to bet. If the latter is the case, the Nationals are a good bet; not a sure bet. But what is a sure bet? The Nationals’ biggest offseason splash was Daniel Murphy, but their most effective offseason acquisitions likely went under the radar. They bolstered their bullpen with the additions of Shawn Kelley, Oliver Perez, Yusmeiro Petit, and Trevor Gott. They also have a farm system that can (1) patch holes this year (Lucas Giolito) and (2) be used to acquired talent to fill any other holes through trade.

Oh, and Dusty Baker is their manager. You can feel how you want about that, but that means Matt Williams isn’t their manager this year and there’s only one way to feel about that.

  1. Kansas City Royals — Under 87, -115

Lets establish two things: (1) The projected wins are low, and (2) the universe may haunt you for making this bet.

Disregard the universe for the moment. The Royals should be the favorites to win the AL Central. I don’t state that in a hypothetical way. There is no team in the AL Central that is so good that you should expect them to overcome the Royals’ Black Magic. But, for purposes of this exercise, ask the important question: Is the Royals’ Black Magic so good that it will propel them to win more than 87 games? I think not.

Much like the Nationals, I wouldn’t take my last $115 and make this bet, but if you want to bet on, say, five over/under win totals for a MLB team, I would make this your fifth bet. But realize, you’re not making a bet on a the performance of a baseball team; you’re making a bet on the rhythms of the universe.

If you’re hesitant to bet on the universe, here are some other reasonable (but not as reliable) choices:

6. Boston Red Sox — Over 85 1/2 Wins, -105

7. Toronto Blue Jays — Under 87 Wins, -110

8. Texas Rangers — Under 86 Wins, -110

9. Detroit Tigers — Under 85 Wins, -115

10. Baltimore Orioles — Under 80 1/2 Wins, -110


A More Appropriate Measure of Late-Inning Relievers

The issue that plagues the valuation of late-inning relievers is the generalized treatment of runs.

WAR is the most accepted player evaluation metric and wins are determined by run value. Run value is determined in a generalized sense; it’s too perilous and unwieldy to predict, or evaluate performance, based upon the sequencing of events.

However, late-inning relievers do not pitch in a general situation. Unlike many other players we know when they will perform. They are unique; they pitch in particular situations: the late innings of a baseball game.

They are not vulnerable to give up a home run in a large range of innings like a starting pitcher. They are vulnerable to giving up runs in the innings their role demands them to appear in; most notably the 7th, 8th, and 9th innings.

Therefore, reliever value should be measured by a more specific run value. This run value, and ultimately win value, cannot be measured in a general sense. Their valuation must account for the specific times they appear in a game.

I set out to do this with those principles in mind.

First, I used Baseball Reference’s Play Index to determine the amount of runs scored in between the 7th and 9th innings of all games in 2015. There were 13,448 7th, 8th, and 9th innings played last year. That is the equivalent of 1,494 full 9 inning baseball games. In sum, 5,968 runs were scored in the 7th, 8th, and 9th innings of baseball games in 2015. On average, that is 3.99 runs per “game”, where “game” signifies 9 innings of 7th-9th inning performance.

Second, also using Baseball Reference’s Play Index, I looked at the 300 pitchers with the most appearances in the 7th, 8th, and 9th innings. This does not represent every pitcher that pitched in the 7th, 8th, and 9th inning, but it gets us to Trevor Cahill, who pitched 16 innings in the 7th inning or later.

I then split this list of pitchers into two groups. Theoretically, the 90 best relievers in the league would be pitching in the 7th, 8th, and 9th innings (30 teams; 3 relievers each). Therefore, the first group is the first 91 pitchers with the most appearance (Tony Sipp and Blaine Boyer each appeared in 43 innings between the 7th and 9th innings, so there is one more than 90 in this case). The other 209 pitchers represent the “replacement” pool.

The average performance of the “replacement” pool was taken to determine the performance of a replacement player. Here is what that looks like:

This is the basis for the more nuanced portions of the calculation. 3.99 runs were scored in the 7th-9th inning of MLB games in 2015, on average. The first thing to do is calculate the Runs Per Win (RPW) in the “game” (the 7th-9th inning game).

Dave Cameron explains how RPW for pitchers is calculated in this post in the FanGraphs Glossary. You should read it in to become acclimated with the logic of the next step. The article notes that the WAR calculations at FanGraphs credit each pitcher with a unique RPW value, as the better or worse a pitcher is will lower or raise their RPW value. It then details the calculation recommended by Tom Tango to determine RPW value:

Runs Per Win = (Player Runs Against + Lg Runs Against)/2)*1.5

I’m using FIP for the Players Runs Against for this explanation, but you could simply use RA9 or ERA. The tables below include an ERA-based WAR calculation in addition to a FIP-based WAR calculation. That’s not the main point of this conversation though.

So, I’ll take the 3.83 FIP of the replacement-level pitcher and the 3.99 League Runs Against Average and plug it into that equation, which equates to 5.86 RPW for the replacement-level 7th-9th inning pitcher. This equation is applied to each individual pitcher. I’ll use Aroldis Chapman throughout the explanation to walk through the calculation.

Replacement Pitcher RPW = (3.83 + 3.99)/2)*1.5 = 5.86 RPW

Aroldis Chapman RPW = (1.95 + 3.99)/2)*1.5 = 4.45 RPW

Next, I made a calculation of runs above average for each pitcher and the average of the replacement pool. Again, the most important numbers in this calculation is the FIP of the individual pitchers and the 3.99 league average. These figure are plugged into the following calculation:

Runs Above/Below Average = (Lg Runs Against*(Player IP/9))-(Player FIP*(PlayerIP/9)

Replacement Pitching Runs Above/Below Average = (3.99*(26.2/9))-(3.83*(26.2/9) = .49 Runs Above Average

Aroldis Chapman Runs Above/Below Average = (3.99*(63.1/9))-(1.95*(63.1/9) = 14.33 Runs Above Average

The replacement pool was .49 runs above league average. The replacement pool averaged 26.2 innings pitched, or roughly three “games” per year. The replacement player would give up 11.48 runs a year over 26.2 innings based on a 3.83 FIP, which is .49 runs less than the 11.97 runs of the 3.99 league average over the same amount of innings. This calculation was done for each player. Chapman is given as an example above.

Finally, the Replacement Runs Above/Below Average is subtracted from Runs Above/Below Average for each individual player. The difference between the two is then divided by each player’s unique RPW value and the result is each pitcher’s WAR. For example, the difference between Chapman’s Runs Above Average and the Replacement Player’s Runs Above Average is 13.85. Chapman’s unique RPW is 4.45. This values Chapman at 3.11 WAR.

WAR = (Player Runs Above/Below Average — Replacement Runs Above/Below Average) / Player Unique RPW Value

(14.33-.49) = 13.84;

13.84/4.45 = 3.11 WAR

Before you glance at the tables below let me set out some more facts about the data:

  • The list of 300 pitchers does include starters who appeared in innings 7–9.
  • The list does not include every pitcher who appeared in innings 7–9 so the values in the chart are not exact. The exercise is meant to display the idea of an improved method to measure reliever value. My assumption would be that a more complete list would lead to an inferior measure of replacement.
  • The data is only looking at 7th-9th inning performance. It does not account for performance in extra innings, or performance prior to the 7th inning.
  • WAR is a counting stat, so WAR will be influenced by the amount of innings each player pitches.
  • The median calculated FIP WAR is .21 and the Average FIP WAR is .35. The 25th Percentile ranges from -1.67 to -.81. The 75th Percentile ranges from .71 to 3.2.
  • The median calculated ERA WAR is .26 and the Average ERA WAR is .5. The 25th Percentile ranges from -1.54 to -.27. The 75th Percentile ranges from 1.08 to 5.72.


Being Sunny About the Brewers

There is a lot of talk about tanking in baseball and the Milwaukee Brewers headline the conversation along with the Atlanta Braves and Philadelphia Phillies. The Brewers, unlike their counterparts in the cellar of baseball, are a respectable team as it stands. They are not a playoff a contender, but they are not a bad team; they are not a scourge; they are an average major-league team in a very good division.

The link the Brewers have to being a very bad baseball team revolves around what we assume they will do, and really, what they should do. But, before speaking of what they will do, it’s worth examining what David Stearns has done since taking over control of the team. The off-season has been a flurry of facially insignificant moves. Here, is a list of them:

  • Luis Sardinas was exchanged for Ramon Flores, an outfield prospect with the seemingly equivalent middling value of Sardinas as an infield prospect, in a trade with the Mariners
  • Javier Betancourt, a younger infield prospect of middling value, was acquired from the Tigers in return for Francisco Rodriguez
  • Jonathan Villar was acquired from the Astros in return for a Cy Sneed, a low-level pitching prospect
  • Jason Rogers, a 27 year old first base prospect sure to see some MLB playing time this year, was traded to Pittsburgh in return for Keon Broxton, an extremely athletic prospect that profiles as a potential versatile and competent fourth outfielder, in addition to pitcher Trey Supak
  • Adam Lind was sent to the Mariners in return for a trio of young, but not highly touted pitching prospects who have struck batters out at low-levels. Carlos Herrera (18), Daniel Missaki (19), and Freddy Peralta (19) are all lottery tickets, but one could always be a winner

They then went about picking up all your favorite team’s former favorite prospects, much like the Astros did when Stearns was working for them. Garin Cecchini was acquired from the Red Sox for cash; Will Middlebrooks was signed to a minor league contract; and Josmil Pinto was claimed off waivers.

Most recently, they replaced Jason Rogers and Adam Lind with Chris Carter, leaving them nearly where they started at first base, except they received five respectable prospects in return for the two first basemen sent out. Steamer projects Carter to post the best wOBA of the three (.333). There’s no loss occurring for the Brewers presently, with the potential of a marginal to hefty gain in the future.

The shuffling of first basemen has Milwaukee walking away with four young starters and a defensively capable outfielder. If one of those starters turns into a back-of-the-rotation pitcher and Broxton turns into a reliable major-league bench player then Milwaukee has won. Really, they win if any of these guys provide only one year of some sort of average major-league contribution, and they only lose if Rogers has an against all odds late-aged prospect emergence.

All of this happened before the re-build. The Brewers managed to maintain their same level of mediocrity, except they gained seven prospects to fill a depleted, and for the most part barren, farm system.

That’s the most exciting part of this. Stearns turned two prospects (Sardinas and Sneed) and three players that offered no value above what is currently on the roster (Francisco Rodriguez, Adam Lind, and Jason Rogers) into seven young prospects and a respectable utility infielder (Villar). The Brewers maintained all of their assets during the process. Now Stearns can focus on moving the real value for the type of players needed to drive a successful re-build.

First, take stock of what the Brewers have.

Jonathan Lucroy is still a very good catcher; Ryan Braun is still a very good outfielder; Khris Davis is an above average outfielder; Jean Segura and Scooter Gennett are an average middle infield; Chris Carter is a powerful first baseman; Wily Peralta and Jimmy Nelson resemble the kind of pitchers that are getting $70-$80 million in guaranteed contracts this winter, and the bullpen has capable arms in Will Smith, Michael Blazek, Jermey Jeffress and Corey Knebel.

Lucroy and Smith stand out among this group. They are very good players on very good contracts.

Jeff Sullivan wrote an article attempting to determine Lucroy’s value in a trade with the Rangers. In the end, he settled on a prospect package of Dillon Tate and Lewis Brinson. This seems right. These are two prospects you find in the second-half of Top 100 lists.

This would be a similar return to what the Brewers received from the Astros last year in the Carlos Gomez trade. They acquired Domingo Santana and Brett Phillips, two good-to-very-good outfield prospects. Gomez and Lucroy bear some similarities, in the sense that they field positions with limited talent and are above-average hitters and very good fielders at their positions. They both share an injury history that is not scary, but does give you pause, and they are both on below-market contracts for two more seasons (Gomez had two years on his contract entering 2015).

Just like teams do not have a wide selection of center fielders in the middle of the season, they have less of a selection of catchers that could add one to two wins after the trade deadline. If Lucroy stays healthy and plays like he did in 2012 and 2013, even less than his prime 2014, he is a rare commodity for a team that could upgrade at catcher.

You wouldn’t have much reason to know about the Milwaukee Brewers’ setup man, but you should know more Will Smith. He’s likely to close for the team this year after posting a declining 3.25 and 2.47 FIP over the past two seasons. He’s doesn’t light up a radar gun (with an average fastball velocity of 93.3 mph), but his slider has ranked the 10th-most effective among qualified relievers over that period (12.2 runs above average). His fastball leaves a little to be desired and it may keep him from being a dominant closer, however, he is a near elite left-handed reliever that is capable of pitching successfully against right-handed hitters as well (he actually did much better again right-handers in 2015, allowing a .545 OPS against right-handed hitters and a .785 against left-handed hitters, but did the opposite in 2014). Those kind of relievers fetch a lot in return at the trade deadline, particularly with an additional three years of team control beyond 2016.

In 2015 the Athletics received Corey Meisner from the Mets for Tyler Clippard, an aging, soon to be free agent Tyler Clippard. Two years ago the Orioles surrendered Eduardo Rodriguez to the Red Sox for soon to be free agent Andrew Miller. Smith isn’t Miller, but with continued success in 2016 he’ll be much more than Tyler Clippard was last July. Any acquisition in between the type of players Meisner and Rodriguez were at the time they were traded would be a haul for the Brewers.


This is the kind of situation that gets turned around quickly if the right decisions are made because of the small decisions made by Stearns and the new Brewers regime this off-season. Trades that will send Lucroy and Smith away from the team should return prospects that will slot into the top half of the farm system which already includes Domingo Santana, Brett Phillips, and Orlando Arcia. Stearns stacked the lower end of the system with a bunch of lottery tickets this off-season and if any hit the Brewers will accelerate the pace of their re-build even further.

Milwaukee is not a wealthy team, but they have proven in the past that they are not allergic to spending on free agents. If they catch the right breaks then they could be a couple of big free agent signings from being a competitive team in a competitive division a couple seasons from now.


You can see the path this team is taking by examining what they have done since October ended. Fans should enjoy the excitement of potential and embrace the pain of losing for now because it shouldn’t last that long. The wins will be all the sweeter when they start to come.

The following projections for 2016 were made using Steamer Projections. The projections are based on their roster as of 1/22/16, not on how it will change throughout the season.

The graphs shown below are three separate simulations of the Brewers playing a 162 game season 100 times. It represents the range of outcomes a team with their projected winning percentage could experience. 

2016 Brewers wOBA Expected Runs — 680 (.313 wOBA)

2016 Brewers FIP and Def Expected Runs — 687 (4.2 FIP, -18.8 Def)

2016 Brewers Pythagorean W-L — 80–82


Meet the 2016 Mets, A Good Enough Team

The Mets off-season has been very “Mets”. One could gripe, one could be happy, one could simply think it was reasonable. But it was undeniably the Alderson-Mets; a conservative off-season.

Mets fans will associate it with loss, more than gain. Many came to adore Yoenis Cespedes and he (or a bat like him) is thought of, more than anything else, as the type of piece needed for a return trip to the World Series. The failure to re-sign Cespedes (which is more of a refusal to sign Cespedes on part of the Mets) has drawn the ire of those same fans. I mean, my brother is a pretty calm and reasonable person, and I get e-mails like this:

“The Mets fucked themselves. Royals go out and steal Gordon for 4/$75M. What a joke. If Cespedes goes for this number, it will be an absolute shame.”

The truth is that Cespedes was a great fit for the Mets at the trade deadline but he was always an awkward fit in the long-term.

First, the Mets need a center fielder and while Cespedes can play center field, he is not a center fielder. He compiled a -4 DRS and -3.2 UZR in 312 innings in center field for the Mets last year. If you look back to his time in Oakland the results were similar. He’s played 912.1 innings in center field over his career and has compiled a -17 DRS and -12.6 UZR. So, if he’s not going to supplant Michael Conforto and you can’t make room for him in right field with Curtis Granderson having two more years on his contract, there is no home for Cespedes in the field.

Second, his acquisition coincided with the additions of Kelly Johnson and Juan Uribe, the debut of Michael Conforto, and the returns of Travis d’Arnaud and David Wright from injury. Cespedes probably ignited something qualitative in the team, while blasting 17 home runs after the trade, but the Mets have ample opportunity to replace his 1/3 of a season impact with a full season of the other things that propelled them to a NL East title.

These are arguments against bringing back Cespedes, but don’t even touch on the most obvious inevitability  —  Cespedes is unlikely to replicate his performance in August and September, nor his performance over the entirety of 2015. Cespedes is a very good baseball player, but he’s not the baseball player the Mets are looking for.


The real key to the 2016 Mets offense is Travis d’Arnaud. d’Arnaud is oft-injured, but when he is not he is a great player. He could be the best catcher in baseball, but he may also cobble together a half-season of play, losing multiple battles to the disabled list. d’Arnaud provided 2.3 fWAR and 1.7 bWAR in 2015 while only playing 67 games. When he plays he is an elite catcher, and a very good hitter, ranking 3rd in wRC+ (.131) and wOBA (.355) for catchers, trailing only Buster Posey and Kyle Schwarber. A full season of d’Arnaud could exceed the value of Cespedes in 1/3 of a season…by a lot.

In the outfield, the Mets are banking on what they have. A full season of Michael Conforto would be as impactful as a full season of d’Arnaud. Conforto provided nearly identical value to Cespedes down the stretch of the season, contributing 2.1 WAR, by both FanGraphs and Baseball Reference’s measure. Cespedes value was measured at 2.7 or 2.3 WAR, respectively. It’s unlikely that Conforto can extrapolate that performance over an entire season, but he doesn’t need to.

 The signing of Alejandro De Aza indicates the Mets are pushing it all in on Juan Lagares. Lagares will never be a great hitter, but if his elbow is healthy and he can revert back to something resembling the center fielder he was in 2013 and 2014, then Lagares will add a couple more wins in 2016 then he did 2015.

The team needs to hope that Conforto is an impact bat in the middle of the order, and Lagares reverts to his old form, because they should expect some sort of meaningful regression from Curtis Granderson, who will play his 35-year-old season this year and is coming off one of the quietest great seasons of 2015, where he contributed 5.1 WAR, the 19th highest total in the league.


The front office seems to have a strong belief that the depth provided by Kelly Johnson and Juan Uribe provided a large amount of value. This is the simplest rationale of the signing of Asdrubal Cabrera and a combined $14 million given to Cabrera and De Aza for 2016

Terry Collins will be able to shuffle the middle infield around injuries and match-ups with Wilmer Flores, Ruben Tejada, and Cabrera all capable of playing SS and 2B. Tejada and Flores will likely be able to slide over to 3B to relive Wright, who seems on track to start in an abbreviated amount of games in order to manage his spinal stenosis.

Finally, the Mets traded Jon Niese for Neil Walker. Walker provides equivalent value as Daniel Murphy and allows Dilson Herrera to spend one more year in the minors, or alternatively, gives the Mets a valuable trade asset to improve the team in July. Both make sense, although Herrera appeared to be ready to grab the second-base job — but between Herrera’s age (he won’t be 22 until August) and potential trade value, picking up Walker was the right move.


In sum, the Mets’ off-season wasn’t really one of gain or loss. Walker was the most obvious move: He provides nearly identical value to Murphy, while giving the Mets a little more glove in exchange for a little lighter bat. It wasn’t really an addition, but a replacement. Other than that, there were no other “moves”; just gambles. d’Arnaud is fragile, Conforto is young, and Lagares may not be good enough to start, at least in the context of this lineup. If all these gambles pay off, then the Mets’ off-season acquisitions will make perfect sense. Depth in the infield and outfield may be all they need. It just seems so rare, particularly for the Mets, that all these gambles pay off.

These do not feel like long-shot bets though. They seem reasonable and calculated. If you couple these bets with the belief that, in the aggregate, 3/4 of the season with Wright, a full-season of Matz and Syndergaard, and a full season of bench depth is worth 5–6 extra wins, then the Mets are a better team than the 2015 version, at least on a full-season basis.

And if it’s not good enough? Well, that’s what the prospects are for. Trade some. Unless it’s really not good enough, in which case, it was never going to be good enough. And that too is what the prospects are for  — the future.

If it wasn’t for last season’s World Series run, we’re probably more focused on the future of the Mets: Herrera replacing Walker; Dominic Smith replacing Duda; Brandon Nimmo platooning with Lagares and Granderson in 2017, all in tandem with a developing Conforto and the “young pitching.” However, the pitching staff is so good, the Mets can never abandon the present, but they also can’t screw up the future.

In light of all of this, the Mets’ off-season wasn’t bad, it wasn’t great, and it wasn’t exciting. It was good enough. They are taking a plunge into what they have, in light of what is coming and in fear of investing in a potentially flawed team. We’ll never know exactly what the Mets are thinking, but we know what they have done. The 2016 Mets were built with one eye on the future, one eye on the past, with neither taking too much time to glance at the present.

The following projections for 2016 were made using Steamer Projections

2016 Mets wOBA Expected Runs — 670 (.311 wOBA)

2016 Mets FIP and Def Expected Runs — 584 (3.57 FIP, -16.1 Def)

2016 Mets Pythagorean W-L — 92–70


Mike Leake and the Importance of Showing Up

Mike Leake is going to be paid $16 million dollars a year for the next five years. It seems to have people up in arms. This is why MLB ticket prices keep rising!

Mike Leake isn’t an elite pitcher. But he’s not the completely mediocre pitcher that he’s made out to be. He is a professional pitcher that has a track record of showing up to pitch. That holds a lot of value. There’s not many out there.

There are 30 teams in major-league baseball and, generally, they all use 5-man rotations. The best 150 pitchers would be all we would consider in a world with no injuries. We don’t live in that world.

We live in a world that has produced 851 qualifying pitcher seasons over the past 10 MLB seasons. A qualified pitcher needs to throw 162 innings, or one inning per game. In the case of starting pitchers who averaged 5 innings per appearance, that would be 33 starts. Essentially, to qualify you need to be on the mound consistently.

Since 2011, Leake’s five full seasons in the majors, there have been 195 pitchers who have combined for 429 qualifying seasons. That’s a little over 86 qualifying seasons per year.

Mike Leake has five of those seasons. Over those five seasons Leake has accumulated 8.9 WAR, or about 1.8 WAR per year. If we roll with the assumption that a win goes for between $7.5–8 million on the open market this deal makes perfect sense. But, this deal makes sense beyond that simple reason.

The Cardinals were a 100-win team. Their best pitcher from the prior year (Carlos Martinez) missed the playoffs with an elbow issues (not encouraging) but their best pitcher (Adam Wainwright) will be back healthy this year, which may compensate for some level of trepidation about Martinez’s durability and availability through 2016. Lance Lynn is done with Tommy John surgery and John Lackey has moved on to the Cubs. And while Leake hasn’t ever performed to the level Lackey did last year, or the level Lynn has over the past four years, he has shown the ability to eat innings at an above-average rate while throwing as an above-average pitcher.

Moreover, the things that Mike Leake doesn’t do well seem to be correctable and the Cardinals are an organization that tends to correct things.

First, Leake’s changeup is terrible. It may be time to consider scrapping that pitch altogether considering he possesses a slider and curveball that he uses regularly. The chart below, taken from BrooksBaseball.net, shows opponents’ slugging percentage against each of Leake’s offerings. As you can see the changeup hasn’t served any good since 2011. On the other hand, Leake’s slider has been improving where his changeup has been declining

A look at opponents’ batting average against tells the same story:

Leake’s second issue has been home runs. This is odd because Leake throws a sinker that often achieves its desired results. He has a 50.2% groundball rate for his career and 2014 and 2015 saw him induce the most groundballs in career, with 53.4% and 51.8% rates in those respective seasons. But when hitters put the ball in the air on Leake, they hit home runs at a 13.7% rate. This has been a consistent problem throughout Leake’s career, so it’s not as simple as looking at his xFIP and seeing hope for improvement.

This is where Leake’s biggest fault lies. If the Cardinals identify, or have identified, something to bring Leake’s home-run rate on fly balls down then they have just landed a bargain. But as of now, they landed a fair deal for a fair pitcher.

Mike Leake isn’t the reason tickets to a Cardinals game are expensive, but if you can make it out to the ballpark you’re going to see Mike Leake there, being Mike Leake; a professional pitcher; a reliable pitcher; a pitcher who shows up to work.


Don Mattingly’s Dodgers In the Context of wOBA Expected Runs

Weighted On-Base Percentage (wOBA) is typically considered to be the best measure of offensive ability and effect on runs scored among other rate statistics such as batting average, slugging percentage, and on-base percentage. 89.8% of a team’s runs scored correlates to wOBA between 2005–2015. I decided to look at a team’s performance, measured by how many runs they scored in a season, against the amount of runs wOBA predicted* they would have scored.  (wOBA Expected Runs was calculated based on a linear regression model with runs modeled as wOBA. The adjusted r-squared value of R~wOBA is .898)

Generally, the results are what you would expect. Teams deviate from their wOBA Expected Runs, but the 50% of the teams (between the 25th and 75th percentile of the observations) range between -17.49 and 16.9 runs from their wOBA Expected Runs.

The outliers even fall within the uncorrelated portion of the relationship between runs scored and wOBA. As stated above, wOBA explains 89.8% of runs between 2005 and 2015. At the far right of the graph is the 2008 Minnesota Twins, who scored 829 runs against their 756 wOBA Expected Runs. The difference, 73 runs, is less than the 10% of runs that is theoretically not explained by wOBA. At the far left of the graph is the 2005 Arizona Diamondbacks who scored 696 runs against their expected amount of 756. Again, this 60-run differential falls within the 10% gap we would expect.

The mean difference of runs scored from the wOBA Expected Runs Scored is minuscule (.003 runs) and the standard deviation from that mean is 24.9 runs. This all strengthens wOBA’s position as the best offensive run predictor.

What does this all have to do with Don Mattingly and the Dodgers? The graphs below show each team’s runs scored below or above their wOBA Expected Runs Scored. You’ll see that teams fall within the standard deviation of runs scored less wOBA Expected Runs (-25.93–24.87), with some exceptions. The exceptions that fall outside of that range generally do not display a tendency for extreme over- or under-performance of their wOBA Expected Runs in consecutive seasons; however one team does stand out.

The 2013–2015 Dodgers consistently under-performed their wOBA Expected Runs, with the following differences in the respective seasons from 2013–2015: -51, -33, and -58 runs. To put this in context, only 8 of 330 of teams, or roughly 2%, that took the field between 2005–2015 under-performed their wOBA Expected Runs by more than two standard deviations (-49.8). The 2013 and 2015 Los Angeles Dodgers were two of those teams. No other franchise appears on the list twice, much less twice within three seasons.

In Mattingly’s first two seasons with the Dodgers (2011 and 2012) the results were standard, with a -6 and +12 runs to wOBA Expected Runs differential, but when the Dodgers came under new ownership and started spending to bring in new players things changed. The team got better but their performance in relation to what they were doing got worse.

A glance at the graphs above will show that teams have under-performed their expectations, but never this badly for a three-year stretch. There is luck and there are trends, and the Dodgers are a trend of under-performance. Does this mean Don Mattingly is a bad manager? Maybe. Does it mean that Mattingly was a bad fit for this Dodgers team as constructed? Probably.

It could all be on the hitters; it could all be bad luck, but those seem unlikely. The 2013–2015 Dodgers are the worst offensive under-achievers in the last decade. The results suggest that Mattingly was unable to shuffle a cast of talented and enigmatic hitters into the right order to produce the best sequencing of results. Alternatively, the other narrative is that Mattingly was handed a group of talented and enigmatic hitters that couldn’t execute situational hitting and hit inconsistently. Either way, the Dodgers cost themselves a lot of wins through one, or a combination of the two narratives. The team lost 5, 3, and 5 wins each year, compared to if they met their wOBA Expected Runs, as calculated using the Runs per Win for 2013–2015.

This doesn’t necessarily bode poorly for Mattingly in Miami. The Marlins don’t have the benefit of a deep and talented bench. They are a fairly straight-forward offensive team that should allow Mattingly to write-up consistent lineups so long as the team remains healthy. This is not to say the Marlins will out-perform the Dodgers. It is to say that the Marlins may perform closer to how we would expect them to perform.

However, if the problem did not lie with Mattingly, but instead the Dodgers’ roster, than things do bode poorly for the Dodgers. It will be interesting to see if Dave Roberts can unlock something Mattingly could not; or whether the players are to blame; or whether Los Angeles must wait for Gabe Kapler, baseball’s philosopher-king, to set the runs free.


Trying to Figure Out What the Angels Are Doing

The Angels are an odd team. They are perennially competing for a spot in the playoffs and in 2014 they had the best record in the AL, but each year it seems that they are out-performing their talent.

The simplest explanation is that the team is buoyed by Mike Trout, which is true. A team with the best player in baseball, and always one of the highest payrolls in baseball, should not be lagging this much. The Angels should be more than a perennial playoff contender. They should be World Series contenders. So, if there ever was a time for Arte Moreno to hand out his money, it’s this off-season which provides the Halos with everything they need to resolve the biggest issues the team faces.

They currently have $130,278,770 in payroll obligations, excluding pre-arbitration and arbitration-eligible players. The Angels carried payrolls of $168,299,326 and $151,298,162 in 2014 and 2015, respectively. MLB Trade Rumors projects $20,100,000 in arbitration salaries for six players, which brings the Angels 2016 payroll for 14 players to $150,278,770. If you leave three spots open on the 40-man roster, giving the Angels three players to add through free agency, and estimate that the remaining 23 players will cost the Angels $500,000 each, or $11,500,000 total, it would bring the payroll to a best-case scenario of $161,728,770.

Arte Moreno has said he would cross the luxury tax threshold, but that seems more like PR than an actual possibility, so I’ll cap the potential payroll at $189,000,000. That leaves the Angels with $27,271,230 of money to spend before surpassing the luxury tax threshold.

The Angels could use an upgrade to their DH/1B depth and a player like Mike Napoli would fit well with them, but that’s not a pressing need. The bullpen is also an area that could improve, however it’s not really a dire situation.

The most glaring holes on the Angels roster are the third base position and a corner outfield spot. Technically, it’s left field, but Kole Calhoun can play in any corner, so someone who plays either right or left field would work. For that matter, they would be fine with a center fielder because Trout could probably flex out of center field if needed.

A trade, at least a meaningful one, is out of the question because the Angels gave up their only valuable assets in the Andrelton Simmons deal. That may have been a pretty big mistake depending on how much money they plan to spend this offseason.

There does not seem to be a better fit for the Angels than Daniel Murphy. He could be the solution they have been seeking in their search for a left handed bat to slide in the middle of the order. Murphy’s defensive ability, or lack thereof, is somewhat overblown. Metrics tend to be fairly neutral on him, and some of his misadventures at second base overshadow the fact that he’s a competent third baseman. That is where he would best serve the Angels. FanGraphs’ contract crowdsource pegs Murphy for a contract with a $12,000,000 average annual value. I think Murphy could end up getting more than that, but let’s roll with that. The Angels are now down to $15.3 million.

That brings us to the outfield. Jason Heyward, Yoenis Cespedes, and Justin Upton would all fit in Anaheim. However, the Angels could only afford one of them if they backload the contract, which is possible, but set that possibility aside for the moment.

The other options would be Denard Span, Gerardo Parra, Nori Aoki, and Rajai Davis.

Span would seem to be an unnecessary injury risk for a team that would need him on the field to compete for a World Series and does not have a great backup option for the position. However, a healthy Span is a good fit with the Angels. He would add some much needed speed to that lineup and would probably fit in their budget, costing around $12,000,000 on a three-year contract.

Alternatively, a platoon of Nori Aoki or Gerardo Parra with Rajai Davis would probably cost the team around $10,000,000 combined and would provide competent left field options.

The issue with Span or an Aoki or Parra/Davis platoon is that it just puts the Angels back where they were: in the mix. It doesn’t distinguish them, and it doesn’t make them World Series contenders. It’s not improbable that a team with Murphy and one of the lesser outfield options could make a World Series run, it’s just also not improbable they would be sitting at home in October.

And that’s my potential issue with the Andrelton Simmons trade.

There’s been some discussion on the best way to use minor league resources in light of the Red Sox’s trade for Craig Kimbrel. However, I think it’s much more interesting to examine the issue by looking at the Angels and what they gave up in their trade for Andrelton Simmons.

Sean Newcomb was one, and maybe the only, valuable asset that the Angels possessed that they could move in an attempt to improve the team. They undoubtedly did that by getting Andrelton Simmons, but Simmons didn’t solve any immediate issues. He’s an improvement over Erick Aybar, but Erick Aybar really wasn’t an issue. And the trade begs the question, are the Angels looking past this year? The main benefit of Simmons is what he brings the team in 2017 and 2018, being a very good shortstop under a reasonable contract.

I don’t know if Billy Eppler shopped Newcomb around for a player like Carlos Gonzalez or any other available outfielders. Maybe Newcomb wasn’t enough. And Jay Bruce seems like a good fit, but Jay Bruce is a bet; he’s one of those players whose reputation of past performance seems to outpace his recent performance (Bruce had -.9 WAR in 2014 and .1 in 2015. Steamer projects him to have a .6 WAR in 2016).

Maybe Billy Eppler has all the money he needs to add Heyward, Cespedes, or Upton, or maybe he’s convinced he has the ability to add one of them on a back-loaded contract. Jeff Weaver and C.J. Wilson are off the payroll next year and all payroll obligations owed to Josh Hamilton will be off the books after 2017, so the financial situation looks better in the future.

And there are a lot of alternatives here. The Angels could band-aid third base by bringing back David Freese, or adding Juan Uribe. That may leave them with enough money to bring in one of the marquee free agents, but it still leaves them short of being a baseball powerhouse. It just makes them another good team with a shot at making the playoffs.

All of this is to say that the Angels are an interesting team. Mike Trout keeps them on the brink of being very good each year, but if Arte Moreno is willing to spend like the Dodgers and Yankees the Angels could be great. If they added Daniel Murphy and Jason Heyward they would have to be considered one of the best teams in the league. However, if they added Simmons at the cost of only being able to address either their third base or corner outfield issue instead of addressing both, then it seems like a misuse of their only minor league asset, and of Mike Trout’s greatness.