Author Archive

Evaluating the Gap Between ERA and FIP

Fielding Independent Pitching (FIP) has displayed an ability to accurately measure a pitcher’s true skill. FanGraphs describes FIP succinctly as “a measurement of a pitcher’s performance that strips out the role of defense, luck, and sequencing, making it a more stable indicator of how a pitcher actually performed over a given period of time than a runs allowed based statistic that would be highly dependent on the quality of defense played behind him…”

This definition recognizes three factors that may differentiate the runs a pitcher is expected to surrender (FIP) versus the runs a pitcher actually surrenders.

  • Defense
  • Sequencing
  • Luck

FIP removes these factors by only measuring the events that are within control of the pitcher and therefore accurately reflect the skill of the pitcher. These events are strikeouts, walks, batters hit by pitch and home runs. All other events, which are balls put into play, may result in outs, bases, runs, or errors, but are outside the pitcher’s complete control.

The general measure of over- or under-performance of a pitcher’s true skill is ERA-FIP. ERA measures the earned runs given up by a pitcher based on all the events that happen, opposed to FIP’s measurement of runs given the limited events over which a pitcher has complete control. Therefore, the variance between ERA and FIP is attributed to the three factors noted above: defense, sequencing and luck.

But how much of the difference between pitching results and pitching skills are attributable to defense, sequencing, and luck, respectively? And shouldn’t the opponent get some credit for widening the gap between ERA and FIP, either to the benefit or detriment of the pitcher?

I compared Ultimate Zone Rating (UZR), Defensive Runs Saved (DRS), and FanGraphs’ Defensive Runs Above Average (DEF) to ERA-FIP for each team season between 2005–2015 to try to understand the effect of defense on pitching results.

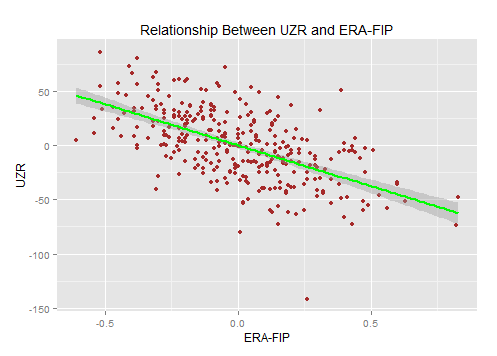
All the metrics have similar correlations, but DRS has the highest adjusted r-squared (correlation coefficient) value (.39), which measures how much of the variance in ERA-FIP is correlated by the defensive metric. FanGraphs’ DEF was right behind DRS (.37) and UZR had an adjusted correlation coefficient of (.34).

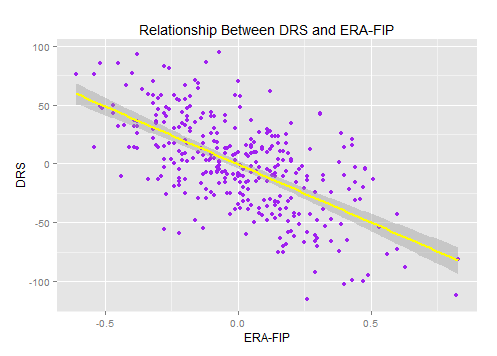
The result was somewhat surprising, because DRS and UZR do not factor in positional adjustments (UZR also does not measure catcher or pitcher defense). These metrics measure a player against the average player at that player’s position. They do not measure the difficulty of the position in comparison to other positions.

DEF does apply positional adjustments. FanGraphs uses UZR, not DRS, as the metric they apply the positional adjustments to in order to determine DEF. (see notes below for further explanation of positional adjustments)

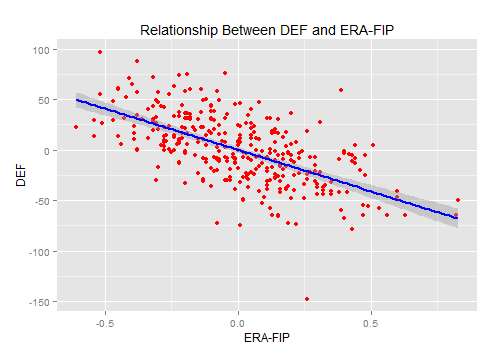
Still, the non-positionally adjusted DRS correlates most closely to ERA-FIP. However, it does seem that the advantage over DEF is negligible.

All in all, defense, considered alone, appears to explain 35–40% of a team’s ERA-FIP.

I chose to use a team’s Run Expectancy based on 24 base-out states (RE24) to measure the effects of sequencing. RE24 measures the change in run expectancy between the time a batter comes to the plate and the run expectancy after the plate appearance. The up and down of these changes will reflect the sequence of events experienced by each team (see notes below for further explanation of RE24).

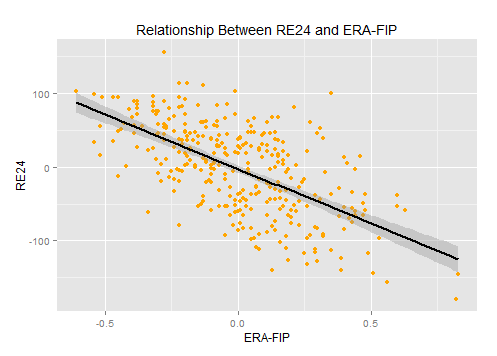
The relationship between ERA-FIP and RE 24 has a similar correlation coefficient (.38) as ERA-FIP and the defensive metrics. Sequencing seems to play a role nearly equal to defense in determining the over- or under-performance of pitchers.

Defense and sequencing are not exclusive though. The reason that the single in the bottom of the 9th occurred is likely related to the fact that the shortstop and/or third baseman did not have enough range to get to the groundball hit between them. Therefore, I measured the correlation of ERA-FIP to defense and sequencing.

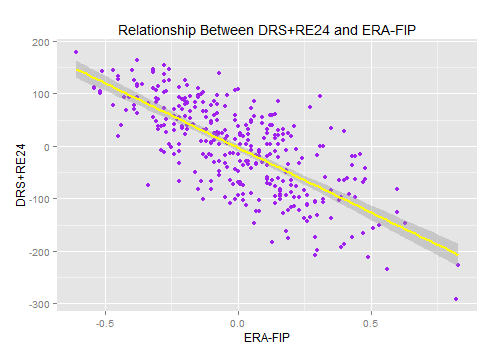
Again, DRS+RE24 (.54), DEF+RE24 (.53), and UZR+RE24 (.51) all yielded similar adjusted correlation coefficients.

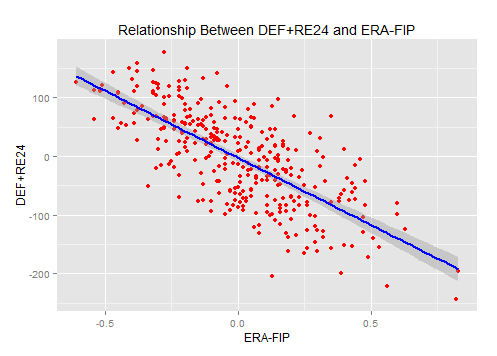
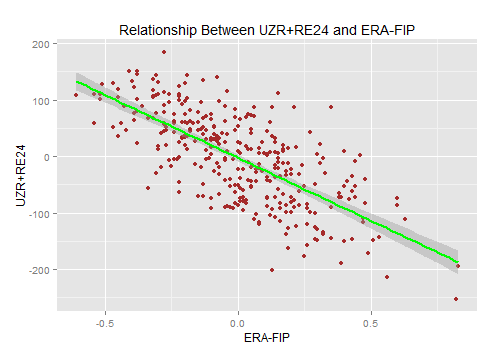
This suggests roughly 50% of the difference between ERA and FIP are correlated to defense and sequencing. The other half of the difference is not the great unknown, but it’s (sort of) immeasurable.

Luck is part of the other half of the gap between ERA and FIP, but is luck really 50% of what separates a pitcher’s result from a pitcher’s skill?

The skill of the opponent in running the bases is probably a greater part of the other 50% than luck is. This was on display in the playoffs, whether it’s Lorenzo Cain scoring from first on a single, Daniel Murphy taking third base from first base on a walk, or one of the other examples of aggressive (and smart) baserunning witnessed throughout the playoffs. These events change run probabilities and create runs. These base running events tend to be less noticed during the 162-game season, but they still happen.

Some of the ability for catchers and pitchers to prevent stolen bases is cooked into the defensive metrics, but not much else is. FanGraphs’ Base Running (BsR) measures the baserunning abilities of players and teams, from an offensive perspective, but to my knowledge there is no accumulated stat to measure opponents’ BsR. The data is out there. The same measures used to determine BsR would only have to be aggregated from the perspective of the pitching team.

A measure of Opponents’ BsR would likely cover a good amount of the uncorrelated variance between ERA and FIP. There would still be a lot of luck left in play, but probably not as much as there is thought to be now.


A Quick and Dirty Attempt to Find Justin Upton’s Trade Value

Players like Justin Upton aren’t usually available at the trade deadline. Upton ranks 35th in wOBA (.353) and 47th in WAR (8.9) between 2013 to the present.  Also of note, Upton is in his walk year.

So, how many players like Justin Upton have been traded in the past 10 years? I did a quick scan of deals made in June and July since 2005 and I found four similar players who were traded in their walk years.

1. Hunter Pence PHI->SF, 2012 (68th wOBA (.347) and 68th WAR (8.7), 2010-2012)

2. Carlos Beltran NYM->SF, 2011 (19th wOBA (.379) and 74th WAR (8.1), 2009-2011)

3. Matt Holiday OAK->STL, 2009 (4th wOBA (.410) and 6th WAR (18.2), 2007-2009)

4. Mark Teixiera ATL -> LAA (15th wOBA (.396), 17th WAR (14.8), 2006-2008)

The Mets received Zack Wheeler in return for Beltran and the Athletics received Brett Wallace in return for Holliday. Baseball America ranked Wheeler the 55th best prospect pre-2011 and Wallace was ranked 40th pre-2009. In the following years, pre-2012 and pre-2010, respectively, Wheeler was ranked 35th and Wallace was ranked 27th.

The Mets and Athletics did well in each trade. They received top prospects and non-deteriorating prospects (they were not losing value as prospects during the year they were traded for). This is evidenced by the ranking of Wheeler and Wallace in the season following the trade.

The Pence and Teixiera trades did not net the Phillies or Braves prospects. Each team received a major league asset, using “asset” in the loosest of ways.

The Phillies received Nate Schierholtz, who had totaled .9 WAR up to that point in 2012. They also received Seth Rosin, an A Ball pitcher, and Tommy Joseph, a AA catcher. Essentially, they received a replacement level player and organizational depth. 

The Braves received Casey Kotchman. Kotchman had totaled 2.1 WAR in 2008 with the Angels before the trade. He managed 3.7 WAR the year before. The Braves could not expect Kotchman to live up to his past billing (he was Baseball America’s 6th ranked prospect pre-2005), however, from the most optimistic perspective, they may have expected him to be worth 2 WAR per year over the remaining four years of team control. At least this is my best attempt to get in the head of the Braves’ front office seven years after the fact.

Now, I’ll attempt to determine Justin Upton’s trade value based upon these past trades.

Kevin Creagh and Steve DiMiceli published a study on Point of Pittsburgh that analyzed the value and future performance of prospects based on their ranking in the Baseball America’s Top 100 (the ranking was determined by the final appearance of the prospect in the rankings).  The article has a lot of information you should read regarding the dollar value of prospects and their potential to bust, but for purposes of this article, I am concerned with a prospect’s projected WAR over the six years of team control.

Hitters that rank between #26-50, which is Brett Wallace, project to have an average of 6.8 WAR. Pitchers ranked between #51-75 project to have 3.8 WAR. However, based on Wheeler’s fast rise up Baseball America’s list, I’ll factor in that pitchers ranked between #26-50 project to have 6.3 WAR. The average of the two is 5 WAR, which is the value I’ll place on Wheeler at the time the Mets traded for him.

Justin Upton is not Matt Holliday, circa 2009, and he is not quite Carlos Beltran, circa 2011, although he is much less of an injury risk than 2011 Beltran (who would go on to spend time on the DL for the Giants in 2011). Therefore, I project that the Padres should receive between 3.8-5.0 WAR in return for Upton. The return should scale up towards the higher side of that projection based upon an active and interested market for Upton.

Below is a list of potential Upton suitors and their prospects that appeared in Baseball America’s Top-100 rankings before the season began. The rank of the prospect is in parenthesis, followed by their Creagh and DiMiceli projected WAR. The prospects in bold represent the most likely return for Upton, however I included some prospects that are possibilities, but project to have more WAR value than should be expected in return for Upton.

Mets – Brandon Nimmo (45, 6.3), Dilson Herrera (46, 6.3), Amed Rosario (98, 4.1). I excluded Kevin Plawecki (63) and Michael Conforto (80) due to their major league role and rise to prominence, respectively. 

Pirates – Jameson Taillon (29, 6.3); Austin Meadows (41, 6.8); Josh Bell (64, 5); Reese McGuire (97, 4.1)

Cubs – C. J. Edwards (38, 6.3); Billy McKinney (83, 4.1)

Giants – Andrew Susac (88, 4.1)

Orioles – Dylan Bundy (48, 6.3); Hunter Harvey (68, 3.4)

Rays – Daniel Robertson (66, 5); Willy Adames (84, 4.1)

Royals – Raul Mondesi (28, 6.8), Brandon Finnegan (55, 3.4), Kyle Zimmer (75, 3.4), Sean Manaea (81, 3.5)

Twins – Jose Berrios (36, 6.3); Nick Gordon (61, 5); Alex Meyer (62, 3.4)

Astros – Mark Appel (31, 6.3)

A.J. Preller should feel (somewhat) vindicated regarding the Justin Upton portion of his winter experiment if he can get a player he likes that resembles the players on this list. However, it remains to be seen if he will chase after something safer, like the Braves in 2008, or squander an asset like the Phillies in 2012. In that case, he’s probably better off going all-in on the Padres he built for 2015.


The Mariners Need to Help Robinson Cano Help Himself

The struggles of Robinson Cano in 2015 have been talked about frequently, especially as the Mariners’ struggles continue. Recently, Mariners hitting coach Howard Johnson suggested that Cano is pressing at the plate. Cano disagreed with the assessment, but the numbers back up Johnson.

The good news is that when Robinson Cano is making contact, it’s been pretty good. Cano is hitting the ball harder than he has over his career. His hard hit percentage is 35.2%, compared to his career 32.9% mark.  The 24.4% of line drives on batted balls would be the third highest mark of his career, exceeding his 21.4% career average.

The bad news is where Cano is hitting the ball.  Cano is hitting out of character. In particular, Cano has had some difficulty, or aversion, to hitting the ball to the opposite field. The chart below shows Cano’s 2015 batted-ball locations and his career batted-ball locations.

Contact Location Pull% Cent% Oppo%
2015 38.6% 42.0% 19.3%
Career 37.5% 35.7% 26.8%

This is a big issue because he is muting his best hitting ability. Cano is a .369 hitter when hitting the ball to the opposite field. Last year he hit .417 when going the opposite way; in 2013 he hit .455. This year he is hitting .303, but he is not giving himself the opportunities to take advantage of the success that has been consistent throughout his career and stellar in his most recent seasons.

The impact of this shift can be displayed by taking Cano’s 174 plate appearances in which he has not walked or struck out, and allocating the results of where the ball is hit by his career average Pull%, Center%, and Oppo%. I then applied his career batting averages for the batted ball location to those figures.

Batted Ball Location Career Batted Ball Location Averages Batted Ball  Location At Bats Ending in Batted Ball Loaction Career Batting Average in Batted Ball Location Projected Hits in Batted Ball Location
Pull 37.5% Pull 65 .327 21
Center 35.7% Center 62 .370 23
Opposite 26.8% Opposite 47 .369 17

The following would be the resulting average on batted balls, batting average, and on-base percentage based upon Cano’s 40 strikeouts and 12 walks:

Average on Batted Balls 0.354
Batting Average 0.290
On Base Percentage 0.327

These numbers are good, but they are still not remarkable, and they don’t look like the numbers we would expect from Cano.

This leads to Cano’s second issue: increased strikeouts. Cano’s 17.5% strikeout rate is well above his career average of 11.2%.

The Baseball Info Solutions Plate Discipline data shows two figures that stand out. (1) Cano’s Contact% is down 3.9% from his career average and (2) Cano is seeing 5.4% more first-pitch strikes than he has over his career.

Contact% F-Strike%
2015 82.7% 65.9%
Career 86.8% 60.5%

Lets start with the second figure. This is nothing Cano has control over and the cause is almost certain to be the presence of Nelson Cruz behind him in the lineup. But how can Cano adjust to this? He’s a batter that’s used to being pitched carefully, particularly last year, when he was a hitting oasis in the desert that was the Mariners’ lineup.

The first figure, Cano’s drop in Contact%, may be tied back to where this article started and the point mentioned above: hitting approach and batting count. Cano has performed pitifully when facing sliders and changeups this year, two pitches he has handled well over his career (see the chart below displaying Baseball Info Solution’s runs above average/100 pitches for each pitch type Cano has faced). This makes sense if he is seeing pitches behind in the count, and if he is aggressively seeking to pull the ball, for additional power; to be worth $24 million a year, or whatever reason that may be causing the change in hitting approach.

wFB/C wSL/C wCT/C wCB/C wCH/C wSF/C wKN/C
2015 -0.44 -1.71 -1.46 1.92 -4.07 3.67 -4.66
Career 0.65 1.58 -0.3 1.65 1.65 1.65 0.66

Howard Johnson is probably right. Robinson Cano is pressing. Cano needs to approach at-bats like he has his whole career and he’ll see a return to what we would expect from Robinson Cano. However, the Mariners can make it easier on him by changing up the order. Maybe Cano isn’t a hitter that thrives on being pitched to. It may benefit the Mariners to swap Cruz and Cano in the order. While Cruz has been great, the Mariners and Cano have been the opposite. A change couldn’t hurt.

But first, Robinson Cano needs to accept the hitter he is, because that hitter is very good.