Evaluating the Gap Between ERA and FIP
Fielding Independent Pitching (FIP) has displayed an ability to accurately measure a pitcher’s true skill. FanGraphs describes FIP succinctly as “a measurement of a pitcher’s performance that strips out the role of defense, luck, and sequencing, making it a more stable indicator of how a pitcher actually performed over a given period of time than a runs allowed based statistic that would be highly dependent on the quality of defense played behind him…”
This definition recognizes three factors that may differentiate the runs a pitcher is expected to surrender (FIP) versus the runs a pitcher actually surrenders.
- Defense
- Sequencing
- Luck
FIP removes these factors by only measuring the events that are within control of the pitcher and therefore accurately reflect the skill of the pitcher. These events are strikeouts, walks, batters hit by pitch and home runs. All other events, which are balls put into play, may result in outs, bases, runs, or errors, but are outside the pitcher’s complete control.
The general measure of over- or under-performance of a pitcher’s true skill is ERA-FIP. ERA measures the earned runs given up by a pitcher based on all the events that happen, opposed to FIP’s measurement of runs given the limited events over which a pitcher has complete control. Therefore, the variance between ERA and FIP is attributed to the three factors noted above: defense, sequencing and luck.
But how much of the difference between pitching results and pitching skills are attributable to defense, sequencing, and luck, respectively? And shouldn’t the opponent get some credit for widening the gap between ERA and FIP, either to the benefit or detriment of the pitcher?
All the metrics have similar correlations, but DRS has the highest adjusted r-squared (correlation coefficient) value (.39), which measures how much of the variance in ERA-FIP is correlated by the defensive metric. FanGraphs’ DEF was right behind DRS (.37) and UZR had an adjusted correlation coefficient of (.34).
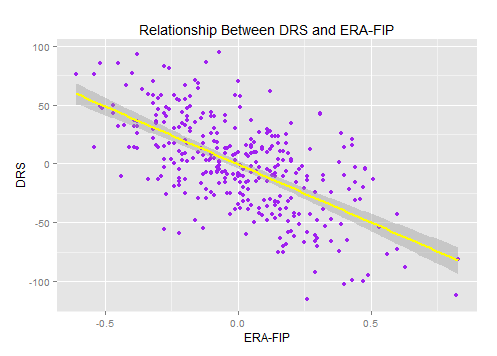
The result was somewhat surprising, because DRS and UZR do not factor in positional adjustments (UZR also does not measure catcher or pitcher defense). These metrics measure a player against the average player at that player’s position. They do not measure the difficulty of the position in comparison to other positions.
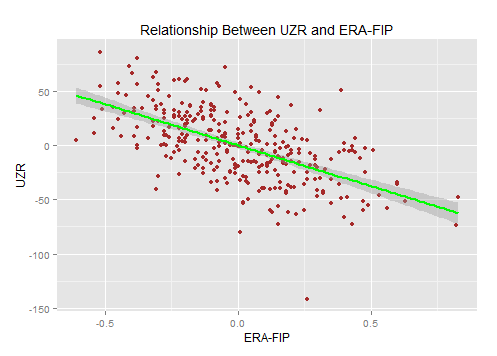
DEF does apply positional adjustments. FanGraphs uses UZR, not DRS, as the metric they apply the positional adjustments to in order to determine DEF. (see notes below for further explanation of positional adjustments)
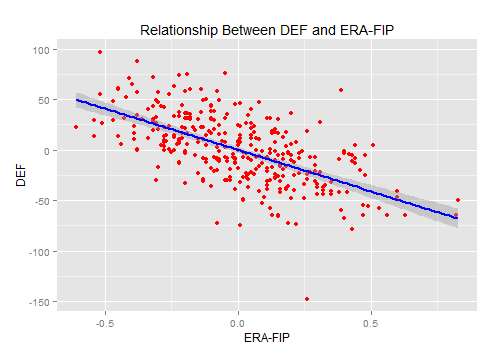
Still, the non-positionally adjusted DRS correlates most closely to ERA-FIP. However, it does seem that the advantage over DEF is negligible.
All in all, defense, considered alone, appears to explain 35–40% of a team’s ERA-FIP.
I chose to use a team’s Run Expectancy based on 24 base-out states (RE24) to measure the effects of sequencing. RE24 measures the change in run expectancy between the time a batter comes to the plate and the run expectancy after the plate appearance. The up and down of these changes will reflect the sequence of events experienced by each team (see notes below for further explanation of RE24).
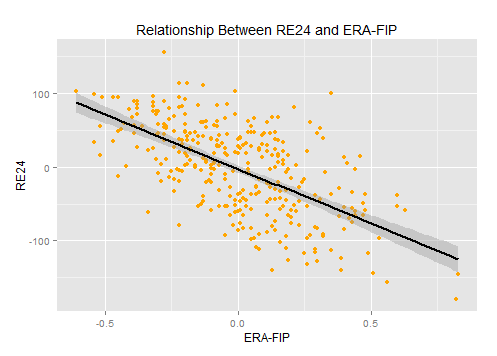
The relationship between ERA-FIP and RE 24 has a similar correlation coefficient (.38) as ERA-FIP and the defensive metrics. Sequencing seems to play a role nearly equal to defense in determining the over- or under-performance of pitchers.
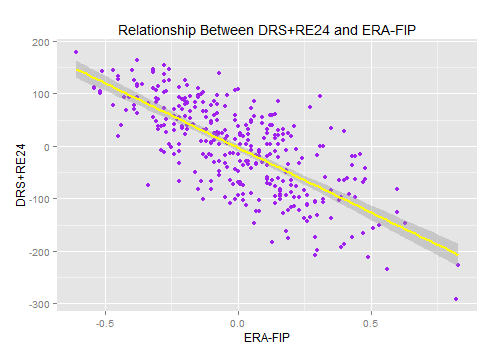
Again, DRS+RE24 (.54), DEF+RE24 (.53), and UZR+RE24 (.51) all yielded similar adjusted correlation coefficients.
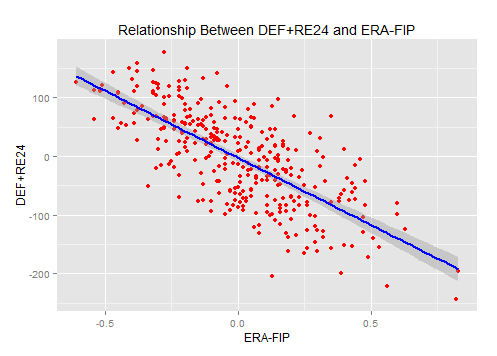
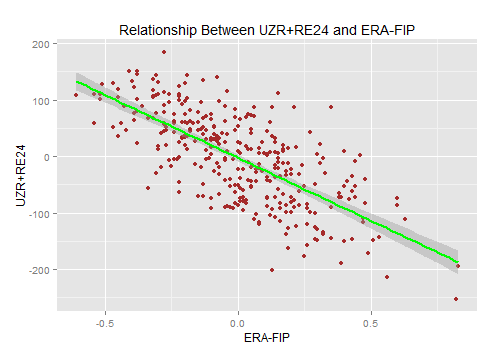
This suggests roughly 50% of the difference between ERA and FIP are correlated to defense and sequencing. The other half of the difference is not the great unknown, but it’s (sort of) immeasurable.
The skill of the opponent in running the bases is probably a greater part of the other 50% than luck is. This was on display in the playoffs, whether it’s Lorenzo Cain scoring from first on a single, Daniel Murphy taking third base from first base on a walk, or one of the other examples of aggressive (and smart) baserunning witnessed throughout the playoffs. These events change run probabilities and create runs. These base running events tend to be less noticed during the 162-game season, but they still happen.
Some of the ability for catchers and pitchers to prevent stolen bases is cooked into the defensive metrics, but not much else is. FanGraphs’ Base Running (BsR) measures the baserunning abilities of players and teams, from an offensive perspective, but to my knowledge there is no accumulated stat to measure opponents’ BsR. The data is out there. The same measures used to determine BsR would only have to be aggregated from the perspective of the pitching team.
A measure of Opponents’ BsR would likely cover a good amount of the uncorrelated variance between ERA and FIP. There would still be a lot of luck left in play, but probably not as much as there is thought to be now.
You can read more of my thoughts, opinions, and research on baseball at https://medium.com/simply-bases. Twitter: @simplybases.
FIP is a fair approximation for normal run environments. In extreme parks, however, it breaks down. The Rockies, for example, will usually have an ERA well above their FIP — and it’s not all due to defense. I.e., even though FIP accounts for the park-driven component of HR, BB and K rates in a given park, it does not necessarily account for the ways in which these events produce runs in that particular park.
I see where you’re coming from. This is why RE24 helps explain the gap. RE24 will look at the change in run probability after the event of each at bat, therefore it will measure the effect of each HR hit, proportionate to the actual runs produced by HR, or other event.
As an aside, I was surpurised to see that the Rockies HR/9 is pretty reasonable. The league average HR/9 from 2005-2015 is 1.002. The Rockies HR/9 has been, from highest to lowest: 1.25, 1.15, 1.11, 1.09, 1.09, 1, .96, .92, .88, .87, and .85.
A separate subject I always wanted to explore is how the Rockies should construct a roster. In a park with such an expansive outfield, I think the Rockies should focus on defense more, which may minimize the impact of the homeruns at Coors Field.
Thanks for reading. I hope you enjoyed the article.
I ended up really liking this article and finding those correlations interesting enough to look into this more myself.
However I kept saying….but popups….to myself while reading this.
If you ran this again folding popups in with each pitcher’s K’s to get a “pFIP” figure I wonder how much “luck” would collapse out.
Also a brief blurb on why popups which aren’t strictly fielding independent still deserve to get lumped in with K’s:
A lot of the consistent FIP out performers are frequent popup inducers like Chris Young, the Good Jered Weaver, and Huston Street. I believe the stat is something like 99.9% of infield popups in play get caught at the MLB level. I think batters reaching on a dropped 3rd strike is actually more common than a dropped infield fly or at least on par. There’s plenty out there about popups being a skill that’s pretty sticky year to year as well.
I think the issue with popups is that they are not a repeatable skills, outside of the rare exceptions. For example, infield fly balls propelled Jermey Hellickson to success in his first couple years, but as many predicted, his ability to induce them disappeared because they tend not to reflect a true skill.
However, there are pitchers like the ones you named who do seem to have a repeatable skill to induce soft contact or certain hit types.
I’m glad you enjoyed the article. Thanks for taking the time to add to the discussion.
Thanks for the reply. Perhaps rather than creating an alternate Popup inclusive FIP you could just run the correlation of popup% (IFFB/ Balls in play) with the ERA-FIP gap. Regardless of sustainability popups are automatic outs that are not being captured by FIP would be the idea.
Some articles about the sustainability of popups:
http://www.fangraphs.com/blogs/infield-flies-fip-and-war/
http://www.fangraphs.com/blogs/hitting-em-where-they-are/
http://www.fangraphs.com/community/babip-and-innings-pitched-plus-explaining-popups/
Let me look into IFFB and some other batted ball data.
I still think, especially on a team level, that this represents a part of luck. However, I do want to bridge the gap between ERA and FIP and I see how this may help.
I’ll update you on what I find.
scotman144, I analyzed the impact of infield fly balls and other batted ball types and I did not find an impact. I have to say, I’m a little disappointed because I was onboard with it!
It could easily be my method. I’m not a professional statastician, but I don’t think the relationship is there.
You can see why in detail over my blog: https://medium.com/simply-bases/update-further-evaluation-of-the-gap-between-era-and-fip-5209e60938c4?source=featured———2
Christopher- Thanks so much for taking a look. That’s too bad about popups however I guess it’s likely you’d need to have a whole staff of Chris Youngs to accumulate enough popups to have it show up at a team level ERA-FIP calculation.
The result was somewhat surprising, because DRS and UZR do not factor in positional adjustments
This isn’t really surprising. The total positional adjustment for the fielders on each team is the same (and is equal to zero).
I chose to use a team’s Run Expectancy based on 24 base-out states (RE24) to measure the effects of sequencing
I don’t think this works. RE24 doesn’t isolate the effect of sequencing from overall offensive performance (e.g. wOBA). RE24 will correlate very strongly (*) with RA and so will obviously correlate very strongly with ERA. Teams with a high ERA will obviously be more likely to have a positive ERA-FIP gap, which is what your correlation is showing. Something like RE24-wRAA might work, though there are park adjustment issues there.
(*) Perfectly if you include all events, e.g. stolen bases or advancing on wild pitches.
On further thought, RE24-wRAA doesn’t really work either because of the non-linear nature of run scoring. Maybe the best bet is to use a BaseRuns estimator and use RE24 – BaseRuns.
Great article! I hope you will post another article about what the makeup of the remaining 50% is 🙂
Tony Blengino does a lot of articles about contact quality suppression by certain pitchers; do you think this is part of the ‘unknown 50%’?
What exactly do we mean by luck? Does luck not apply to K, HR, HPB, and BB? Then of course we have the catcher framing problem…
Thanks for the read, let me address some of your questions:
1. On contract quality suppression and batted balls, see my discussion with scotman144 above.
2. By luck, it’s generally meant to mean results worse than expected results on the amount of balls put in play for that team or pitcher.
3. You could argue HR have some element of luck, as a lot of pitchers have HR Rates that vary from season to season, however K, BB, and HPB are directly related to pitcher skills of control,”stuff”, and pitching know-how.
4. Catcher framing could effect a pitcher’s Ks or BBs, but it shouldn’t effect what happens when the ball is put into play. So, catcher framing could affect FIP itself, but is unlikely to affect ERA-FIP.
Thanks for taking the time to respond! I’m not trying to play gotcha with your comments, just question some logic in case it may help with future research 😉
You could argue HR have some element of luck, as a lot of pitchers have HR Rates that vary from season to season, however K, BB, and HPB are directly related to pitcher skills of control,”stuff”, and pitching know-how.
It’s certainly not going out on a limb to say HR has a major element of luck (xFIP exists), and given xFIP’s imperfect year-to-year correlation, there is some (perhaps small) element of luck in BB/K/HBP too. I guess I was trying to say that using ‘luck’ to describe the remaining unknown isn’t much different than using ‘luck’ to describe the ERA-FIP gap in its entirety, and you’ve already disproved that.
So, catcher framing could affect FIP itself, but is unlikely to affect ERA-FIP.
Actually, if FIP is affected, then by definition ERA-FIP is also affected. The only way for ERA-FIP to *not* be affected is if catcher framing affects ERA and FIP in exactly the same magnitude.
I like the idea of using RE24 as a partial sequencing surrogate.
One measurable parameter that might affect RE24 is a pitcher’s ability from the stretch. As a rough check, I reviewed REW during 2005-2015. Starters have an REW range of roughly -17 to -60. Relievers, who most always pitch from the stretch, have an REW of 7 to 52. Pitching from the stretch isn’t the only variable affecting REW, but I would guess it has an effect.
*A High ERA-FIP pitcher’s “relative” ability from the stretch.
“Outside the pitcher’s complete control” is not exactly the same as “outside the pitcher’s control.” The pitcher plays defense, has a good deal to do with sequencing, and as for luck, that’s a slippery concept as used here. This is a useful piece, especially the part on defense. It does seem to me to assume that FIP is “right” as opposed to “a better approximation” – what we need, beyond the general decomposition of variance, is analysis of more specific cases/dynamics as you suggest re the Rockies.
In addition to the excellent comments by Paul above, I would add that treating sequencing as unrelated to luck probably misses the boat. I think it’s fair to assume that a pitcher has some control over sequencing (as does the batting order), I also think it’s fair to assume that there’s still a lot out of his control. Perhaps I’m just reading you wrong, but you seem to be making the point that the effects of sequencing are outside of the realm of luck “Luck is part of the other half of the gap between ERA and FIP, but is luck really 50% of what separates a pitcher’s result from a pitcher’s skill?“. So, yeah, you can attempt to suss out how much the effect of sequencing might have had on the difference between FIP and R/9 or ERA, but that doesn’t mean there wasn’t quite a bit of luck involved in the sequencing itself, even when you’re spreading things out by looking at team level results.
Paul Clarke – Every position is 0 for DRS and UZR as you said. Positional adjustments are not made for the difficulty for each position. For example, Fangraphs credits a catcher with +12.5 run when calculating DEF, before that catcher has done anything. That is what I mean by positional adjustment.
Paul Clarke & Nathaniel Duncan – RE24 will correlate to ERA-FIP for the reasons you stated. I’m just trying measure how much it correlates to ERA-FIP and explains the gap. There is certainly luck that effects RE24. I do not think it “purely” measures sequencing, but I think it’s the best stat available. I suppose you could measure the luck in sequencing by comparing a team’s RE24 to the league average RE24.
Thank you all for the comments and taking the time to provide feedback. These are all worthy considerations.
Basically put, RE24 is not going to get you where you want to go. RE24 for a whole inning is going to equal the number of runs scored during that inning minus the number of runs a typical team would be expected to score during that inning. So for a whole game, RE24 plus the league average of runs scored is going to equal R/9, which we already know. RE24 compared to FIP is not going to tell you anything with regard to sequencing that R/9 compared to FIP wouldn’t tell you. It’s only a matter of scale, because RE24 measures the difference between what a team actually scores compared to what a typical team could expect to score, rather than just the total number of runs that team scored. If there’s a difference between R/9 and FIP, you’re going to find a difference between RE24 and FIP. That’s what Paul meant when he said “RE24 will correlate very strongly (*) with RA and so will obviously correlate very strongly with ERA.” Measuring RE24 compared to FIP doesn’t isolate the effects of sequencing any more than measuring R/9 (or ERA) to FIP would do.
Now, you’re using ERA rather than R/9, but any difference between those two is going to be attributable to the official scorer or the defense.
I suppose I could be more helpful if I could tell you a sure-fire way to measure the effects of sequencing independent of defense and luck, but I’m not smart enough to know how to do that, and I’m not sure anyone else has figured out how to do it, either.
On the positional adjustments: the point is that when you’re looking at how team defence relates to something it doesn’t matter whether or not you include the positional adjustments, because they’ll be the same for all teams – it’s not like some teams play two outfielders and an extra shortstop. That’s why you get similar results regardless of whether you use Def, which includes the adjustments, or UZR/DRS, which don’t.
Great article!
I notice you show correlation coefficients as, say, .53, then say that roughly 50% of variance is explained by predictors. I think you’re confusing r and r-squared. If your coefficient (r) is .53, then your predictors explain 28% of the vairance. I’d love it if you can clarify here, since you may have been rightly reporting r-squared but calling it a coefficient. Seems a big difference in the take away message … Is half of the discrepancy unaccounted for or is it 72%?
Thank you for pointing this out! Loose/sloppy/incorrect language. All values are adjusted r-squared values.