The timeless struggle between pitcher and batter is one of dominance — who holds it and how. Both players use a repertoire of techniques to adapt to each other’s strategies in order to gain advantage, thereby winning the at-bat and, ultimately, the game.
These strategies can rely on everything from experience to data. In fact, baseball players rely heavily on data analytics in order to tell them how they’re swinging their bats, how well they’ll do in college, how they’ll perform at Wrigley versus Miller.
Big data has been used in baseball for decades — as early as the 60s. Bill James, however, was the first prominent sabermetrician, writing about the field in his Bill James Baseball Abstracts during the 80s. Sabermetrics are used to measure in-game performance and are often used by teams to prospect players.
Baseball fans familiar with sabermetrics, the A’s, and Brad Pitt have likely seen Moneyball, the Hollywood adaptation of Michael Lewis’ book. The book told the story of As manager Billy Beane’s use of sabermetrics to amass a winning team.
Sabermetrics is one way baseball teams use big data to leverage game theory in baseball — on a team-wide scale. However, by leveraging their data through the concepts of game theory on a smaller scale, baseball teams can help their men on mound out-duel those at the plate.
Game theory studies strategic decision making, not just in sports or games, but in any situation in which a decision must be made against another decision maker. In other words, it is the study of conflict.
Game theory uses mathematical models to analyze decisions. Most sports are zero-sum games, in which the decisions of one player (or team) will have a direct effect on the opposing player (or team). This creates an equilibrium which is known as the Nash equilibrium, named for the mathematician John Forbes Nash. What this means is that if a team scores a run, it is usually at the expense of the opposing team — likely based on an error by a fielder or a hit off a pitcher.
In the case of pitching, game theory — especially the use of the Nash equilibrium — can be used to predict pitch optimization for strategic purposes. Neil Paine of FiveThirtyEight advocates using big data and sabermetrics to analyze each pitch in a hurler’s armory, then cultivating the pitcher’s equilibrium — the perfect blend of pitches that will result in the highest number of strikeouts, etc.
Paine has gone so far as to create his own formula, the Nash Score, to predict which pitcher should throw which pitches in order to outwit batters.
In perfect game theory, the Nash equilibrium states that each game player uses a mix of strategies that is so effective, neither has incentive to change strategies. For pitchers, Paine’s Nash Score uses their data to find the optimal combination of pitches to combat batters, including frequency.
Paine does point out that creating this kind of equilibrium in baseball can be detrimental to a pitcher. He is, after all, playing against another human being who is just as capable of using game theory to adapt strategies to upset the equilibrium.
If a pitcher’s fastball is his best, and his Nash Score shows that he should be using it more often, savvy hitters are going to notice. “ . . . In time, the fastball will lose its effectiveness if it’s not balanced against, say, a change-up — even if the fastball is a far better pitch on paper,” writes Paine.
In this case, a mixed strategy is the best — in game theory, mixed strategies are best used when a player intends to keep his opponent guessing. Though pitch optimization using Paine’s Nash Score could lead to efficiency, allowing pitchers to throw fewer pitches for more innings, it could also lead to batters adapting much quicker to patterns, thus negating all the work.
In his first year of being eligible for arbitration, Matt Harvey will be able to substantially increase his salary for the 2016 season. Since beginning his career with the New York Mets in 2012, he has taken off to become an All-Star pitcher and fan favorite. His agent, Scott Boras, and the front office of the Mets will negotiate a one year salary based off his success in 2015. We’ll cut right to the chase and get into the hard numbers which will help us identify a rough projection of what we would expect Matt Harvey to receive this coming winter.
NEW YORK, NY – JULY 16: National League All-Star Matt Harvey #33 of the New York Mets pitches during the 84th MLB All-Star Game on July 16, 2013 at Citi Field in the Flushing neighborhood of the Queens borough of New York City. The American League defeated the National League 3-0. (Photo by Brace Hemmelgarn/Minnesota Twins/Getty Images)
Overall performance:
Since 2012, Matt Harvey at age 26 has a career 2.59 ERA with 24-17 win/loss record. During his 2013 season Harvey was on a tear with a 2.27 ERA and became one of the leading NL Cy Young candidates before his injury. He also started the 2013 All-Star game which happened to be in Citi Field that year. After tearing his UCL and missing the entire 2014 season, Harvey came back strong this year and has pitched in 26 games thus far with a 2.88 ERA through 171 innings (11th best in league). He has a 12-7 win record and gives up less than a hit per inning (which ranks 9th in all of MLB). His WHIP is also one of the top 10 leagues best at 1.03 so he rarely allows runners on base and is averaging 8.6 strikeouts per game.
His W/L record this season does not show his true value, as the Mets started the first half of the season with one of the worst offenses in the league. After acquiring premier Major League hitters such as Yoenis Cespedes and Juan Uribe, the Mets have led the league in runs scored giving Mets starters big run support. Since those acquisitions, Harvey has pitched in 7 games winning 3 and losing 0. But the Mets’ bullpen blew Harvey’s lead in 3 other games in which he had outperformed the other team. Had it not been for a mediocre bullpen, Harvey could have been 6-0 in 7 games since August 1st. Clearly, Harvey is an ace to this team and is the backbone of a staff that has propelled the Mets to first place. He is a consistent pitcher and does not show signs of letting up even after having TJ surgery. Without Harvey, the Mets would lose a dominant, consistent ace which is obviously hard to come by.
Leadership/Public appeal: As one of the older members on the New York Mets’ young pitching staff, Harvey is one the leaders on this team. After fighting his way back from injury rehab, he has become a consistent stronghold to the Mets’ rotation. Although Dr. Andrews, who performed Tommy John surgery on Harvey, has stated he should not exceed 180 innings due to his injury, Harvey is continuing to pitch on an innings watch to help the Mets win, especially through the postseason. Even if it hurts his chances at re-injuring himself, he is going out there to pitch.
As a leader, you need to show guts and heart; Harvey has definitely displayed that, battling out there everyday. Matt Harvey also is a fan favorite. He ranks 9th in all of Major League Baseball and 1st with the Mets in 2015 top jersey sales. Many fans across the country are purchasing his jersey, thus showing how popular he is with people. When he returned to the mound this season to pitch, his first game back drew the biggest crowd (39,000 fans) for the second home game of the season since Citi Field opened in 2009. That was 10,000 more fans in attendance than last year and 20,000 more than two years ago. During the 2013 All-Star game at Citi Field, which Harvey started, the Mets drew their most fans in history at 45,000. When he’s the night’s starting pitcher, fans flock to the ballpark to see Matt Harvey. At the same time he’s able to strikeout hitters, captivate a crowd and draw extra revenue in from ticket sales than if he wouldn’t be pitching. The Mets fans also have a popular nickname for Harvey: The Dark Knight. Symbolizing his leadership skills and journey back from Tommy John surgery, Harvey symbolizes the 2015 Mets team and has dramatically changed the mood of the fan base since his arrival/return. There’s no denying this.
Injury history: As stated earlier, Matt Harvey missed all of 2014 season undergoing Tommy John surgery to repair his torn UCL. His recovery has been a success thus far but is always a case for concern in the future. But arbitration cases do not quite debate the future; only his previous success. He has shown no discomfort and has spent 0 days on the disabled list this year. To combat future problems the Mets’ pitching staff went to a 6-man rotation, which has caused Harvey (and other Mets pitchers) to skip a couple starts. Harvey has constantly said he feels good and does not show any signs of slowing down unless the Mets management shut him down.
Performance of club:
The Mets are currently in first place by 6 games and it looks like it will stay that way come October. Largely in part due to Harvey’s success on the mound, the Mets would not be in the same situation without him or his 12 wins this season. When the playoff schedule arrives, Harvey will easily be the game 1 or game 2 starter depending on how he finishes the season.
Record of the players past compensation:
Harvey made MLB’s minimum salary in 2013 at $498,000 and this year at around $510,000. This will be his first eligible year of Arbitration 1. His value to the team over the last couple years has been sky-high but he’s been grossly underpaid.
Comparative salaries: Tyson Ross was arbitration 1 last year for the San Diego Padres. In his 2014 campaign he pitched to a 2.81 ERA / 1.211 WHIP with 13 wins in 191 innings pitched. He also struck out 9 hitters per inning and was named an All-Star that same season. But Ross pitches in a heavily favored pitcher’s ballpark. His stats at home included a 1.88 ERA with an 8-5 record but his away stats included a 3.79 ERA with a 5-9 record. Clearly, Ross does not pitch better on the road and his starts could have been affected by where he pitched. Compared to Harvey’s career numbers, he pitches more consistently than Ross at home (12-7, 2.15 ERA) and away (12-10, 3.14 ERA). From our previous numbers we know that Harvey has been a better pitcher overall this season in ERA, WHIP, wins and many other pitching statistics than Ross had in his 2014 season. Following Ross’ 2014 year, he was able to negotiate a 1yr/$5.25m deal in January. Ross is not as consistent and skilled as Matt Harvey. Since Harvey surpasses Ross in success we can see he is due much more in salary as well.
Chris Tillman is the next player we can compare to. Although a little less successful, Tillman was able to get a 1yr/$4.3m deal. The season prior to his arbitration, Tillman had a 13-6 record with a 3.34 ERA and struck out only 6.5 K/9 in 207 innings. Tillman is on the lower end of the comparison as he agreed to almost a million dollars less than Tyson Ross.
Summary:
These players give us the best guideline and recent examples in terms of numbers/dollars that can help us estimate what Harvey should be owed for the 2016 season. Harvey is definitely much better than Ross and Tillman. He brings more to the table than just numbers as he is a figurehead in New York, one of the largest markets in baseball. The first-place Mets could not be where they are if it was not for Harvey. His health was a concern earlier this year but he hasn’t had any setbacks this entire season except for skipping a start here or there. We can expect Harvey to easily surpass Tyson Ross and his $5.25m deal.
Due to the pizzazz of the Dark Knight, the revenues generated from his starts/jersey sales and the recent success of the team, Harvey should be able to negotiate himself around a 1yr/$6.3m deal. If we talk about fairness in terms of his contract, I think this is “fair” to both parties. We have to take into account everything that Harvey brings to the table and I think he’s more valuable than Ross and most previous pitchers who went to arbitration 1 and did not sign a multi-year deal. The one factor that could haunt Harvey’s dollar amount is his elbow due to TJ surgery. If that happens to wear out during the last couple of weeks in September and postseason, we can easily make a case that he should be owed less. But as for now he’s been Harvey-esque and back to where he was before the surgery. Next year his innings limit should be lifted or increased dramatically so there won’t be too much of a cause for concern compared to if he spent time on the DL this season. Obviously, he isn’t a sure bet that he will remain healthy but arbitration does not greatly take into consideration future success/problems, only previous. That is why we project him to get approximately $6.3m.
Overall, both sides will negotiate and the Mets will offer less than what I project. I could definitely see the Mets’ offering $5.5 to $6m. But Scott Boras will clearly try to get more for Harvey — I think around $7m. Both arguments will be justified. In the end, I think an arbitrator would agree that 1yr/$6.3m is common ground, a good midpoint and fit for an agreement by both parties. Stay tuned for more…
Since Baseball Info Solutions’ contact-quality data was uploaded here on FanGraphs, many attempts have been made to predict BABIP using said data without a great deal of success. So I tried breaking down the data by type of ball in play using the splits function on the leaderboards and results seem promising (for fly balls at least).
Data from 2012 season onward was used for hitters with minimum 250 PA as a qualifier (completely arbitrary).
Data on fly balls showed the best r-squared at 0.79 with the control variables being hard%, soft%, pull% and speed scores.
The usual suspects top the xAVG list: Paul Goldschmidt, Joey Votto, Chris Davis, Ryan Braun and Miguel Cabrera. But the most puzzling fact was Mike Trout’s .266 xAVG vs a .342 AVG. What does Trout do differently to beat the formula? I don’t know.
xAVG on groundballs correlated less well with average on grounders with an r-squared of 0.48. Though if one sets the PA qualification to 600 r-squared improves to 0.52. The lower r-squared on groundballs probably has to do with the fact that success on groundballs depends on not only hitting them hard but also hitting them in the gaps in the infield and no variable captures that effectively.
Mike Trout is restored to the place where he belongs, the top of the xAVG list with A.J Pollock, Adam Eaton, Carlos Gomez and Willie Bloomquist in the top five. Yasiel Puig’s xAVG shows the biggest difference from his average, probably because he has mastered hitting balls in the gaps.
Data on liners was the least promising with an r-squared of 0.21 between xAVG and average. Moreover the constant in the linear equation was the biggest term, meaning average on liners is mostly random. So there is only a slight positive effect on hitting liners hard and having a high average on liners.
Overall, contact-quality data is promising and we can get better estimates as we get more and more years’ worth of data. Data from 2002-2010 wasn’t used because it was manually collected and results-based while 2011 seems to differ from 2012-2015 data as league-average hard% seems to be 5% lower than normal.
My name is Rich Rieders and I am a 2015 graduate of Rutgers School of Law. Over the winter, I participated in Tulane University’s 9th Annual Baseball Arbitration Competition and we finished in 2nd place overall out of 40 teams. The arbitration cases used in the competition were Jenrry Mejia v. New York Mets, Lorenzo Cain v. Kansas City Royals, and Mark Trumbo v. Arizona Diamondbacks. My team represented the Royals, Mets and Mark Trumbo in those cases. It was a great experience and I learned a tremendous amount. Those of you who are in law school should absolutely participate. Being in New Orleans is an amazing bonus as well! You can read more about the competition from Tulane’s website and Jerry Crasnick’s ESPN article.
Instead of explaining how arbitration works, I highly recommend reading this article as it will give you an excellent basis for understanding the arbitration process. Just ignore the part about free agency since that’s been done away with now.
In order to prepare for the competition, I created a database (going back to 2008) consisting of all arbitration awards and players who signed 1-year contracts avoiding arbitration along with their respective statistics (Note multi-year contracts are not allowable as player comps for arbitration purposes). Using regression analysis, I was able to determine which statistics correlate most with salary.
Here on FanGraphs we pride ourselves on the use of metrics and the abandonment of traditional stats. That all goes out the window for the arbitration process. The arbitrators jointly selected by league and the union have a background in labor law, not baseball. And those that are baseball fans probably aren’t avid FanGraphs readers and their exposure is likely to be limited to Wins, Losses, ERA, H, HR BB, SO, etc. Each side gets 30 minutes to present their case, plus another 15 minutes of rebuttal. You simply don’t have time to teach the panel sabermetrics and argue your case at the same time. And as I will discuss later, the use of predictive stats largely fall outside the scope of an arbitration hearing anyway. However, by using regression analysis we can pinpoint exactly which stats correlate most with eventual salary and which ones don’t.
SP: W (.6099), IP (.5401), SO (.5368), RA9-WAR (.5166), GS (.4598)
Now that’s not to say only the stats with the highest RSQ matter. Traditional rate stats like K/9 and ERA are still important. Try arguing to a casual fan that a pitcher with an ERA of 2.50 was not as productive as pitcher with an ERA of 4.00 ERA and see how that goes.
What we can take away from this is that:
Traditional stats have a strong correlation, metrics do not.
Counting stats have a strong correlation, rate stats do not.
Offense, particularly power have a strong correlation and defense and baserunning do not.
The more playing time you receive (PA, IP, G), the more money you are likely to make.
In essence, the overarching principal behind baseball arbitration is that salary is almost wholly dependent on the accumulation of traditional counting stats with traditional rate stats used to highlight the difference between the comparable players and serves in my formula to help prevent outliers.
Individual awards also matter a great deal. In my hearing, it was extremely difficult to try and argue against Lorenzo Cain when he won the ALCS MVP with his breakout postseason fresh in everyone’s mind. Those type of factors are extremely difficult to overcome. For a real-life example, I heard a story from one of our judges that the Giants were planning on going to arbitration with Tim Lincecum in 2010. Lincecum showed up with a Cy Young Award under each arm and within a few hours, a two-year contract was agreed upon.
Also keep in mind that for players going through arbitration for the first time, we also consider their career numbers as well. The correlations are fairly similar for career stats, but with slight improvement for career rate stats. For players going through the process for a second, third or fourth time, we pretty much ignore career statistics.
Before I introduce the model, I want to stress the importance of understanding the purpose of the baseball arbitration process. During the final round in Tulane, we represented the Kansas City Royals against Lorenzo Cain. One of our principal arguments was that Lorenzo Cain had an unsustainable .380 BABIP (highest in MLB mind you) which is why he batted .300 and that his BA (and the rest of his offensive numbers) would likely regress towards his career averages. The expected regression along with his low walk rate would limit his value to the club going forward. An argument most of us on FanGraphs would surely have made at the time, but Lorenzo Cain’s awesomeness is a topic for another day.
While this type of logic works perfectly well for free-agent signings or whether to acquire the player via trade, it does not work for arbitration purposes. The underlying purpose of the arbitration process is to compensate the player for his performance in the previous season, NOT to compensate him based on what we expect he will do the following season. This is absolutely critical. Hence, for arbitration purposes, the fact that a player was lucky, his performance was unsustainable or anything along the lines of “he won’t be as good as he was last season” is not permissible. This works the same for underachievers too as teams will get the benefit at arbitration when a player was “unlucky.”
Keeping all this in mind, what I have been able to do is determine which statistics (and other factors) matter the most when it comes to arbitration salaries and have created a formula that can accurately predict the salaries of future players by plugging in certain statistics. You may have seen similar work featured on MLBTradeRumors.com, however, the raw numbers produced by my formula are more accurate and contain less variance than their model’s adjusted projections. The 2015 arbitration projections on MLBTradeRumors featured an average error of $303,061 with a standard deviation of $334,102. My unadjusted projections yield an average error of $283,094 with a standard deviation of $255,174. Not to mention that my formula does not have any built in restraints or adjustments, which would certainly help increase its accuracy even more.
While these projections aren’t perfect, we can get a pretty good idea of what arbitration-eligible players will receive. Using these projections we should be able to not only predict a player’s salary for the upcoming season, but with good long-range statistical modeling, we can reasonably project a player’s subsequent arbitration salaries as well.
How much will Matt Harvey earn before he reaches free agency? How many millions will TJS wind up costing him?
Should Kris Bryant sign an extension this winter or should he try to reach free agency as early as possible? What should each side do? What about someone coming to arbitration for the first time like Nolan Arenado?
How much money does a team stand to save by avoiding Super-2 or delaying free agency by a year? Should the type of hitter/pitcher influence the decision?
Were the Reds or Todd Frazier better off by agreeing to a 2-year, $12-million deal this winter instead of going through arbitration twice? What about a defense-first player like Juan Lagares?
How much money is a rebuilding team like the Phillies costing themselves over the next few years by using Ken Giles as a closer instead of as a “high-leverage reliever?” Should the Marlins not make Carter Capps their closer in 2016?
Which teams do the best when it comes to arbitration? Which ones do the worst? (More on that next time). What about the agencies?
Using my formula, these are the questions we can begin to answer now.
Yoenis Cespedes will be one of the most watched upcoming free agents this winter. He has become a coveted player on the market that has earned a huge payday. Cespedes defected from Cuba and signed a 4yr/36m deal (’12-’15) with the Oakland A’s in 2011. He immediately burst onto the scene as an offensive force hitting 20+ home runs, driving in at least 80 runs and slugging .450+ in each of his three seasons. After his success in Oakland, he became a journeyman over the last two seasons being traded to Boston, Detroit and then to the New York Mets this past July.
As a Met, he’s hitting .302 with 17 home runs and 42 RBI in 42 games after a week of hot hitting. Cespedes has totaled 2.9 Wins Above Replacement (WAR) with the Mets and his 6.9 WAR for the 2015 season ranks in the top 10 in the major leagues between both pitchers and hitters. Cespedes is a free agent this off-season but is a special case, as he can’t receive a qualifying offer for a draft pick. When Oakland signed Cespedes as a free agent out of Cuba, they took a significant gamble that he would be major-league ready, inserting him into their lineup right away. Cespedes’ contract requires that he be released after the season without the qualifying offer. The Mets would’ve retained exclusive negotiating rights for the first five days following the conclusion of the 2015 World Series. After that, they couldn’t negotiate with Cespedes until May 15, 2016. But due to the recent success and big gamble of a new payday from New York, Cespedes waived that part of his contract and will now be able to sign with New York at any time in the FA period.
Cespedes’ value with the Mets is astronomical. After acquiring him on July 31st the Mets have scored the most runs (311) in the majors since that time. Before the acquisition the Mets were 28th in the league! They had what was considered a minor-league offense. Although they did acquire Kelly Johnson and Juan Uribe, none have made more of an impact than Cespedes. What Cespedes brings to a team is power and pure run support. He became a catalyst for a struggling team and propelled them into first place. Almost all the hitters in their lineup have boosted numbers since that time as well. Pitchers can’t afford to pitch around batters in front of Cespedes. More guys are getting more pitches to hit resulting in more men on base for Cespedes to drive home. He also plays average defense and has a cannon for an arm.
INTERESTED BUYERS: I can see Cespedes re-signing with the Mets if they have a successful postseason. The fans along with the media would grill the front office/ownership if they did not get him back. That was the case this past trade deadline when GM Sandy Alderson was scrutinized for not making any moves until the final days leading up to July 31st. Roc Nation has the rights to negotiate his contract and as we saw from Cano’s FA market in 2013, they may try to get the most lucrative deal by waiting it out and reaching out to all interested teams. If the Mets want him back they are going to have to give him a big payday.
Some other clubs I can see having interest in Cespedes could be Baltimore, Houston, Miami, and San Diego (if they lose Justin Upton). I think the ones that just makes the most sense are Houston and Baltimore — they need to have more consistency, especially in their OF positions. Houston has Rasmus, Gomez and Springer. But Rasmus is a FA this offseason and Gomez has struggled. I think Cespedes provides that jolt to an offense that’s hard to find. He produces runs, which any offense needs. They could have Altuve, Correa and Springer/Gomez hit in front of Cespedes. That would be an incredible lineup. Throw in their great young staff and a decent back end of a lineup. That’s a scary team. Plus, they have the payroll to go out and get him. Right now its only about $72,000,000, but we’re not sure if ownership wants to go out and spend on one guy. They may try to find value elsewhere for cheaper which is something that General Manager Jeff Luhnow likes to do.
As for the Baltimore Orioles, they have Adam Jones in CF and could sign Cespedes to play LF. He has better defensive numbers in left and if the Orioles cannot sign 1B Chris Davis back I think they will strongly consider Cespedes. Baltimore has a ton of money coming off the books having only $41 million committed to next year so it seems as if they will have a lot of changes coming their way.
San Diego could be a good fit only if Justin Upton signs elsewhere, otherwise he’d be useless on a team that has three solid outfielders and no DH. We know AJ Preller could wave his magic wand at any moment and make something happen. Lastly, Miami could be a dark horse. They cut back on their spending in the last couple years but could look to make another “Marlin splash” with Yoenis Cespedes. Miami plays in a big Hispanic market and considering they are located not too far from Cuba, that could be influential in their decision-making. The excitement from the fans and a power-filled lineup would be tremendous. Just imagine facing a lineup with Dee Gordon, Yoenis Cespedes and Giancarlo Stanton…someone call Jack McKeon to manage this squad.
In the end, I think Cespedes does sign back with the Mets, especially if they have a deep postseason run. The Orioles are the second favorite. I think the fans/media will get on the front office/ownership to sign him back. The Wilpons might be cheap but after seeing this postseason run they are going to ask themselves, how could they not? Cespedes seems to like being the top dog on a team; with the Mets he’s exactly that. As Reggie Jackson would say, “the straw that stirs the drink.” Without him, they are very vulnerable, as shown before his acquisition.
In terms of his deal, I think he will get around $26 million average annual value (AAV). The big part is how many years he will be able to get. After seeing Roc Nation get Cano to sign for 10 years, I don’t think we will see another double-digit figure like that. It seems that most teams are trying to shy away from that long-term deal and rather give a 6/7/8yr contract with more AAV. So I believe Cespedes will most likely go for about 7 years but higher AAV. Although I don’t think we will be surprised if a front office came up to 8-9-10 years…it’s not every day a .290, 30+HR, 100+RBIs, 7 WAR guy comes on the market.
Similar players we can compare to: Shin Soo Choo – 7yr/130m (18m/AAV) and Jacoby Ellsbury – 7yr/153m (21m/AAV). Cespedes has better numbers than both these players, especially in the power department. Choo was a guy known more for getting on base and Ellsbury had his average/legs/defense behind him. There’s no doubt in our minds Cespedes will get more than these two. If we also take into consideration that for every 1 WAR, a player usually gets $7-8 million/yr. Cespedes this season already has 6.9 WAR. That’s incredible but he’s more likely not to keep that up and fall back to his career average of about 4-5 WAR per season. With that being said, 4-5 WAR equates to a very high salary. The Mets/other teams will probably go a bit overboard and give on the higher end as usual. I think he will get to 7 years/182m for 26m AAV. I don’t think any of these teams will go to 8 years or longer because of the history of longer contracts not working out. If anything this deal will contain more AAV.
As Jerry Seinfeld tweeted: “A Cespedes for the rest of us.”
PROJECTION: 7 years, $182 million with Mets or Orioles.
Innings pitched (IP) seems to be the standard for judging a player’s workload. Sure it will tell you how deep into a game a pitcher went and it’s often used as a measure of pitcher durability, but it tells you nothing about a pitcher’s effectiveness. A far more useful stat is the pitch count during each particular outing, or even better pitches per innings pitched (P/IP). I think we can all agree that all innings are made differently. A pitcher can throw three pitches or it can take 61 pitches as evidenced by Steve Trachsel (1997 – Chicago Cubs) and still get credit for 1 IP. Actually I think it’s possible to throw zero pitches and get 3 outs, but I don’t have the motivation to look up the rule at this particular moment.
Here are some stats for three players in the 2015 season.
Player
GS
W
L
IP
Player 1
27
11
10
159.2
Player 2
26
12
7
171.2
Player 3
30
12
10
169.1
All the players in the table above have very similar peripheral statistics, aside from an IP difference of 12 between players 1 and 2. From looking at these stats it’s a toss-up as to who has had the most successful season — do you choose player 2 since he has the most IP or player 3 since he’s made the most starts? In the table above Chris Heston is player 1, Matt Harvey is player 2 and Yovani Gallardo is player 3. What really separates the players is the pitch counts and P/IP.
Chris Heston – 2461 Pitches and 15.4 P/IP
Matt Harvey – 2533 Pitches and 14.8 P/IP
Yovani Gallardo – 2959 Pitches and 17.5 P/IP
Chris Heston has 12 IP less than Harvey but has thrown 72 fewer pitches this season. Harvey and Gallardo have thrown about the same amount of innings, but Gallardo has thrown 426 more pitches this season. The reason I chose Harvey as one of the pitchers for this comparison is due to the very public feud between the Mets, Boras and Harvey. In case you missed it, there was a disagreement with the innings limit imposed on Harvey in his first season after Tommy John surgery. Boras wants the Mets to stick to 180 IP while the Mets thought it was more of a soft cap. I wanted to look at the relationship between the IP in a season and the total number of pitches thrown. Luckily this data was readily available for download via FanGraphs, but only pitch counts back to 2002 were available. Below is a plot showing all pitchers who threw more than 100 innings in a season compared to their pitch counts. The data has a linear relationship, with the red line showing the mean and the outside black lines are the prediction intervals where we would expect 95% of the observations to fall within.
Now based on the 180 IP limit imposed on Matt Harvey, a linear model predicts that a pitcher would throw 2867 pitches in a season with an upper limit of 3158 and a lower limit of 2576. Now this means that at 180 IP we can reasonably expect a pitcher to throw between 2576 and 3158 pitches. Now for a guy coming off a major surgery, doesn’t a range of 582 pitches seem a bit extreme? It basically amounts to a difference of 5 complete games’ worth of pitches. In the plot below I also highlighted an innings range based on the range of innings where a pitcher throws 2867 pitches in a season. Now most importantly this range extends from 160 to 200 innings.
The medical team could just have easily set a limit anywhere between 160 and 200 IP. This is why an innings limit doesn’t work well in this situation; there is just too much variability in the data. In the future it will probably be a better idea for team officials and the medical staff to discuss a pitch limit over a season instead of an innings cap. Since the main goal of limiting a pitcher’s workload is to reduce stress on his arm I think the plot above does a good job showing that innings limits will have very little effect on actually managing a pitch count. Harvey is obviously thinking about the long term here because I know he doesn’t want to go through another surgery. After a second Tommy John the chances of a pitcher returning to the majors drops to somewhere around 30%, not to mention the drop in potential future earnings.
So I’ve shown you why I don’t think IP is a good indicator and now I’m going to show you why I think pitch counts and P/IP should be more important statistics. Based on the linear model shown in plot 1 the formula to predict pitches in a season is as follows: Pitches = IP*14.5 + 256.9. Now the intercept for this model is 256.9 which suggests that if you don’t throw a single inning in a season you would still be expected to have thrown 257 pitches. Obviously there is something going on at the lower inning totals, but we are going to ignore that for the purpose of this article. As an added note, the lower prediction interval from plot 1 has an intercept of -33.975, so we are very within range of showing 0 pitches for 0 IP from this model.
Player
IP
P/IP
P/IP Rank
Actual Pitches
Expected Pitches
Difference
Predicted IP
Chris Heston
159.2
15.4
24
2461
2565
-104
152
Matt Harvey
171.2
14.8
11
2533
2739
-206
157
Yovani Gallardo
169.1
17.5
84
2959
2708
251
186.1
Heston and Harvey both rank very high in P/IP among qualified starters while Gallardo is dead last among qualified starters. Efficiency is key here. Should Harvey be directly compared to Gallardo based on IP? No, absolutely not, Harvey is among the most efficient pitchers in the game this year. He has been able to get through innings while keeping his pitch count down and most importantly reducing stress on his arm. An inverse prediction based off pitch counts was used to predict the IP in the table above. Based on their pitch totals from this season Harvey and Heston have “thrown” less than their IP totals suggest and Gallardo has actually thrown quite a bit more. This has a big effect on that innings cap imposed on Harvey for this season. His stats show that he’s thrown 171.2 IP, but based on the number of actual pitches he’s thrown in game situations his number may be closer to 157 IP. Does that mean he should have the equivalent of 23 IP left in the tank for this season? Well that’s not up to me, but IP should less important than total pitches.
One thing I didn’t look at this article was the proportion of pitches thrown throughout the 2015 season. It’s been in the back of my mind, but I don’t have a reference for what the most stressful pitches are on a pitchers arm. I think it’s safe to assume that all pitches are not equal. Let’s think a Dickey knuckleball vs. Chapman fastball. The amount of effort needed for each pitch type is likely highly dependent on the pitch speed and type, but to simplify things here I’ve just assumed that all pitches are equal. We also need to realize that all pitchers are not equal, whether it be mechanics or individual variation in abilities. I was curious to see where Mark Buehrle’s pitch count (leaderboard here) lined up with all other pitcher since 2002 and lo and behold he’s thrown the most pitches since records became available. Obviously he doesn’t throw as hard as many of the other guys in the league, but that hasn’t stopped him from being a workhorse and one of the most effective pitchers over the last decade.
The Orioles are having a rough go of it. After being tied with the Yankees for first place in the AL East on July 2nd with a 42-37 record, the Orioles have gone 26-36 since and, as of September 13, are just a half-game above the last place Red Sox.
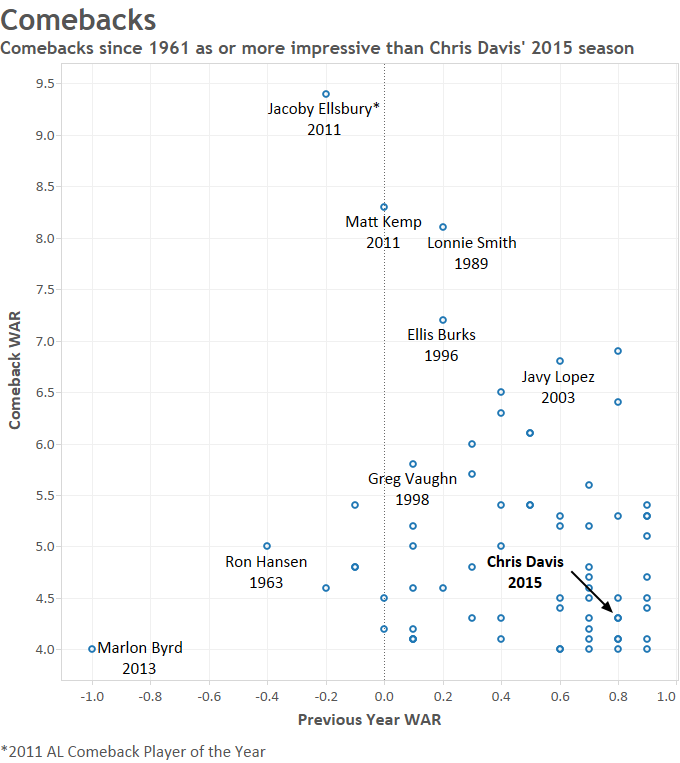
However, the standings don’t appear to be having an effect on Chris Davis, the slugging Orioles first baseman who is in the midst of a hot streak that includes 6 HR and a .493 OBP in his last 15 games. Davis’ recent performance continues his resurgence, bringing his average up to .261 and his home run total to 41 on September 13. Davis struggled mightily last year before a suspension for unapproved Adderall use cut short his season, finishing with 26 HR and a miserable .196 BA. A power surge couldn’t come at a better time for Davis, who is looking to make more money in the free-agent market this offseason.
Just how rare is Davis’ comeback, however? Davis was an established major-league player before this season, having played 723 games while averaging 2.0 WAR per 162 Games. His Oriole-record 53 homers in 2013 (which included 7.1 WAR) made him a star while his forgettable 0.8 WAR in 2014 made him just another one-hit wonder.
Examining position players with at least a full season’s worth of games played before their comeback season, we’ll set the following criteria for a comeback:
At least 2.0 WAR per 162 Games prior to the comeback year
The WAR for the comeback year is at least 4.0
The WAR for the previous year is less than 1.0
These baseline cutoffs are very similar to Chris Davis’ 2015/2014 experiences. Noting these, we find 70 comeback seasons since the beginning of the expansion era (1961) that fit the criteria.
Davis’ 2015 is bunched around Coco Crisp’s 2007 with the Red Sox and Victor Martinez’ 2014 with the Tigers. These players all saw their WAR increase by about 4.3 from their previous years.
The most impressive comeback in terms of WAR improvement was Jacoby Ellsbury’s 2011 with the Red Sox, when he put together a 9.4 WAR season after an injury-shortened -0.2 WAR season.
Overall, a comeback like Davis’ isn’t all that rare. In fact, comebacks as or more impressive happen about five times every four years. That shouldn’t deter Davis, however, whose performance is one of the bright spots on a struggling Orioles team.
In “Hardball Retrospective: Evaluating Scouting and Development Outcomes for the Modern-Era Franchises”, I placed every ballplayer in the modern era (from 1901-present) on their original team. Therefore, Ozzie Smith is listed on the Padres roster for the duration of his career while the Senators II / Rangers declare Jeff Burroughs and the Rays claim David Price. I calculated revised standings for every season based entirely on the performance of each team’s “original” players. I discuss every team’s “original” players and seasons at length along with organizational performance with respect to the Amateur Draft (or First-Year Player Draft), amateur free agent signings and other methods of player acquisition. Season standings, WAR and Win Shares totals for the “original” teams are compared against the “actual” team results to assess each franchise’s scouting, development and general management skills.
Expanding on my research for the book, the following series of articles will reveal the finest single-season rosters for every Major League organization based on overall rankings in OWAR and OWS along with the general managers and scouting directors that constructed the teams. “Hardball Retrospective” is available in digital format on Amazon, Barnes and Noble, GooglePlay, iTunes and KoboBooks. The paperback edition is available on Amazon, Barnes and Noble and CreateSpace.Supplemental Statistics, Charts and Graphs along with a discussion forum are offered at TuataraSoftware.com.
Don Daglow (Intellivision World Series Major League Baseball, Earl Weaver Baseball, Tony LaRussa Baseball) contributed the foreword for Hardball Retrospective. The foreword and preview of my book are accessible here.
Terminology
OWAR – Wins Above Replacement for players on “original” teams
OWS – Win Shares for players on “original” teams
OPW% – Pythagorean Won-Loss record for the “original” teams
Assessment
The 1986 New York Mets OWAR: 59.3 OWS: 299 OPW%: .589
GM Frank Cashen acquired 54% (27/50) of the ballplayers on the 1986 Mets roster while Joe McDonald procured 34% (17/50). Based on the revised standings the “Original” 1986 Mets cruised to the pennant with 95 victories, easily outdistancing the runner-up Phillies and pacing the National League in OWAR and OWS.
The Metropolitans’ rotation featured two future Hall of Fame hurlers (Tom Seaver and Nolan Ryan) alongside the 1985 and 1986 NL Cy Young Award winners (Dwight Gooden and Mike Scott). Scott wielded a wicked split-finger fastball against the opposition and the results were astonishing. He led the Senior Circuit with a 2.22 ERA, 0.923 WHIP and whiffed 306 batsmen in 275.1 innings. Gooden aka “Dr. K” followed his dominant 1985 campaign with a 17-6 record and a 2.84 ERA while recording 200 strikeouts for the third consecutive season. Floyd Youmans tallied 202 punch-outs and notched 13 victories despite allowing a League-worst 118 bases on balls. Roger McDowell posted 22 saves and accrued 14 victories in relief. Jeff “Terminator” Reardon contributed 35 saves and Calvin Schiraldi fashioned a 1.41 ERA while closing out nine contests. Greg A. Harris added 10 wins and 20 saves as a part-time closer.
ROTATION
POS
WAR
WS
Mike Scott
SP
8.3
26.61
Dwight Gooden
SP
4.06
17.76
Tom Seaver
SP
2.79
10.2
Floyd Youmans
SP
2.68
13.06
Nolan Ryan
SP
2.26
11.31
BULLPEN
POS
WAR
WS
Calvin Schiraldi
RP
2.37
10.45
Greg A. Harris
RP
2.16
14.78
Roger McDowell
RP
1.15
15.71
Juan Berenguer
RP
1.07
5.42
Jeff Reardon
RP
-0.17
10.26
Tim Leary
SP
2.47
10.83
Neil Allen
SP
1.72
7.95
Rick Anderson
SP
0.81
3.75
Roy Lee Jackson
RP
0.55
3.57
Rick Aguilera
SP
0.54
5.91
Jay Tibbs
SP
0.51
7.68
Cliff Speck
RP
0.26
1.78
Dave Von Ohlen
RP
0.07
0.82
John Pacella
RP
0.03
0.51
Rick Ownbey
SW
0.02
1.61
Jeff Bittiger
SP
-0.03
0.48
Doug Sisk
RP
-0.03
4.2
Wes Gardner
RP
-0.04
0
Randy Myers
RP
-0.05
0.3
Bill Latham
SP
-0.35
0
Lenny “Nails” Dykstra achieved full-time status in his sophomore season and responded with a .295 BA with 31 stolen bases. Darryl Strawberry slammed 27 long balls, knocked in 93 runs and pilfered 28 bags from the cleanup slot. Jody Davis drilled 27 doubles and 21 circuit clouts. Mookie Wilson (.289, 25 SB) wreaked havoc on the basepaths and Wally Backman contributed a .320 BA. Kevin “World” Mitchell delivered a .277 BA with 22 two-base knocks in a utility role.
Seaver ranked sixth among pitchers according to Bill James in “The New Bill James Historical Baseball Abstract.” Eight ballplayers from the 1986 Mets roster placed in the “NBJHBA” top 100 rankings including Ryan (24th-P), Dykstra (44th-CF), Strawberry (47th-RF), Mitchell (51st-LF), Gooden (76th-P), Brooks (89th-3B) and Davis (90th-C).
LINEUP
POS
WAR
WS
Lenny Dykstra
CF
4.94
23.9
Mookie Wilson
LF
3.38
16.81
Hubie Brooks
SS
2.43
14.8
Darryl Strawberry
RF
3.94
24.43
Kevin Mitchell
3B/LF
2.12
14.39
Jody Davis
C
2.02
18.16
Wally Backman
2B
2.28
16.38
Lee Mazzilli
1B/LF
0.69
5.21
BENCH
POS
WAR
WS
Alex Trevino
C
1.44
7.6
Mike Fitzgerald
C
0.96
7.43
John Gibbons
C
0.57
2.38
Jose Oquendo
SS
0.53
4.21
Dave Magadan
1B
0.19
1.25
Rusty Tillman
RF
0.07
1.07
Stan Jefferson
CF
0.02
0.51
Brian J. Giles
2B
-0.06
0.28
Eddie Williams
LF
-0.09
0
Kevin Elster
SS
-0.12
0.72
Barry Lyons
C
-0.13
0
LaSchelle Tarver
CF
-0.32
0.18
Herm Winningham
CF
-0.34
2.6
Ronn Reynolds
C
-0.35
0.98
Dave Cochrane
3B
-0.42
0.24
Manuel Lee
2B
-0.44
0.91
Billy Beane
LF
-1.25
0.94
The “Original” 1986 New York Mets roster
NAME
POS
WAR
WS
General Manager
Scouting Director
Mike Scott
SP
8.3
26.61
Joe McDonald
Lenny Dykstra
CF
4.94
23.9
Frank Cashen
Joe McIlvane
Dwight Gooden
SP
4.06
17.76
Frank Cashen
Joe McIlvane
Darryl Strawberry
RF
3.94
24.43
Frank Cashen
Pete Gebrian
Mookie Wilson
LF
3.38
16.81
Joe McDonald
Tom Seaver
SP
2.79
10.2
George Weiss
Floyd Youmans
SP
2.68
13.06
Frank Cashen
Joe McIlvane
Tim Leary
SP
2.47
10.83
Joe McDonald
Hubie Brooks
SS
2.43
14.8
Joe McDonald
Calvin Schiraldi
RP
2.37
10.45
Frank Cashen
Joe McIlvane
Wally Backman
2B
2.28
16.38
Joe McDonald
Nolan Ryan
SP
2.26
11.31
George Weiss
Greg Harris
RP
2.16
14.78
Joe McDonald
Kevin Mitchell
LF
2.12
14.39
Frank Cashen
Pete Gebrian
Jody Davis
C
2.02
18.16
Joe McDonald
Neil Allen
SP
1.72
7.95
Joe McDonald
Alex Trevino
C
1.44
7.6
Bob Scheffing
Nelson Burbink
Roger McDowell
RP
1.15
15.71
Frank Cashen
Joe McIlvane
Juan Berenguer
RP
1.07
5.42
Joe McDonald
Mike Fitzgerald
C
0.96
7.43
Joe McDonald
Rick Anderson
SP
0.81
3.75
Joe McDonald
Lee Mazzilli
LF
0.69
5.21
Bob Scheffing
Nelson Burbink
John Gibbons
C
0.57
2.38
Frank Cashen
Pete Gebrian
Roy Lee Jackson
RP
0.55
3.57
Joe McDonald
Rick Aguilera
SP
0.54
5.91
Frank Cashen
Joe McIlvane
Jose Oquendo
SS
0.53
4.21
Joe McDonald
Jay Tibbs
SP
0.51
7.68
Frank Cashen
Pete Gebrian
Cliff Speck
RP
0.26
1.78
Bob Scheffing
Nelson Burbink
Dave Magadan
1B
0.19
1.25
Frank Cashen
Joe McIlvane
Dave Von Ohlen
RP
0.07
0.82
Joe McDonald
Rusty Tillman
RF
0.07
1.07
Joe McDonald
John Pacella
RP
0.03
0.51
Bob Scheffing
Nelson Burbink
Rick Ownbey
SW
0.02
1.61
Frank Cashen
Pete Gebrian
Stan Jefferson
CF
0.02
0.51
Frank Cashen
Joe McIlvane
Jeff Bittiger
SP
-0.03
0.48
Frank Cashen
Pete Gebrian
Doug Sisk
RP
-0.03
4.2
Frank Cashen
Pete Gebrian
Wes Gardner
RP
-0.04
0
Frank Cashen
Joe McIlvane
Randy Myers
RP
-0.05
0.3
Frank Cashen
Joe McIlvane
Brian Giles
2B
-0.06
0.28
Joe McDonald
Eddie Williams
LF
-0.09
0
Frank Cashen
Joe McIlvane
Kevin Elster
SS
-0.12
0.72
Frank Cashen
Joe McIlvane
Barry Lyons
C
-0.13
0
Frank Cashen
Joe McIlvane
Jeff Reardon
RP
-0.17
10.26
Joe McDonald
LaSchelle Tarver
CF
-0.32
0.18
Frank Cashen
Pete Gebrian
Herm Winningham
CF
-0.34
2.6
Frank Cashen
Joe McIlvane
Ronn Reynolds
C
-0.35
0.98
Frank Cashen
Pete Gebrian
Bill Latham
SP
-0.35
0
Frank Cashen
Joe McIlvane
Dave Cochrane
3B
-0.42
0.24
Frank Cashen
Joe McIlvane
Manuel Lee
2B
-0.44
0.91
Frank Cashen
Joe McIlvane
Billy Beane
LF
-1.25
0.94
Frank Cashen
Pete Gebrian
Honorable Mention
The “Original” 1990 Mets OWAR: 49.2 OWS: 294 OPW%: .551
Lenny Dykstra (.325/9/60) swiped 33 bases, led the National League with 192 base hits and a .418 OBP while earning his first All-Star appearance. Darryl Strawberry launched 37 long balls and recorded a career-high 108 RBI. Kevin Mitchell belted 35 round-trippers and plated 93 baserunners following his MVP campaign in 1989. Dave Magadan registered a .328 BA and Gregg Jefferies paced the circuit with 40 two-baggers. Nolan Ryan aka “The Ryan Express” whiffed the most batsmen (232) for the fourth consecutive year. Dwight Gooden delivered a 19-7 mark with 223 strikeouts. Randy Myers notched 31 saves with a 2.08 ERA and finished fifth in the balloting for the NL Cy Young Award. Rick Aguilera saved 32 contests and fashioned an ERA of 2.76.
As with every year, there have been storylines that are unique to the 2015 baseball season. The remarkable infusion of young talent to the game. The relevance of the Cubs and Astros after years of being doormats. The disarray in Boston and Detroit. And, of interest here, the general ineptitude of the American League.
Many commentators have bemoaned how weak the American League is this season. You can get a sense of that by just perusing the standings. All data here are as of the start of play on Sunday, September 6.
The Red Sox, Mariners, Tigers, White Sox, and A’s–all expected to be good teams this year, picked by many to win their divisions or qualify as wild cards–have the five worst records in the league.
Two divisions have only two clubs with winning records, and there are only six teams in the entire league more than a game above .500.
The Royals lead the Central with the American League’s best record despite having the fourth worst starting pitcher ERA and FIP along with, this being the Royals, the fewest home runs and walks on offense. The second place Twins have been outscored. Again, nobody else in the division is above .500.
The National League West is led by the Astros, a year after losing 92 games and two years after losing 111. Manyoftheplayersintheirlineup have an on base percentage below .300 with the team. The Rangers are in second after losing their ace pitcher in spring training. The defending divisional champ Angels are treading water, just a game above .500.
Given that, one could argue that at least four of the best teams in baseball this year are in the National League, though one would get a counter-argument emanating along the Missouri/Kansas border. In any case, the Cardinals have the best record in the majors, the Pirates and Cubs third and fourth, the Dodgers tied for fifth, and the Mets eighth. The National League has the best teams, with the best records, making it the best league, right?
Except for one number: 89-73.
That’s roughly equal to the projected won-lost record for the Mets and Astros this year. That’s a good record. It’s good enough to win a soft division, good enough to make the playoffs in almost every year. An 89-73 team is a good ballclub.
But I didn’t list the 89-73 record because of the Mets and Astros. Rather, it has relevance for another reason: 89-73 is the record of American League teams against National League teams this year. Actually, it’s 151-123, but prorated over 162 games, it’s 89-73. The American League, on average, is the Rangers or Nationals playing against the Orioles or Red Sox: A .525 team playing a .475 team. The American League is, overall, clearly the superior league. And this shouldn’t come as a surprise; as Jeff Sullivan pointed out last year, the same occurred in 2014. And it happened in 2013. And 2012. And 2011. And every single year beginning in 2004.
How can that be? How can the top of the American League be unimpressive, the rest of the teams deeply flawed, yet the league is easily beating up on the National League?
There are two reasons. First, the National League may have the best teams, or at least most of them, but it absolutely runs the table on bad teams. The worst record in the majors this year is owned by the Phillies. They’re followed by the Braves. Then the Reds. Then the Marlins. Followed by the Rockies. The A’s are the next-worse, but then we return to the National League, with the Brewers. Six of the seven worst teams in the majors this year are in the National League. Those six teams, cumulatively, are 334-478, a .411 winning percentage, and 38-72 against the American League.
The second reason, closely related to the first, is parity. Yes, the American League doesn’t have the talented teams that the National League claims. But neither does it have the clunkers.When it comes to team performance, the National League is a stars-and-scrubs, penthouse-and-outhouse type of league. The American League is much more egalitarian. The teams with the six worst records in the American League are the A’s, Tigers, Red Sox, White Sox, Mariners, and Orioles. Those are six hugely disappointing teams, but they’re disappointing because they have talent, if underperforming talent. Those six teams, cumulatively, are 376-434, a .465 winning percentage, and 56-54 against the National League. Compare that to the six listed in the last paragraph.
Put this another way: You probably remember the term standard deviation from statistics classes. Without getting into the formulae, the standard deviation is a measure of variance. Given a normal distribution, about two-thirds of values (68.2%, to be precise) fall within one standard deviation of the mean. It’s a more precise term for “plus or minus.” Since 1998, the inaugural seasons of the Tampa Bay Rays and Arizona Diamondbacks, there have been 30 major-league teams. During that time, the average team won/lost percentage is .500 (duh). The standard deviation is .071. Over the course of a 162-game season, then, the average number of victories is 81 games (162 x .5), with a standard deviation of 11.6 games (162 x .071). If there’s a wide variation between teams in a league, its standard deviation will be higher. If there’s parity, it’ll be lower.
I calculated the standard deviations of team winning percentage for every season in each league from 1998 to 2015, giving me 36 league-seasons in total. I multiplied the result by 162 to express it in games. Again, in those 18 years, the average team wins 81 games, plus or minus 11.6. Here are five the seasons with the greatest standard deviations:
Year Lg SD
2002 AL 17.1
2001 AL 15.9
2003 AL 15.8
1998 NL 14.3
2004 NL 14.0
The 2001-2003 American League was the most unequal since 1998. The Mariners, with 302 wins in 2001-2003, including 116 in 2001, led the league in wins over the three seasons, which also featured outstanding teams in Oakland (301 wins) and New York (299). On the other side of the coin, Baltimore (288 losses), Tampa Bay (305 losses), and especially Detroit (321) were perennial doormats. This year’s National League, to date, is close to breaking the top five. It has a standard deviation of 13.2 games, which ranks eighth among the 36 league-seasons. It’s been a year of inequality in the Senior Circuit.
At the other extreme, here are the five seasons with the lowest standard deviations:
Year Lg SD 2015 AL 7.8 2007 NL 7.9 2006 NL 8.0 2000 AL 8.7 2005 NL 8.8
The 2005-2007 National League had only one team win 100 games (the 2005 Cardinals) and only one lose as many as 96 (the 2006 Cubs). In 2007, every team had between 71 (Giants and Marlins) and 90 (Diamondbacks and Rockies) wins. But that level of parity doesn’t match the 2015 American League so far. This year’s American League is on pace for the most egalitarian distribution of wins and losses in the 30-team era. It’s Sweden to the National League’s Honduras! Or something like that.
So what’re the takeaways? The record level parity in the American League to date has smoothed out the top and bottom of the league, resulting in hardly any notably bad or notably good teams. But that parity shouldn’t be mistaken for weakness. The American League is the better league overall, as evidenced by its clearly superior record in interleague play. The National League may have the best teams, but the American League remains the best league.
Much has been made of Ray Searage, and his ability to get the most out of Pitchers. In April Jeff Sullivan wrote an article on FanGraphs about Ray Searage’s work on Arquimedes Caminero and his rise in fastball velocity. Another article was written on Rant Sports last October about how the Pirates are lucky that Searage has not been offered a manager’s job due to his proven ability to get the best out of his pitchers. There have definitely been numerous examples of pitchers who have improved once they got to Pittsburgh, including Burnett, Liriano, Volquez, Worley, Caminero (as mentioned in Sullivan’s article) and this year J.A. Happ. Happ was the pitcher who motivated me to do this article, since he has had so much success after coming over from Seattle, with another great outing last Friday night against the Cardinals. With all these examples of pitchers improving on the Pirates, it seemed like there might be something here that could be quantified.
cFIP
I wanted to use Jonathan Judge’s new statistic cFIP (FIP in Context) to quantify the pitchers’ success, since it adjusts for ballpark, league, defense and many other things, including opposition quality which many other statistics fail to do. cFIP, much like FIP-, is set to a scale on which 100 is average, and 100 – x means the player was x% above average. If a player is x above 100, they would be x% below average (For example, a cFIP of 90 would be 10% above average, and a 110 would be 10% below average). This stat will account for almost any advantage you can think of when switching teams, so whether it was a hitters or pitchers park, strong or weak division, it should not matter. Not only that, but this article by Judge for the Hardball Times shows how cFIP is better than pretty much every alternative in predicting future performance, and shows what the player’s true-talent level is. If there is a consistent improvement in cFIP for these pitchers, it would point to a change in skill which could be attributed to Searage. On the other hand, if the cFIP did not seem to change considerably, then it would be more likely that either the Pirates were good at finding players who had an unlucky season (which cFIP can show) the year before and the uptick in success could be them preforming at their true-talent level. Either that or as always possible, the Pirates could just be getting lucky. Of course this could also be the case, if the pitchers did see an increase in cFIP.
The Process
First, I found all the pitchers who played one full season with the Pirates and one full season not with the Pirates in consecutive seasons. I grouped them based on whether or not they played with the Pirates on the first of the two seasons. Their Pirates season had to occur in 2011 or later, since that was Searage’s first full season as pitching coach. I limited the group to just starting pitchers who had started at least 10 games both seasons. I found the players cFIP on Baseball Prospectus and put it in an Excel spreadsheet. Unfortunately, players like Happ who switched to the Pirates mid-season could not be included, since cFIP was not recorded for players before and after they were traded, and only for the full season of data. I found the difference in cFIP between the Pirate and non-Pirate seasons (first season minus the second season), and used that to find a weighted difference based on their total games started between the two seasons (cFIP Difference * Games Started). I then averaged all players weighted differences in the group, to get the averaged weighted difference. For example, let’s say pitcher A has 50 total games started with a cFIP difference of 4 and pitcher B has 25 games and a difference of -6. The weighted average would be pitcher A’s games * difference + Pitcher B’s games * difference all divided by total games (You could add in a third, fourth, fifth pitcher and so on). This would turn out to be (4*50) + (-6*25) / (50+25) = 50/75, which is a 2/3% improvement.
Results
Here are the two tables of results with the weighted average difference in the bottom right corner.
Pitchers Joining the Pirates
Name
Year
Team
GS
cFIP
Total GS
Weighted Net cFIP
Average cFIP Improvement
A.J. Burnett
2011
NYA
32
102
A.J. Burnett
2012
PIT
31
97
63
315
A.J. Burnett
2014
PHI
34
113
A.J. Burnett
2015
PIT
21
95
55
990
Edinson Volquez
2013
TOT
32
112
Edinson Volquez
2014
PIT
31
111
63
63
Francisco Liriano
2012
TOT
28
92
Francisco Liriano
2013
PIT
26
84
54
432
Kevin Correia
2010
SDN
26
117
Kevin Correia
2011
PIT
26
122
52
-260
Vance Worley
2013
MIN
10
124
Vance Worley
2014
PIT
17
101
27
621
Total
196
856
4.37
Pitchers Leaving the Pirates
Name
Year
Team
GS
cFIP
Total GS
Weighted Net cFIP
Average cFIP Improvement
A.J. Burnett
2013
PIT
30
81
A.J. Burnett
2014
PHI
34
113
64
-2048
Edinson Volquez
2014
PIT
31
111
Edinson Volquez
2015
KCA
26
105
57
342
Erik Bedard
2012
PIT
24
100
Erik Bedard
2013
HOU
26
102
50
-100
Kevin Correia
2012
PIT
28
123
Kevin Correia
2013
MIN
31
116
59
413
Paul Maholm
2011
PIT
26
106
Paul Maholm
2012
TOT
31
105
57
57
Total
287
-1336
-4.66
As the tables show, when pitchers joined the Pirates, they gained a little more 4% on the league, but when pitchers left, they lost that 4% and even a tiny bit more. If these results were accurate, it would seem that the Pirates helped their pitchers in a way that could not be attributed to anything on the field, such as defense, since that is accounted for in cFIP. It could have to do with some sort of chemistry or some other sort of edge, that didn’t stay with them when they left. One hypothesis is that it could be attributed to the fact that they are one of the few teams to have a clubhouse traveling statistician who relays information to the players from the front office. I decided to take a little bit further look at these tables, however, and I found some other interesting results.
In the first table, the only pitcher to pitch on the Pirates in 2011 was Kevin Correia. This was Ray Searage’s first year as pitching coach, and you could easily say that he was still learning on the job, and that if he was giving some sort of edge, he had not mastered his skills yet. If you take out players who pitched for the Pirates in 2011, here is the new table.
Pitchers Joining the Pirates 2012-2015
Name
Year
Team
GS
cFIP
Total GS
Weighted Net cFIP
Average cFIP Improvement
A.J. Burnett
2011
NYA
32
102
A.J. Burnett
2012
PIT
31
97
63
315
A.J. Burnett
2014
PHI
34
113
A.J. Burnett
2015
PIT
21
95
55
990
Edinson Volquez
2013
TOT
32
112
Edinson Volquez
2014
PIT
31
111
63
63
Francisco Liriano
2012
TOT
28
92
Francisco Liriano
2013
PIT
26
84
54
432
Vance Worley
2013
MIN
10
124
Vance Worley
2014
PIT
17
101
27
621
Total
144
1116
7.75
You can see that the results are changed pretty dramatically, as now pitchers are improving by about 8% compared to the average pitcher. This is very significant, and we will get back to it later. Another change you could make to the Leaving Pitchers table is to take out Burnett, who seems to be an outlier (-2048 cFIP). This could lead to some interesting results, although there isn’t as much of a reason to take him out. After removing Burnett, as well as Maholm who pitched for the Pirates in 2011, you are left with only 3 players, but here are the results.
Pitchers Leaving the Pirates 2012-2015 (minus Burnett)
Name
Year
Team
GS
cFIP
Total GS
Weighted Net cFIP
Average cFIP Improvement
Edinson Volquez
2014
PIT
31
111
Edinson Volquez
2015
KCA
26
105
57
342
Erik Bedard
2012
PIT
24
100
Erik Bedard
2013
HOU
26
102
50
-100
Kevin Correia
2012
PIT
28
123
Kevin Correia
2013
MIN
31
116
59
413
Total
166
655
3.95
This time the results change even more significantly then before, as now pitchers improve by 4% on the league when they leave the Pirates. I am not suggesting that you can just remove Burnett from this list, as he definitely counts, but the fact that the results do a 180 reversal by removing one player (Maholm would have made the pitchers improve even more) shows two things. 1) That the data isn’t very conclusive, but also 2) that it looks like there is not much of a trend.
Putting this new information together, you can come to another conclusion. It seems recently that pitchers improve rather significantly when they come to the Pirates, but there isn’t much evidence they regress back to their original performance when they leave. This points directly to the option that Ray Searage is improving these players in ways that stick with them once they leave. There is by no means conclusive evidence with such a small data set and there are many other possible hypotheses, but by weeding through this data, it certainly looks like a strong possibility. The Pirates definitely should be thrilled that Searage has not gotten a job as a manager, even though he may provide more of an advantage as a pitching coach, where he can focus solely on helping his pitchers. If he keeps this up however, and a bigger sample size of data backs up these results, you can bet that he will at least get some interviews for a manager’s job.