Archive for ops

J.D. Martinez Will Be Productive in Six Years (And Maybe Seven)

While baseball fans wait for the free agent market to finally unthaw, J.D. Martinez waits for a contract offer enticing enough for him to sign. Early reports suggested that Martinez and his agent, Scott Boras, set an early asking price at seven years, $210 million. Clearly, nobody has taken the bait. Among Martinez’ likely suitors, many have moved onto other options; the Cardinals traded for Marcell Ozuna, and the Giants traded for Andrew McCutchen, seemingly leaving the Red Sox as Martinez’ lone serious suitor.

The latest report, from Buster Olney, is that Martinez has an offer on the table from the Red Sox worth five years, $100 million. Taking the reports at face value (although Boras himself has simply declared the report “inaccurate”), the offer obviously comes up short of Martinez’ demands, which is why this article is being written in late January to begin with. To that end, here’s an excerpt from Jeff Passan’s recent column at Yahoo Sports on baseball’s economic system:

“Recently, one of the best free agents available this offseason met with a friend, and he admitted something shocking: He was preparing to sit out until the middle of the season. The market for his services this winter was so thin, the offers so incompatible with his production, that he worried he was going to need an external force to compel teams to pay him what his numbers say he’s worth. Maybe it would take a playoff race.”

Can we assume that the hitter in question is Martinez? Of course not, but considering the discrepancy between his asking price and the reported Red Sox offer, it wouldn’t be an outlandish guess. While I understand that the Red Sox have leverage in that they presumably don’t have anyone to bid against, I will argue that Martinez will be well worth a contract in excess of 5/$100M.

From 2014-2017, his Age 26 through  Age 29 seasons, Martinez posted an astounding 149 OPS+ (my apologies for not using wRC+ in this column!), with a low of 139 and a high of 166. To that end, I researched players from the DH era (circa 1973) that posted an OPS+ between 140 and 160 in their Age 26 through Age 29 seasons. Presumably, these players would make for suitable Martinez comps as we attempt to project his offensive production over the next five to seven years. Of course, some of these players are still active and haven’t played enough to give me complete data, such as Ryan Braun, so they have been eliminated from the dataset. I was left with 38 comparable players, which is a large enough sample for our purposes today.

In this chart, I condensed the sample into averages because 40 rows and 9 columns doesn’t embed so cleanly. These are Martinez’s comps for their age-26 through age-29 seasons, their offensive production for the next five years (through age-34, which is Martinez’ floor value at this point) and then their production in the sixth and seventh following years (ages 35 and 36, which represent Martinez’ ceiling value at this point).

J.D. Martinez Age 26-29 Comps Through Age 30-34, 35, and 36
Age Average OPS+ Average PA/Season Sample Size
26-30 147 637 38
30-34 134 559 38
35 124 512 36
36 117 447 33

The average player from my sample posted a 147 OPS+ in their age-26 through 29 seasons, which matches up neatly with Martinez’ 149 mark. You’ll first notice the drop off in production for these players in their age-30 through 34 seasons. There are several reasons for this. Yes, natural decline was at work, but the original search for Martinez comps included a 2000 plate appearance minimum; this means I was guaranteed to be given players both as good and as healthy as Martinez in their Age 26-29 seasons without the same guarantee they would be healthy in the years that followed. This also means players like Mark McGwire (146 OPS+ in 1913 PA) were excluded from the sample because he was injured, despite the 189 OPS+ he would put up in 3462 plate appearances through Age 36.

Nevertheless, it’s a reasonable regression one can expect for players entering their 30s, and the good news is that they were, on average, very productive (134 OPS+) and very healthy (559 PA). This is what the Red Sox believe to be worth 5/$100M, but I would argue that this data shows they should be willing to tack on a sixth year without blinking. Of the original 38 player sample, 36 players played their age-35 seasons; they were still very productive (Khris Davis has been producing along these lines the past two years) and healthy enough to play a full season.

The real question surrounding Martinez is – or at least should be, if the market weren’t so cold – whether he should be given a seventh year or not. From his comps, the sample size drops significantly for the first time down to 33, the average playing time falls below the league qualifying minimum for the first time, and the production drops below what you’d want from your DH (the reference point here would be Miguel Sano from the last couple of seasons).

At face value, I would absolutely give Martinez the sixth year, and absolutely not give him the seventh. At the same time, we should dive into our sample a little deeper and discover why some players did well and why others tanked in their 30s; perhaps there is something we can correlate with Martinez so we can get an even better projection. From the original sample, here are the twenty best performers in their age-36 seasons (based on a combination of plate appearances and OPS+).

Twenty Age-36 Producers
Rank Player OPS+ PA Rank Player OPS+ PA
1 Rafael Palmeiro 141 714 11 George Brett 123 528
2 Mike Schmidt 153 657 12 Robin Yount 102 629
3 Dave Winfield 159 631 13 Wade Boggs 142 434
4 Chipper Jones 176 534 14 George Foster 121 504
5 Carlos Delgado 128 686 15 Brian Giles 110 552
6 Jim Thome 150 536 16 Dave Parker 92 647
7 Bobby Abreu 118 667 17 Alex Rodriguez 111 529
8 Fred McGriff 110 664 18 Vladimir Guerrero 98 590
9 Eddie Murray 115 625 19 Ken Griffey 99 472
10 David Ortiz 173 383 20 Bernie Williams 85 546
Average 140 610   Average 107 543

The reason I picked the twenty best rather than the top and bottom ten is that the bottom ten would be littered with folks such as Cliff Floyd or Dale Murphy, who only came to the plate 17 and 63 times respectively during their age-36 seasons. Using the ten best players captures those who were magnificent offensive performers with full playing time. Using the next ten players captures those who were mediocre in full playing time. This looks good to me.

This would be the time for me to explain why I haven’t mentioned WAR in this piece: J.D. Martinez has been horrible on defense!

He was best suited as a DH years ago, but being on a roster with Victor Martinez and then being traded to the National League forced him to play right field, which depressed his value. If Boston signs him, he’ll see absolutely no time in an outfield that will be covered by Jackie Bradley, Mookie Betts, and Andrew Benintendi for the foreseeable future. As a DH for the rest of his career, Martinez will be solely judged by his offensive production and ability to stay on the field.

Again, our question is whether Martinez receiving a seventh year is justified. More specifically, this boils down to “In seven years, will Martinez be in the left column or the right column?” Both sides of the list contain incredible players, but there’s a way to make a reasonable projection. Here’s the same list, but instead of rank, you’ll see the positions these players spent significant time. Those who had significant time at 1B/DH are highlighted in gold.

Twenty Age-36 Producers (By Age)
Position Player OPS+ PA Position Player OPS+ PA
1B/DH Rafael Palmeiro 141 714 1B George Brett 123 528
3B/1B Mike Schmidt 153 657 CF Robin Yount 102 629
RF Dave Winfield 159 631 3B Wade Boggs 142 434
3B Chipper Jones 176 534 LF George Foster 121 504
1B Carlos Delgado 128 686 RF Brian Giles 110 552
DH Jim Thome 150 536 RF Dave Parker 92 647
RF/LF/DH Bobby Abreu 118 667 3B/DH Alex Rodriguez 111 529
1B Fred McGriff 110 664 DH Vladimir Guerrero 98 590
1B Eddie Murray 115 625 CF Ken Griffey 99 472
DH David Ortiz 173 383 CF/DH Bernie Williams 85 546
Average 140 610   Average 107 543

In this exercise, let’s consider 1B/DH to be significantly less stressful positions than the others. After all, there is a significant correlation between time spent in the field and sustaining an injury that leads to decline. While players like Brian Giles, Dave Parker, and Ken Griffey Jr. saw injuries and offensive decline catch up to them after years chasing down balls in the outfield, players like Rafael Palmeiro, Carlos Delgado, and Jim Thome aged extremely well by not exerting the same stress in the field.

Martinez is almost certain to spend no time in the field at Age 36. Hell, he might not spend much time in the field ever again. So I consider him a slam dunk to be placed in the group on the left. Referring to the averages from the first chart in this article, I’ll the over on Martinez when the time comes. To be clear, I donJD’t necessarily think he should be given the seventh year outright – an option would probably be most appropriate – but I think this data solidifies my comfort in giving him a sixth guaranteed year.

In a winter in which the market is changing in ways we have never seen before, it’s difficult to predict what  Martinez will earn. It’s important to remember that dollars are a construct; we can’t assume Martinez will get $150 million from the Red Sox because Adrian Gonzalez did after amassing similar numbers. Teams like the Red Sox are wary of contracts like the one given to Gonzalez, who will earn $21.5M from that deal this year. In this market (or lack thereof), it’s impossible for me to put dollars or years on Martinez, but I do know this: Martinez is a special hitter, and he’ll age especially well.

He will be a productive hitter for the next six or seven years, and there’s no dollar amount that can change that.
Baseball, Regression to the Mean, and Avoiding Potential Clinical Trial Biases

It’s baseball season. Which means it’s fantasy baseball season. Which means I have to keep reminding myself that, even though it’s already been a month and a half, that’s still a pretty short time in the long rhythm of the season and every performance has to be viewed with skepticism. Ryan Zimmerman sporting a 0.293 On Base Percentage (OBP)? He’s not likely to end up there. On the other hand, Jake Odorizzi with an Earned Run Average (ERA) less than 2.10? He’s good, but not that good. I try to avoid making trades in the first few months (although with several players on my team on the Disabled List, I may have to break my own rule) because I know that in small samples, big fluctuations in statistical performance in the end  are not really telling us much about actual player talent.

One of the big lessons I’ve learned from following baseball and the revolution in sports analytics is that one of the most powerful forces in player performance is regression to the mean. This is the tendency for most outliers, over the course of repeated measurements, to move toward the mean of both individual and population-wide performance levels. There’s nothing magical, just simple statistical truth.

And as I lift my head up from ESPN sports and look around, I’ve started to wonder if regression to the mean might be affecting another interest of mine, and not for the better. I wonder if a lack of understanding of regression to the mean might be a problem in our search for ways to reach better health.
Read the rest of this entry »


The Contours of the Steroid Era

One of the things I enjoy most about FanGraphs Community–really, I’m not just apple polishing here–is the quality of the comments. After I came up dry trying to explain the increase in hit batters to near-historical levels in recent years, a commenter led me to what I feel is the correct path: Batters are more likely to be hit when the pitcher’s ahead on the count (and thereby more likely to work the edges of the strike zone, where a miss inside may hit the batter), and the steady increase in strikeouts has yielded an increase in pitchers’ counts on which batters get hit. Similarly, on December 30, when I wrote about how larger pitching staffs have adversely affected the performance of designated hitters, I got this smart comment from Jon L., reacting to my contention that the relative (not absolute) rise in DH offensive performance (measured by OPS+) from 1994 to 2007 probably wasn’t related to PEDs because the improvement was relative to increasing offensive levels overall:

I think it was clearly a PED thing. Players were able to build strength and muscle mass to enhance hitting prowess, and were willing to take the hit on baserunning and agility that comes with toting more weight around. And why not? The money’s in hitting. PEDs were more appealing to players with some initial level of slugging ability, and disproportionately benefited DH-type skills.

That made me think about the Steroid Era (or the PED Era, or, as Joe Posnanski put it, the Selig Era). Generally, I avoid this issue. I listen to SiriusXM in my car, and when I’m on MLB Network Radio and the discussion turns to PEDs, I change the station. I’ve had enough of it for this life, and of course it’ll keep going into overdrive every year around this time with all the Hall of Fame posturing. And, of course, there are commentators like Joe Sheehan who attribute the change in offense since drug testing was instituted to changes in contact rate rather than, as he calls them, “sports drugs.” I’m not making a call on any of that here.

But Jon L.’s comment made me look at the era in a different light. As I noted in my piece, between 1994 and 2007, the average OPS+ for designated hitters was 109. Prior to that, it was 104, and since then, it’s been 106. Those 14 years between 1994 and 2007 represent the high-water mark for DH offense. both absolutely and relatively. In the 42 years in which the American League has had a designated hitter, there have been 28 seasons in which the OPS+ for DHs was 105 or higher: Every season from 1994 to 2007, but just half of the remaining 28 years.

So I’m going to start with the years 1994-2007 as my definition of the Steroid Era. I’m not saying they’re the right answer. They do fit in with the record for DHs, and I’d note that those fourteen years account for 23 of the 43 player-seasons, and 14 of the 23 players, hitting 50+ home runs in a season. (And that doesn’t include 1994, when six players–Matt Williams, Ken Griffey Jr., Jeff Bagwell, Frank Thomas, Barry Bonds, and Albert Belle–were on pace for 50+ when the strike ended the season.) But maybe the Steroid Era started, as Rob Neyer recently suggested, in 1987, following Jose Canseco’s Rookie of the Year season. That’s the same starting point the Eno Sarris points to in this article from 2013. Maybe it ended in 2003, the last year before drug testing commenced. I’ll get to that later.

To test Jon L.’s hypothesis, I looked at Bill James’s Defensive Spectrum, which puts defensive positions along a continuum:

DH – 1B – LF – RF – 3B – CF – 2B – SS – C

For purposes of this analysis, let’s just say that the defensive spectrum rates positions as offense-first through defense-first. (It’s more nuanced, having to do with the availability of talent, but that’s not important here.) DHs, obviously, are asked only to hit, not to field. On the other end of the spectrum, players like Clint Barmes and Jose Molina get paid for the glove, not their bat.

For each position, I looked at their relative hitting (measured by OPS+, the only relative metric I could find with positional splits going back to the implementation of the DH). Obviously, overall offense increased across baseball during the Steroid Era. That’s not at issue. Rather, I’m looking for the contours of the increase: Did some types of players benefit more than others? That’s the beauty of relative statistics. Since they average to 100 overall, they’re effectively a zero-sum game. In pretty much identical playing time, Justin Upton’s OPS+ improved from 124 in 2013 to 132 in 2014. That means that the rest of his league, in aggregate, lost 8 points of OPS+ over Upton’s 642 or so plate appearances from 2013 to 2014. Taking that logic to positions, if one position goes up, as the DHs did from 1994 to 2007, another position has to go down.

I compared three ranges of seasons:

  • The Steroid Era; fourteen years from 1994 to 2007
  • The fourteen prior seasons, 1980-1993
  • The seven seasons since

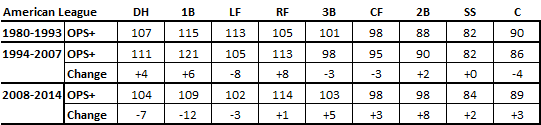
If, as Jon L. suggests, the Steroid Era disproportionately helped sluggers, we’d expect to see OPS+ rise for the left end of the spectrum and fall for the right end. If, as I contended, the increase in DH productivity was more due to the influx of very skilled hitters in the DH role (Edgar Martinez, David Ortiz, Travis Hafner, and others) than something systematic, the change in OPS+ among positions would be pretty random. Here are the American League results (source for all tables: baseball-reference.com):

It turns out that other than a somewhat idiosyncratic drop in production among left fielders (Rickey Henderson’s best years were before 1994, while left fielders Jim Rice, George Bell, and Brian Downing were all high-OPS stars of the 1980s), Jon L.’s hypothesis looks correct. Collectively, DHs, first basemen, and corner outfielders added ten points of OPS+ during the Steroid Era (two-three per position) while center fielders and infielders lost eight points (two per position – totals don’t sum to zero due to rounding). After 2007, the hitters’ positions lost 21 points of OPS+ (five per position) while the fielders’ positions picked up 21 (four per position).

Again, these are relative changes. American League center fielders batted .267/.330/.401 from 1980 to 1993, an OPS of .731. They hit .273/.339/.423 from 1994 to 2007, an OPS of .762. Their absolute numbers improved. But relative to the league, they declined. Offensive performance shifted away from glove positions to bat positions in the American League during the Steroid Era, and back toward the glove guys thereafter.

What’s an increase of two or three points of OPS+, as occurred for DHs from 1994-2007, worth? In the current environment, it’s about 14-20 points of OPS. That’s about the difference in 2014 between Indians teammates Yan Gomes (122 OPS+) and Lonnie Chisenhall (120 OPS+), or Royals teammates Eric Hosmer (98) and Billy Butler (95), or Twins teammates Trevor Plouffe (110) and Joe Mauer (107). (Man, it must be tough to be a Twins fan.)

So what does this mean? Maybe PEDs worked better for sluggers than for fielders, i.e., maybe they boosted sluggers’ batting skills more than other players’. Maybe sluggers took more drugs. I don’t know, and I really don’t care–as I said, I’m tired of the PED talk. But to swing back to Jon L.’s comments on my piece, I think I was too glib in attributing the increased relative performance by DHs from 1994 to 2007 to players and strategy alone. Looks like chemicals may have played a role.

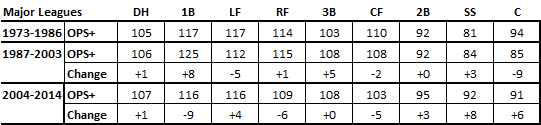
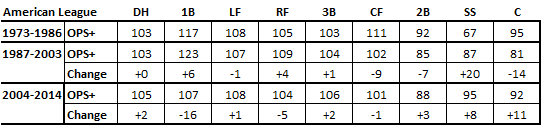
But wait, I’m not done. I mentioned the lack of definition of the Steroid Era. If I use the Neyer/Sarris starting point of 1987 and the last pre-testing season of 2003 as an endpoint, things change a bit. Stretching out the definitions of the eras to 1973-1986 as pre-steroids and 2004-present as post-steroids, here’s what I get:

That’s not as dramatic. Yes, there’s still a shift in OPS+ from the five positions on the right of the defensive spectrum to the four on the left during the Steroid Era, and back again thereafter. But it’s smaller and much less uniform. DHs and left fielders have actually done a bit better since the end of the differently-defined Steroid Era. That’s less compelling.

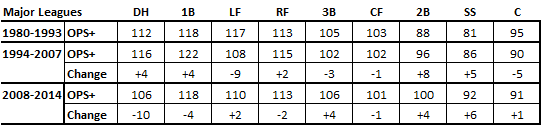
And the Steroid Era didn’t affect just the American League, of course. Of the 24 player-seasons between 1990 and 2007 in which a player hit 50+ home runs, half the players were in the National League (12 and a third, given that Mark McGwire split time in 1997 between Oakland and St. Louis en route to 58 homers), including all seven seasons of 58+ (seven and a third including McGwire’s 1997). And if you throw the NL into the mix the relationship breaks down more, regardless of how you define the Steroid Era, looking more random than systematic:

The shift of offense to bat-first positions during the Steroid Era is much less pronounced when looking at the two leagues combined, If there were an incontrovertible trend, we’d see plus signs for DHs, first basemen, and corner outfielders in the Steroid Era and minus signs thereafter, and the opposite for infielders and center fielders. That’s not the case.

So while the data aren’t altogether compelling, I’ll concede Jon L.’s point: The Steroid (or PED, or Selig) Era didn’t just boost offenses overall, it changed the contour of offensive performance, shifting some production away from the glove-first positions to the bat-first positions. There was an uptick not only in offensive performance as a whole, but particularly in offensive performance generated designated hitters, first basemen, and corner outfielders. However, the magnitude of the effect is dependent on the league and the years chosen, which indicates that it’s not strong. So I’m sticking with my view that there was an unusual concentration of talent playing DH from the mid-1990s to the mid-2000s. Designated hitters generated more offense, both absolutely and relatively, from 1994 to 2007 than in any other period. The underlying reason may be partly the Steroid Era, but we can say that those years were also the Edgar Martinez era.