The Contours of the Steroid Era
One of the things I enjoy most about FanGraphs Community–really, I’m not just apple polishing here–is the quality of the comments. After I came up dry trying to explain the increase in hit batters to near-historical levels in recent years, a commenter led me to what I feel is the correct path: Batters are more likely to be hit when the pitcher’s ahead on the count (and thereby more likely to work the edges of the strike zone, where a miss inside may hit the batter), and the steady increase in strikeouts has yielded an increase in pitchers’ counts on which batters get hit. Similarly, on December 30, when I wrote about how larger pitching staffs have adversely affected the performance of designated hitters, I got this smart comment from Jon L., reacting to my contention that the relative (not absolute) rise in DH offensive performance (measured by OPS+) from 1994 to 2007 probably wasn’t related to PEDs because the improvement was relative to increasing offensive levels overall:
I think it was clearly a PED thing. Players were able to build strength and muscle mass to enhance hitting prowess, and were willing to take the hit on baserunning and agility that comes with toting more weight around. And why not? The money’s in hitting. PEDs were more appealing to players with some initial level of slugging ability, and disproportionately benefited DH-type skills.
That made me think about the Steroid Era (or the PED Era, or, as Joe Posnanski put it, the Selig Era). Generally, I avoid this issue. I listen to SiriusXM in my car, and when I’m on MLB Network Radio and the discussion turns to PEDs, I change the station. I’ve had enough of it for this life, and of course it’ll keep going into overdrive every year around this time with all the Hall of Fame posturing. And, of course, there are commentators like Joe Sheehan who attribute the change in offense since drug testing was instituted to changes in contact rate rather than, as he calls them, “sports drugs.” I’m not making a call on any of that here.
But Jon L.’s comment made me look at the era in a different light. As I noted in my piece, between 1994 and 2007, the average OPS+ for designated hitters was 109. Prior to that, it was 104, and since then, it’s been 106. Those 14 years between 1994 and 2007 represent the high-water mark for DH offense. both absolutely and relatively. In the 42 years in which the American League has had a designated hitter, there have been 28 seasons in which the OPS+ for DHs was 105 or higher: Every season from 1994 to 2007, but just half of the remaining 28 years.
So I’m going to start with the years 1994-2007 as my definition of the Steroid Era. I’m not saying they’re the right answer. They do fit in with the record for DHs, and I’d note that those fourteen years account for 23 of the 43 player-seasons, and 14 of the 23 players, hitting 50+ home runs in a season. (And that doesn’t include 1994, when six players–Matt Williams, Ken Griffey Jr., Jeff Bagwell, Frank Thomas, Barry Bonds, and Albert Belle–were on pace for 50+ when the strike ended the season.) But maybe the Steroid Era started, as Rob Neyer recently suggested, in 1987, following Jose Canseco’s Rookie of the Year season. That’s the same starting point the Eno Sarris points to in this article from 2013. Maybe it ended in 2003, the last year before drug testing commenced. I’ll get to that later.
To test Jon L.’s hypothesis, I looked at Bill James’s Defensive Spectrum, which puts defensive positions along a continuum:
DH – 1B – LF – RF – 3B – CF – 2B – SS – C
For purposes of this analysis, let’s just say that the defensive spectrum rates positions as offense-first through defense-first. (It’s more nuanced, having to do with the availability of talent, but that’s not important here.) DHs, obviously, are asked only to hit, not to field. On the other end of the spectrum, players like Clint Barmes and Jose Molina get paid for the glove, not their bat.
For each position, I looked at their relative hitting (measured by OPS+, the only relative metric I could find with positional splits going back to the implementation of the DH). Obviously, overall offense increased across baseball during the Steroid Era. That’s not at issue. Rather, I’m looking for the contours of the increase: Did some types of players benefit more than others? That’s the beauty of relative statistics. Since they average to 100 overall, they’re effectively a zero-sum game. In pretty much identical playing time, Justin Upton’s OPS+ improved from 124 in 2013 to 132 in 2014. That means that the rest of his league, in aggregate, lost 8 points of OPS+ over Upton’s 642 or so plate appearances from 2013 to 2014. Taking that logic to positions, if one position goes up, as the DHs did from 1994 to 2007, another position has to go down.
I compared three ranges of seasons:
- The Steroid Era; fourteen years from 1994 to 2007
- The fourteen prior seasons, 1980-1993
- The seven seasons since
If, as Jon L. suggests, the Steroid Era disproportionately helped sluggers, we’d expect to see OPS+ rise for the left end of the spectrum and fall for the right end. If, as I contended, the increase in DH productivity was more due to the influx of very skilled hitters in the DH role (Edgar Martinez, David Ortiz, Travis Hafner, and others) than something systematic, the change in OPS+ among positions would be pretty random. Here are the American League results (source for all tables: baseball-reference.com):
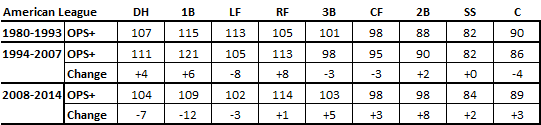
It turns out that other than a somewhat idiosyncratic drop in production among left fielders (Rickey Henderson’s best years were before 1994, while left fielders Jim Rice, George Bell, and Brian Downing were all high-OPS stars of the 1980s), Jon L.’s hypothesis looks correct. Collectively, DHs, first basemen, and corner outfielders added ten points of OPS+ during the Steroid Era (two-three per position) while center fielders and infielders lost eight points (two per position – totals don’t sum to zero due to rounding). After 2007, the hitters’ positions lost 21 points of OPS+ (five per position) while the fielders’ positions picked up 21 (four per position).
Again, these are relative changes. American League center fielders batted .267/.330/.401 from 1980 to 1993, an OPS of .731. They hit .273/.339/.423 from 1994 to 2007, an OPS of .762. Their absolute numbers improved. But relative to the league, they declined. Offensive performance shifted away from glove positions to bat positions in the American League during the Steroid Era, and back toward the glove guys thereafter.
What’s an increase of two or three points of OPS+, as occurred for DHs from 1994-2007, worth? In the current environment, it’s about 14-20 points of OPS. That’s about the difference in 2014 between Indians teammates Yan Gomes (122 OPS+) and Lonnie Chisenhall (120 OPS+), or Royals teammates Eric Hosmer (98) and Billy Butler (95), or Twins teammates Trevor Plouffe (110) and Joe Mauer (107). (Man, it must be tough to be a Twins fan.)
So what does this mean? Maybe PEDs worked better for sluggers than for fielders, i.e., maybe they boosted sluggers’ batting skills more than other players’. Maybe sluggers took more drugs. I don’t know, and I really don’t care–as I said, I’m tired of the PED talk. But to swing back to Jon L.’s comments on my piece, I think I was too glib in attributing the increased relative performance by DHs from 1994 to 2007 to players and strategy alone. Looks like chemicals may have played a role.
But wait, I’m not done. I mentioned the lack of definition of the Steroid Era. If I use the Neyer/Sarris starting point of 1987 and the last pre-testing season of 2003 as an endpoint, things change a bit. Stretching out the definitions of the eras to 1973-1986 as pre-steroids and 2004-present as post-steroids, here’s what I get:
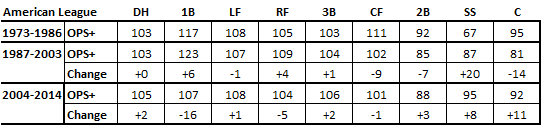
That’s not as dramatic. Yes, there’s still a shift in OPS+ from the five positions on the right of the defensive spectrum to the four on the left during the Steroid Era, and back again thereafter. But it’s smaller and much less uniform. DHs and left fielders have actually done a bit better since the end of the differently-defined Steroid Era. That’s less compelling.
And the Steroid Era didn’t affect just the American League, of course. Of the 24 player-seasons between 1990 and 2007 in which a player hit 50+ home runs, half the players were in the National League (12 and a third, given that Mark McGwire split time in 1997 between Oakland and St. Louis en route to 58 homers), including all seven seasons of 58+ (seven and a third including McGwire’s 1997). And if you throw the NL into the mix the relationship breaks down more, regardless of how you define the Steroid Era, looking more random than systematic:
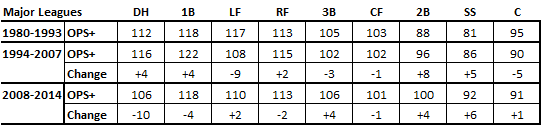
The shift of offense to bat-first positions during the Steroid Era is much less pronounced when looking at the two leagues combined, If there were an incontrovertible trend, we’d see plus signs for DHs, first basemen, and corner outfielders in the Steroid Era and minus signs thereafter, and the opposite for infielders and center fielders. That’s not the case.
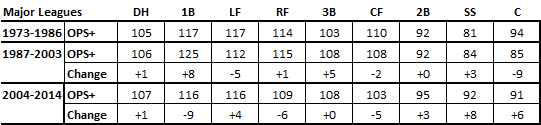
So while the data aren’t altogether compelling, I’ll concede Jon L.’s point: The Steroid (or PED, or Selig) Era didn’t just boost offenses overall, it changed the contour of offensive performance, shifting some production away from the glove-first positions to the bat-first positions. There was an uptick not only in offensive performance as a whole, but particularly in offensive performance generated designated hitters, first basemen, and corner outfielders. However, the magnitude of the effect is dependent on the league and the years chosen, which indicates that it’s not strong. So I’m sticking with my view that there was an unusual concentration of talent playing DH from the mid-1990s to the mid-2000s. Designated hitters generated more offense, both absolutely and relatively, from 1994 to 2007 than in any other period. The underlying reason may be partly the Steroid Era, but we can say that those years were also the Edgar Martinez era.
Writer for Baseball Prospectus
Good work!
Just a comment: FanGraphs does actually have data for wRC+ by position by year (go to leaderboards, select League Stats, and then pick a position and a year), so it would be possible to replace OPS+ with that better metric. And I know that sounds like it might not really be important on such a large scale, but the thing is, OPS+ isn’t just worse, it’s worse in a specific way: it overvalues slugging relative to OBP, and I feel like DHs and first basemen and, well, players on the “easy” side of the defensive spectrum tend to have their most marked offensive advantage in power, so OPS+ might overvalue them. Could be worth a check, I think.
Thanks, Blueyays.
I agree, wRC+ is a better metric. I tried using that. The problem with the FanGraphs wRC+ splits is that prior to 2002, they’re not really splits. In 2014, for example, if I click on DH in the Split pulldown, I get that the top three DH plate appearances are Ortiz with 574, VMart with 494, and Carter with 485. That’s the precise number of plate appearances each player had as a DH. Again, that’s using the Split pulldown, for which there are positional splits available only from 2002 to the present. If I instead click on the DH box in the line above the solid green line, I get the top three are Pujols with 698, Nelson Cruz with 678, and VMart with 641. The former splits–available only since 2002–are true splits, i.e., isolate player performance only at the position. The latter splits–available much farther back–list full-season performance for all players who saw significant time (I don’t know what the cutoff is) at the position. But that’s now what I want to see. Only 180 of Pujols’ 2014 plate appearances were at DH; only 385 of Cruz’s plate appearances were at DH. That’s not capturing what I’m looking for here. That’s why I felt I didn’t have any choice but to use OPS+, for which Bref has true splits.
Good (and correct) point about OBP, though – I’ll look into that and post my findings here.
If OPS+ works correctly in the splits, I’m thinking OBP and SLG probably do too. If that’s the case you could just recalculate OPS+ with the proper weightings (I think OBP is like 1.8 times as valuable as SLG). Still not quite as thorough as wRC+, but it would at least lessen that inherent bias in OPS+.
Um, Captain (I’m old enough to get the reference), recalculate OPS+? I was an applied math major, but recalculating OPS+ is way above my pay grade. I was just going to look at the aggregate change on OBP by position, on the theory that league levels of offense affect everyone the same and park factors more or less come out in the wash when doing aggregate calculations. I’ll get around to the is the next couple days and post results here.
*this, not the is. Stupid autocorrect/fat thumbs.
OPS+ is really easy to recalculate with the proper OBP weighting in there. The formula is:
(1.2*OBP/lgOBP+0.8*SLG/lgSLG-1)*100
Will get you like 99% towards a non-park adjusted wRC+
To park adjust simply divide that OPS+ by the park factor/100 (95 = 0.95). If Player X is non-park adjusted a 130 OPS+ hitter and his park has a park factor of 105 then simply do 130/1.05 = 124
That will get you very, very close to wRC+.
I mean, I suppose the simple logical extension here would be to just use the linear weights that FanGraphs provides for every season and calculate everyone’s wOBA while playing that position for the years before 2002. That would entirely solve the problem, and would get rid of the issue of powerful players being overvalued. That’s a HUGE amount of really tedious work, though, so I get why Rob doesn’t really feel like jumping right at it. That’s a good point about the splits before 2002, Rob, I hadn’t realized that.
The magnitude of the rise and subsequent drop-off in offense in the aggregate is astonishing, as is the frequency of 900 and 1000 OPS players which is a historical anomaly as you can see in the graphs (in the link) below. The fact that less defensively challenging positions lend themselves to players who can bulk up goes without saying — what’s interesting are the challenges in finding ways of measuring the intrinsic value of pitching at the margins of the steroid era …
http://metsmerizedonline.com/2014/11/pitching-or-hitting-assigning-post-steroid-era-value.html/
Wow, Matt, you’re right–those graphs are really dramatic. Nice piece.
As to the value of pitching back then, I will never tire of looking at Pedro Martinez’s record from 1999 to 2003, when his WORST FIP- was 51.
One of the great fallacies of the PED debate was that only sluggers benefited from PED’s. Completely untrue. Look at the spike in BABIP which occurred at the same time as the spike in power. LD and GB hitters got more base hits being stronger because the balls speed off the bat increased. There were also benefits to taking PED’s in terms of durability, for players who used PED’s not for muscle building but for recovery. A Derek Jeter, Tony Gwynn and Cal Ripken Jr had just as much reason to use PEDs as Sammy Sosa and Barry Bonds did, not to say that any of the former did PED’s
Of course, BABIP levels have not tapered off like power has, which leads me to believe the power surge from 1994 was as much to do with the juiced ball as anything, and the power drop is related to the increased strike zone and higher k rates more than testing.
There were other factors at play for the power surge. Expansion, increased weight training, maple bats, smaller parks (one at high altitude), heck, maybe even global warming (LOL). Many of them remain factors today, but that strike zone just keeps getting bigger and bigger
Good points all. Yes, batting performance rose for everybody. And to the degree that the Mitchell Report is credible, the people taking PEDs weren’t just sluggers. Joe Sheehan has traced the decline of offense since testing began as a consequence of lower contact rates, and the growing strike zone certainly has contributed.
Steroids are amazing compounds, both in sports and the medical field.
People often just focus on the end result and not why they work.
Steroids in muscle building and performance work essentially by speeding up the recovery process. The act of building muscle is continual breakdown and repair of muscle fibers. Rebuilding the fibers stronger and thicker to handle more stress.
I’m 41 now and throughout my 30s I had a lot of buddies use steroids. Not because they were looking for shortcuts, but because they were already muscular gym rats whose bodies no more bounced back from grueling workouts like they did in their 20s. During their on cycles they could workout very hard day after day. The problem for them is that while steroids help muscle repair, the tendons take longer to repair, so many of them ended up with tendon and joint problems.
Like Canseco said, on steroids you can maintain your peak all season long. I look at guys like pudge Rodriguez and wonder how he could possibly catch all those games in Texas’s grueling climate without steroids.
Anyway, I think any position, including pitchers would benefit from the recovery up to the point where their joints can’t take it. Their muscle strength and recovery outpaces the recovery of other structures.
At this time of the year, in the NFL, I’m amazed that any player can get through the season without peds or hgh.
As a couple of comments have noted, a major effect of steroids is to hasten recovery and extend peak years. It seems to me that this effect – which BTW is legitimate in itself, i.e., would be permitted for medical reasons if not for other advantages – is particularly helpful for aging players and power hitters, the ones who tend to be shifted down the defensive spectrum.
That’s a great point, Mr Punch. A player who would’ve flamed out at 36 who instead lasts until 39 is probably doing so as a DH, 1B, or corner outfielder. And I may be wrong about this, but I have the impression that HGH has more value for recovery/healing than for building muscle mass.
OK, everybody, I re-ran the numbers.
CHANGE IN OBP (points), AL ONLY
From 1980-1993 to 1994-2007
DH +20, 1B +15, LF +7, RF +20, 3B +4, CF +9, 2B +8, SS +17, C +9
Average for left four: +16 Average for right five: +9
From 1994-2007 to 2008-2014
DH -22, 1B -24, LF -17, RF -12, 3B -12, CF -13, 2B -10, SS -13, C -7
Average for left four: -19 Average for right five: -11
CHANGE IN OPS+ (using AC_Butcha_AC’s methodology, not park adjusted), AL ONLY
From 1980-1993 to 1994-2007
DH +4, 1B +2, LF -4, RF +3, 3B -3, CF -3, 2B +0, SS +7, C -2
Average for left four: +1.5 Average for right five: -0.2
From 1994-2007 to 2008-2014
DH -3, 1B -5, LF -1, RF +0, 3B +2, CF +2, 2B +5, SS -2, C +4
Average for left four: -2.5 Average for right five: +2.1
I’d say that’s consistent with the original findings.
But that’s using my definition of the PED era, and AL only. Looking at both leagues and the broader definition of the era:
CHANGE IN OBP (points), BOTH LEAGUES
From 1973-1986 to 1987-2003
DH +16, 1B +15, LF +5, RF +7, 3B +2, CF +5, 2B +12, SS +15, C +0
Average for left four: +11 Average for right five: +7
From 1987-2003 to 2004-2014
DH -10, 1B -9, LF -8, RF -5, 3B -2, CF -6, 2B -7, SS +0 C +0
Average for left four: -8 Average for right five: -3
CHANGE IN OPS+ (using AC_Butcha_AC’s methodology, not park adjusted), BOTH LEAGUES
From 1973-1986 to 1987-2003
DH +3, 1B +5, LF -2, RF +0, 3B -3, CF -3, 2B +3, SS +6, C -4
Average for left four: +1.4 Average for right five: -0.1
From 1987-2003 to 2004-2014
DH -3, 1B -3, LF -2, RF -2, 3B +2, CF +0, 2B +2, SS +4, C +2
Average for left four: -2.5 Average for right five: +2.0
I think that’s pretty conclusive. To the degree that the PED Era shifted offense from glove-first positions to bat-first positions, the shift affected OBP and adjusted OPS+ as well as unadjusted OPS+. Sluggers benefited the most.
Good work again, and good on you for running all those numbers. It does indeed look like your original effect still exists, at least to some degree.
Dave was talking on the podcast yesterday about how he thinks the positional adjustments might need to be adjusted, and I think what you’ve done here could be a really interesting addition to that conversation.
Thanks, Blueyays. Yeah, when I heard Dave say that, I was thinking that with all the stupid things people say about WAR–“there’s no such thing as a replacement player,” “one number can’t possibly encapsulate everything a player does”–Dave reminded us that there are aspects to the calculation that are somewhat arbitrary. I think one of the differences between people here and people who live by wins and RBI is that I like to think we are more open to an examination of our methodology’s weaknesses/vulnerabilities.