Archive for MLB

Cody Bellinger’s Ability to Be Great

Cody Bellinger was called up by the Dodgers to the big leagues on April 25th of this year. Coming in at only 21 years of age, Bellinger was looking to make a name for himself. Toward the beginning of the season he would split starts between left field and first base. Eventually Adrian Gonzalez would go down to injury, giving Bellinger the opportunity of being an everyday first baseman. Bellinger rose to the occasion, cementing himself in the history books, as he will be the National League Rookie of the Year. Not only will he achieve this award, but he helped bring his team to the World Series. Before Bellinger’s arrival to the team, the Dodgers were 9 for their first 20 games. The Dodgers would go on to win 104 of their 162 games.

During the course of the season, Bellinger put up incredible numbers. He played in 132 games throughout the year, driving in 97 runs, scoring 87 times, and belting an astonishing 39 home runs, finishing only behind the powerful Giancarlo Stanton (with 59). Bellinger had a respectable .267 batting average while maintaining a .352 on-base percentage and .581 slugging percentage. He was a force at the plate, putting fear into the eyes of many pitchers. Although he didn’t walk so much — only 11.7% of the time — he still managed to have a wOBA of .380, staying in the top 30 for the MLB. On average, he would draw a walk for about every two strikeouts; not the best, but still better than most players belting over 30 homers. His plate discipline was above average for power hitters throughout the season, but come postseason, this would all change.

Throughout much of the postseason, most people were reflecting on Aaron Judge’s struggles, after having himself a historic season at the plate. Judge would break the record for strikeouts in a postseason until Bellinger would then beat this unfavorable record with 29. Through Bellinger’s 15 postseason games, he would belt three home runs, driving in nine runs and scoring 10 times while walking only three times. Most of these statistics happened during the NLDS and NLCS. His wOBA would fall to .295, with a .219 batting average, walking 4.5% of the time, while striking out in an astounding 43.3% of his plate appearances. In fact, in the World Series alone, he would achieve 17 of his 29 strikeouts. Bellinger would struggle immensely at the plate throughout the World Series, with the exceptions of Games 4 and 5.

During the series, the Astros pitching staff would focus on beating Bellinger in on the hands with curveballs falling out of the zone, and with fastballs tailing up and away. Amazingly, Bellinger during the regular season only chased pitches out of the zone 29.7% of the time. This would change immensely as the Astros pitching staff’s effective deception would often pull Bellinger’s bat out of the zone.

In Game 4, Bellinger would face Astros pitcher Charlie Morton in the top of the 5th with no outs in a 1-2 count. Bellinger’s stance is in a more upright position with his bat also in a vertical position. This makes creating torque through his hands a little more awkward, as he rolls his hands into a hitting position. When this curveball begins to spin further in on his hands, it becomes too difficult to bring his hands in further, leading to this awful swing and follow-through shown. His approach on this pitch looks as if he’s trying to hit the ball 500 feet over the right-field wall; not an optimal mindset in a 1-2 count when you know the curveball is coming. His head was nowhere near the zone; he may as well have swung with his eyes closed. This is the position we often saw Bellinger in throughout the World Series when thrown an inside curveball. However, Bellinger would use this at-bat for his next plate appearance.

Now we see later in the game Bellinger is in a 1-1 count facing Morton in the top of the 7th. He knows he’s going to see a curveball in on his hands and adjusts accordingly. His body is in a lower position with his bat in a more angled approach, with his hands staying back, anticipating curveball, looking to stay in on the ball with his hands and drive it to right field. Bellinger manages to fight this pitch off, fouling it back, showing his adjustment helped. His follow-through is also in a significantly better position, with his head staying back looking at the ball, and his body stays in a more balanced stance. This approach, showing that he’s able to make even a small adjustment to making contact with the low and in curveball, led pitchers to start targeting the outside upper half of the zone with the fastball again.

Here we see in Game 4, Bellinger faces Astros pitcher Charlie Morton with a 1-1 count and 0 outs in the top of the 5th. Bellinger’s body is not in an effective hitting position for hitting this outside fastball. His body is falling out away from the zone, his pivot foot is not providing any power, and his hands reach out from his body too far. Bellinger would acknowledge this issue and had this to say before Game 4:

“I hit every ball in BP today to the left side of the infield,” Bellinger said. “I’ve never done that before in my life. Usually I try to lift. I needed to make an adjustment and saw some results today. I’m pulling off everything. Usually in BP I just try to lift, have fun in BP. But today I tried to make an adjustment. I needed to make an adjustment, and so I decided I’m hitting every ball to left field today.”

This is exactly what Bellinger would do.

In the top of the 9th in Game 4 with a 1-0 count and no outs, Bellinger faces Astros closer Ken Giles with runners on. Bellinger has his eyes locked in on the ball as he’s seen this pitch before. He’s using his approach from batting practice earlier to drill this ball into the gap. He keeps his body in an athletic hitting position, keeping his hands in and generating all his power through his lower half, creating torque through his strong hands. We see him drive this ball into the left-center gap, keeping his eyes on the ball the whole way and maintaining a strong follow-through. Bellinger did exactly what he said he would do and helped his team win this game. He would then carry on this adjustment into Game 5, showing people why he will be this year’s NL RoY.

Although Bellinger would fall into his old habits in Games 6 and 7, his ability to recognize where the problem is and the ability he has to adjust is what makes him an effective hitter. Through this, Bellinger will only continue to become better and will continue to become one of the most feared hitters in the league this next season. At only 22 years old now, Bellinger will become the next big star in this great sport we call Baseball.


Rafael Devers: Boston’s Rising Star

The Red Sox’s third-base problem was not solved by a veteran rental. No, it was solved by a sweet-hitting 20-year-old Dominican named Rafael Devers.

But before I explain Devers’ spectacular rise, I must set the stage for his entrance.

~~July 24th~~

It’s July 24th and the Red Sox have ground to a halt. Baseball’s non-waiver trade deadline is just eight days away and nearly the entire baseball community expects the Sox to trade for Todd Frazier.

Frazier, the third baseman for the White Sox, is in the midst of the worst season of his career. He’s hitting just .210 and his contract expires at the end of the year.

The Red Sox haven’t been able to gain traction since the All-Star break, going just 5-6. The Yankees, their ever-present rivals, are creeping up on them in the standings and have swooped in on a trade for Todd Frazier, even though many executives and analysts were sure the slugger would join the Red Sox.

Third base has been a huge issue for Boston, who has used eight (!) different players there. Collectively, Red Sox third basemen are slashing .227/.280/.320, marks that rank 27th, 29th, and 30th in the league, respectively. They have not only been terrible hitters, but they also lead the league in errors.

Dave Dombrowski decides to rectify the Red Sox’ third base issue by promoting top prospect Rafael Devers to the big leagues.

~~A Rafael Devers Profile~~

Rafael Devers was born on October 24th, 1996 in Sanchez, an aging port city in the Dominican Republic. He first started playing baseball at the age of five, inspired by his father, who played amateur ball. Devers grew up with baseball all around him and quickly showed immense talent.

In 2013, Devers signed with the Red Sox at just 17 years old. He was ranked as the number three international prospect in his class, and he signed with the Red Sox, his childhood favorite team, for $1.5 million. Devers entered the Red Sox organization as their 20th ranked prospect in a deep farm system.

Upon joining the Red Sox, Devers was placed in the Dominican Summer League (DSL), a place where new international signings go to work on their skills. Devers took the DSL by storm, batting .337/.445/.538 with three home runs in 28 games. He impressed everyone, by his ability to hit for both average and power, and also by his great batting eye — Devers walked more times than he struck out.

After tearing up the Dominican League, Devers was sent to the States, where he played in the Gulf Coast League. The Gulf Coast League, or GCL, is where first-year minor-league players are sent after being drafted or signed by their teams. Most of the players in the GCL have been drafted out of college or have just finished high school, meaning that at age 17, Devers was one of the youngest players in the league. Devers carved up the GCL, batting .312 with 11 doubles and four homers in 42 games.

After Devers’ wildly successful first year, he was rated as the Red Sox’ sixth-best prospect, and baseball’s 99th-best, all at just 18 years old. This was an incredible accomplishment, as Devers was the youngest player on Baseball America’s top-100 list that year.

In 2015, Devers was promoted to the Red Sox’ Low-A affiliate, the Greenville Drive, where he experienced full-season ball for the first time. There, he was matched up against much older opponents, being one of just seven position players under the age of 19 in the South Atlantic League. Devers played well in Greenville too, batting .288 with 38 doubles and 11 home runs in 115 games. During the 2015 season, Devers was selected to the Futures Game, an event during All-Star weekend that showcases baseball’s best young talent. After a season in Low-A, Devers was ranked as Boston’s second-best prospect, and baseball’s 18th-best. Devers jumped 81 spots on Baseball America’s top-100 in just one year, a remarkable achievement.

In 2016, Devers was promoted to the Red Sox’ High-A affiliate, the Salem Red Sox, at the age of 19. However, Devers hit a bump in the road in Salem. Among players much older than him, it appeared that Devers had finally met his match. In the first half of the season, he scuffled to a .233/.300/.305 line with just four home runs in 63 games.

However, Devers bounced back brilliantly after the All-Star break. He slashed an incredible .326/.367/.539, with seven home runs and 11 steals in 64 games. After this second-half breakout, Devers has not looked back in his meteoric rise to the majors.

In 2016, Devers’ defense finally started to catch up with his offense. Early on in his career, scouts considered moving him to first base, because of his heavy build. But Devers has worked hard on his defense, and has stayed at the hot corner. In High-A, Devers led all Carolina league third basemen in fielding percentage (.960), putouts (104), and assists (258).

After his outstanding second half in High-A, Devers earned a non-roster invitation to 2017 spring training with the Red Sox. This was a big step up for the 20-year-old Devers, but he wasn’t ready for it, batting 3 for 22 against big-league competition. Nevertheless, he earned a promotion to Double-A Portland, where he played for most of this year.

Devers was the Portland Red Sox’ standout player this year, socking 18 homers in addition to achieving an excellent .296/.366/.571 slash line. In 77 games, Devers jumped to number six in Baseball America’s most recent prospect rankings. He was also selected to participate in the MLB Futures Game for the second time.

Devers was promoted to Triple-A on July 14th, and continued to hit for both average and power while in Pawtucket. Devers became the third-youngest player ever to be promoted by the Red Sox to Triple-A, yet another reminder that he was playing extremely well for his age. The Dominican lefty hit an astounding .400 for the Pawtucket Red Sox, and he earned a promotion to the big leagues after just nine games in Triple-A.

When Devers debuted on July 25th, he was the youngest player in the major leagues, but you’d never know it. His first major-league hit was a home run (!), and during his 16 career major-league games, Devers has surprised everyone.

Scouting report

Devers has a very promising future, thanks to his ability to hit for both average and power. He has incredible raw power, and can spray the ball to all fields. His opposite-field power is unsurpassed among players his age. For example, when Devers hit two homers against the Indians on August 14th; one was a laser into the Green Monster seats in left field, and the other was a high drive into the Red Sox bullpen in right field.

Devers also has great bat speed, and he is able to hit pitches very far, and to any part of the field. On August 13th, Devers hit a 102.8 mph pitch into the Yankees bullpen, the fastest pitch ever hit for a home run in the pitch-tracking era.

Devers is not as polished as other recent Red Sox prospects like Andrew Benintendi, but he has a higher ceiling. I project that in his prime years he will hit around .285 with 30 home runs, 40 doubles, and five to ten stolen bases.

He has improved his defensive skills, but don’t expect him to be a Gold Glove-winning third baseman. I believe he will stay at the hot corner, as he is becoming more reliable and is improving his range. Overall, Devers projects to be an All-Star with a dependable glove and a reliable, middle-of-the-order bat.

Conclusion

As of August 15th, Devers is hitting .339 with six home runs, incredible statistics that show his ability is way beyond his years. I don’t mean to read too closely into Devers’ 62 career at-bats, but he has a very promising future.

Pairing Devers with other young Red Sox stars like Mookie Betts, Jackie Bradley jr. and Xander Bogaerts should help Boston stay at the top of the AL East for years. Devers gives Boston an entirely homegrown lineup, the dream of every major-league team.


Special thanks to Baseball Reference, Baseball America, and milb.com for the statistics I used in this post.

I would also like to thank NESN.com, the New Haven Register, and SB Nation’s Minor League Ball blog.

Prospect rankings are from Baseball America

Fenway Park Photo Credit: User: (WT-shared) Jtesla16 at wts wikivoyage [CC BY-SA 1.0 (http://creativecommons.org/licenses/by-sa/1.0)], via Wikimedia Commons


MLB Dream Team: Active Players Bound for the Hall of Fame, Part II

In a continuation of my article from yesterday, here is part two of the MLB Dream Team. This article will showcase spots six through nine in the batting order as well as the starting pitcher.

Enjoy!

Batting sixth and playing second base…

Robinson Cano

64.4 career WAR / 50.3 7yr-peak WAR / 57.4 JAWS

Average HOF 2B:

69.4 career WAR / 44.5 7yr-peak WAR / 56.9 JAWS

9th in JAWS out of 20 Hall of Fame Second basemen

Accolades: 8x All-Star, 2x Gold Glove, 5x Silver Slugger, World Series Champion (2009)

For many years, Robinson Cano has been in the conversation as the best second baseman in baseball.

He was an integral part of the New York Yankees 2009 championship squad, and he parlayed his five All-Star appearances with the Bronx Bombers into a 10-year, $240-million contract with the Mariners in 2014. Cano hasn’t lost his luster since leaving New York for Seattle, and he has made three All-Star Games (so far) with the Mariners.

Cano had to beat out Chase Utley and Dustin Pedroia — two likely Hall of Famers in their own right — to earn his position at the keystone sack in this lineup. Ultimately, Cano received the nod because of his sustained excellence. He has played at least 156 games every year since 2007, a level of health that neither Pedroia nor Utley can match.

Cano has also redefined the second-base position because of his ability to hit for average and power. Among Hall of Fame second basemen, Cano’s average of 25 home runs per season ranks second and his 296 career home runs ranks third. In a few years Cano should hold the record for career long balls by a second baseman, and he should be known as the greatest power hitting second baseman of all time.

Batting seventh and playing center field…

Carlos Beltran

70.3 career WAR / 44.3 7yr-peak WAR / 57.3 JAWS

Average HOF CF:

71.2 career WAR / 44.6 7yr-peak WAR / 57.9 JAWS

8th in JAWS out of 19 Hall of Fame Center Fielders

Accolades: Rookie of the Year (1999), 9x All-Star, 3x Gold Glove, 2x Silver Slugger

Carlos Beltran, always a reliable asset, is now in his 20th season. Beltran has been every archetype an athlete can be: young star (Royals); decisive deadline acquisition (Astros); hero (Mets); scapegoat (Mets again); veteran contributor (Giants, Cardinals, Yankees, Rangers); and experienced old-timer (Astros again). Beltran was the fifth-youngest in the majors when he debuted in 1998, and now he’s the third-oldest player in the league.

Beltran came into the majors as a 21-year-old kid for the Kansas City Royals, and immediately showcased his skills by taking home Rookie of the Year honors.

After seven years in Kansas City, Beltran signed with the New York Mets in 2005. It was in New York that Beltran would spend the prime of his career, making five All-Star appearances and taking home three Gold Gloves. Beltran proved to be one of the best players in the Major Leagues from 2006 to 2008, crushing 37 homers, driving in 124 runs, and scoring 123 (per 162 games).

Beltran has aged well, making All-Star teams as members of the Giants, Cardinals, and Yankees since leaving the Mets in 2011. However, the 40-year-old has shown signs of decline this year, and he may decide to hang up his spikes in the near future. Beltran left a lasting impression on the game of baseball, and his 20 years of service deserve a place in Cooperstown.

Batting eighth and catching…

Joe Mauer

51.4 career WAR / 38.5 7yr-peak WAR / 45.0 JAWS

Average HOF C:

53.4 career WAR / 34.4 7yr-peak WAR / 43.9 JAWS

8th in JAWS out of 15 Hall of Fame Catchers

Accolades: MVP (2009), 6x All-Star, 3x Gold Glove, 5x Silver Slugger

Even though Joe Mauer has not caught a game since 2013, he spent 10 seasons and 920 games behind the dish.

Mauer was truly one of the finest offensive backstops ever, and in 2009 he became only the second catcher since 1980 to win MVP (Ivan Rodriguez was the first in 1999). In Mauer’s MVP season, he led the majors in batting average (.365) and on-base percentage (.444), both of which were records for catchers. He also led the AL in slugging (.587), OPS (1.031) and Offensive WAR (7.6). In addition to his MVP, Mauer was the first AL catcher to win the batting title and he holds the record for most batting titles by a catcher, with three.

As well as being one of the league’s finest hitters, Mauer was a force to be reckoned with behind the plate. His great instincts and fielding prowess earned him three straight Gold Gloves from 2008 to 2010, and his 99.51% career fielding percentage ranks seventh all-time among catchers.

Although Mauer’s body has declined over the years, he has performed well since being moved to first base in 2014, and has not made an error this year in 69 games.

Mauer will leave a legacy as one of the greatest hitting catchers ever, and he has earned his place in the Hall of Fame.

Batting ninth at shortstop…

Troy Tulowitzki

44.0 career WAR / 40.0 7yr-peak WAR / 42.0 JAWS

Average HOF SS:

66.7 career WAR / 42.8 7yr-peak WAR / 54.8 JAWS

26th in JAWS out of 21 Hall of Fame Shortstops

Accolades: 5x All-Star, 2x Gold Glove, 2x Silver Slugger

This is the hardest decision on the roster, because in my opinion there aren’t any Hall-of-Fame-worthy shortstops in the majors right now. Alex Rodriguez and Derek Jeter, the two best shortstops of this generation, have retired in the past two years.

I ended up choosing Troy Tulowitzki because he has the best chance of any shortstop in the majors to make it to the Hall.

There were a few ways I could have gone with this pick. At first I considered moving Chase Utley to short, and then I looked at the plethora of up-and-coming shortstops (Carlos Correa, Corey Seager, Francisco Lindor; to name a few).

Ultimately, I chose Tulowitzki — but this would have been a much easier decision if Tulo had stayed healthy during his career. During his prime years with the Rockies between 2007 and 2014, Tulowitzki averaged a respectable 4.8 WAR per season. However, he missed an average of 45 games per year (!) during that period. If you extrapolate his numbers to 154 games (meaning he would miss 8 games per year), he would have recorded 6.7 WAR per season, boosting his JAWS from 42.0 to 50.0.

Although Tulowitzki didn’t stay healthy most of the time, his impact while he was on the field was undoubted, and he deserves Hall of Fame consideration.

And your starting pitcher for tonight…

Clayton Kershaw

58.8 career WAR / 48.7 7yr-peak WAR / 53.8 JAWS

Average HOF P:

73.9 career WAR / 50.3 7yr-peak WAR / 62.1 JAWS

60th in JAWS out of 62 Hall of Fame Pitchers

Accolades: Pitching Triple Crown (2011), MVP (2014), 3x Cy Young (2011, 2013, 2014), 7x All-Star, 1x Gold Glove

Clayton Kershaw, in my opinion, is the best pitcher in the game right now. He has been terrorizing opposing hitters since coming up as a 20-year-old with the Dodgers in 2008.

Kershaw achieved the Pitching Triple Crown in 2011, when he led the league in ERA, wins, and strikeouts. In 2014, Kershaw joined Roger Clemens and Sandy Koufax as just the third player in baseball history to win three Cy Young awards and an MVP.

Kershaw has finished as an All-Star and a top-five Cy Young award finisher in each of the past six seasons, a nearly unparalleled run of dominance, and he has already attained a career’s worth of honors at just 29 years old.

Supposing Kershaw retires at age 37, he has eight years remaining in his career. If we extrapolate his season average of 5.7 WAR to seven more years, then his current WAR of 57.0 jumps to 102.6, which places him as the ninth best pitcher of all time, a very fair assessment.

Kershaw has the lowest career ERA of any starter since 1920* (2.35), and he deserves a plaque in Cooperstown.

*Baseball-Reference defines a starting pitcher as a player whose starts make up 60% of their appearances. Minimum of 50 Innings Pitched.

Special thanks to baseball-reference.com for all of these helpful stats. I could not have written this article without them.


MLB Dream Team: Active Players Bound for the Hall of Fame, Part I

Sports always allow us to ask, what if? What if a baseball lineup — complete with all nine positions and a designated hitter — was composed of all-time greats in their best seasons.

I have composed a lineup filled with the very best active players who I think will make the Hall of Fame.

These players will not be judged on their performance this year; they will be chosen based on how well they performed during their primes.

I have designated a player’s “prime” as the best seven years of their career — not necessarily consecutive — and these selections are based on the player’s likelihood to make the Hall of Fame. Some members of the team will be inducted on the first ballot, and some will take years to make it to the Hall, but ultimately I think that every player on this list has a great shot at being immortalized in Cooperstown.

This article is part one of a two-part set in which I show my Dream Team. Part two will be released tomorrow.

Metrics Explained

Wins Above Replacement, or WAR, is the most commonly used advanced metric in baseball. It is a measure of how many wins a team gained by playing a specific player instead of a replacement player, who would have a WAR of 0. If a player records 2 WAR in a season, he is considered starting material, 4 or 5 WAR is acknowledged to be All-Star value, and 8 WAR is MVP-level production.

The Jaffe WAR score system, or JAWS, is simply the average of a player’s seven-year peak WAR and career WAR. For example, if a player had 100 career WAR and 50 seven-year peak WAR, his JAWS would be 75. This metric gives us perspective on how likely it is for a player to make the Hall of Fame compared to those who played their position.

Fielding Percentage is a measure off how often a player commits an error. For example, a fielding percentage of 97% means the player committed an error on 3% of the plays he made.

Note: This list favors older players because:

  • They have more career WAR
  • They have more years from which to choose their seven-year peak WAR
  • They are closer to entering the Hall of Fame than younger players.

Batting leadoff and playing right field…

Ichiro Suzuki

59.4 career WAR / 43.6 7yr-peak WAR / 51.5 JAWS

Average HOF RF:

73.2 career WAR / 43.0 7yr-peak WAR / 58.1 JAWS

17th in JAWS out of 24 Hall of Fame Right Fielders

Accolades: MVP (2001), Rookie of the Year (2001), 10x All-Star, 10x Gold glove, 3x Silver Slugger

Ichiro was one of the easiest selections for this Hall of Fame Dream Team. He was a trendsetter — the first Asian position player to debut in the Major Leagues.

In his rookie season, Ichiro set the baseball world ablaze, winning MVP and Rookie of the Year, and leading the league in hits, stolen bases, and batting average.

Ichiro was a revelation in the big leagues, and his game was predicated on speed not power, completely opposite to the direction baseball was trending. According to FanGraphs, Ichiro occupies the first seven spots on the list of highest single-season infield hit totals.

Ichiro was the hit king. He holds the records for most hits in a season (262) and most consecutive 200-hit seasons (10). He also tied the record for most 200-hit seasons (10), and led the league in hits seven times.

Recently, Ichiro reached the 3,000 hit plateau, and if you count his hits from his time in Japan, he broke Pete Rose’s record for most hits across all of baseball’s professional leagues.

In his prime, Ichiro was one of the best players in the world. Only Albert Pujols and Alex Rodriguez accumulated more WAR than Ichiro from 2001 to 2010. On top of being one of the greatest to ever play in the outfield, Ichiro was a cultural icon, and many of the recent advances that Asian players have made are attributable to him.

Batting second and playing left field…

Mike Trout

52.0 career WAR / 52.0 7yr-peak WAR / 52.0 JAWS

Average HOF CF (out of 19):

71.2 career WAR / 44.6 7yr-peak WAR / 57.9 JAWS

14th out of 19 Hall of Fame Center Fielders

Accolades: 2x MVP (2014, 2016), Rookie of the Year (2012), 6x All-Star, 5x Silver Slugger

Trout usually plays center field, but I had to move him over to left in order to accommodate him in the lineup.

Mike Trout is hands-down the best player in baseball right now, and is surely destined for Cooperstown.

Trout has only played five full seasons, but his numbers stack up well next to other center fielders who are enshrined in the Hall. And at just 25 years old, Trout is only entering his prime, meaning that his best years are ahead of him.

Now that’s a stunning thought.

Trout also has the sixth-best seven-year peak WAR out of the 24 center fielders in Cooperstown, in only five seasons!

Here I am talking about how Trout is a generational talent, and I haven’t even mentioned the countless honors that he has collected. Trout has made the All-Star team (for which he has won MVP twice), taken home a Silver Slugger, and been either MVP winner (twice) or runner-up (three times) in every season of his career.

That level of dominance is mind-boggling and completely unprecedented.

Batting third as the designated hitter…

Miguel Cabrera

70.0 career WAR / 44.6 7yr-peak WAR / 57.3 JAWS

Average HOF 1B:

66.4 career WAR / 42.7 7yr-peak WAR / 54.6 JAWS

10th in JAWS out of 20 Hall of Fame First Basemen

Accolades: Triple Crown (2013), 2x MVP (2012, 2013), 11x All-Star, 7x Silver Slugger, World Series Champion (2003)

Miguel Cabrera, still one of the best players in baseball, is a generational talent and already a surefire Hall of Famer. The Venezuelan has been tearing up the big leagues ever since debuting in 2003, and has brought a cheerful smile and a love of the game to wherever he plays.

In the beginning of his career, Cabrera was a young star on the Florida Marlins, one of the youngest teams in baseball. He experienced success early on when the Marlins won the World Series in his rookie year. Then, after a blockbuster trade to the Detroit Tigers in 2007, he continued to amaze in the American League.

From 2011 to 2015, Cabrera was the most feared hitter in all of baseball. During that time, he won four batting titles, took home two MVPs, and racked up five All-Star selections. In 2013, Cabrera captured the Triple Crown (leading the league in batting average, home runs, and RBIs), a feat that had not been accomplished since 1967.

Cabrera already has 2,598 hits and 458 home runs as of July 22nd, so he has a good chance to join Hank Aaron, Willie Mays, and Alex Rodriguez as the fourth member of the 3,000 hit and 600 home run club. Cabrera’s near-incomparable match of hitting for both power and average have vaulted him into the conversation as one of the best hitters of all time.

Batting cleanup and playing first base…

Albert Pujols

100.1 career WAR / 61.6 7yr-peak WAR / 80.8 JAWS

Average HOF 1B:

66.4 career WAR / 42.7 7yr-peak WAR / 54.6 JAWS

2nd in JAWS out of 20 Hall of Fame First Basemen

Accolades: 3x MVP (2005, 2008, 2009), Rookie of the Year (2001), 10x All-Star, 2x Gold Glove, 6x Silver Slugger,  World Series Champion (2006, 2011)

The easiest choice on the roster, Albert Pujols should make the Hall of Fame on the first ballot. Much like Pujols’ overflowing trophy cabinet, I don’t have room enough to praise Pujols, truly one of the greatest players ever.

Pujols has faded since he signed with the Angels on a 10-year, $240-million contract in 2012, but don’t let his struggles of late affect your judgement on his case for the Hall of Fame. He trails only Lou Gehrig in career WAR among first basemen, and is one of only 21 position players to record 100 career WAR.

Pujols’ nickname “The Machine” was an apt description of his time as a Cardinal. His 162-game average stats for his 11 years in St. Louis were: .328/.420/.617 with 127 RBIs, 123 runs, and 43 home runs. Pujols finished in the top 10 of the MVP voting all 11 years, ending up in the top five in ten seasons, and winning the award three times. But Pujols isn’t just a slugging first basemen, he is a very capable defender and has won two Gold Gloves.

Pujols became the ninth member of the 600 home run club earlier this year, and next year he should join the 3,000 hit club (as of July 22nd he has 2,908 hits). Pujols leaves a legacy as one of the best ever, and he deserves to be enshrined in Cooperstown.

Batting fifth and manning the hot corner…

Adrian Beltre

91.5 career WAR / 49.7 7yr-peak WAR / 70.6 JAWS

Average HOF 3B:

67.5 career WAR / 42.8 7yr-peak WAR / 55.2 JAWS

5th in JAWS out of 13 Hall of Fame Third Basemen

Accolades: 4x All-Star, 5x Gold Glove, 4x Silver Slugger

Adrian Beltre, still chugging along at the ripe age of 38, has graced baseball with his presence for 20 seasons. From hitting home runs off one knee, to his aversion of people touching his head, Beltre is one of the true characters of the game.

Beltre is third all-time in WAR among third basemen, trailing only Mike Schmidt and Eddie Mathews. He also figures to be the next member of the 3,000 hit club, needing only 15 more hits as of July 22nd. And if he decides to come back and play next year, he has a great chance of overtaking Brooks Robinson for most games played at third base.

Those are just some of the records that Beltre is approaching, and he does not seem to be slowing down.

There is just no debate on Beltre’s Hall of Fame candidacy. Among all third basemen, he ranks in the top five in games played, hits, doubles, home runs, RBIs, and WAR.

Beltre’s legacy will be as one of the best defensive third basemen of all time, and he trails only Brooks Robinson in Defensive WAR among players who have manned the hot corner. His highlight reel of diving stabs, barehanded picks, and throws from all the way across the diamond make him one of the best ever to play third base.

Special thanks to baseball-reference.com for all of these helpful stats. I could not have written this article without them.

Thanks for reading Part I. Part II will be released at a later date and it will include spots 6-9 in the batting order as well as the starting pitcher.

To be continued…


How Aaron Judge Can Turn the Corner

Yankees right fielder Aaron Judge is, to say the least, an imposing figure in the batter’s box. Judge is one of only three position players in baseball history with a height and weight of at least 6’7” and 255 pounds, respectively – the other two, for those curious, being 1960s power hitter Frank Howard and current Tigers minor league Steven Moya – and with his enormous size comes enormous strength. According to Statcast, 59.5% of Judge’s batted balls last season left the bat with an exit velocity of at least 95 miles per hour, a mark that trailed only those of the Brewers’ Domingo Santana and the Mariners’ Nelson Cruz. Further, Judge’s average exit velocity ranked second among the entire league, with only Cruz ahead of him. However, the player comparison that most swiftly comes to mind is the Marlins’ Giancarlo Stanton, who, incidentally, finished third in average exit velocity last season. When Judge truly barrels up the ball, as exemplified here, his raw power tends to elicit the type of awe usually reserved for Stanton.

Unfortunately for the Yankees, Judge was largely unable to capitalize on this strength in 2016. Although he only saw 95 plate appearances, he batted an uninspiring .179 with an astronomical 44.2% strikeout rate. Even his ISO, above average at .167, was still disappointing for a player claiming raw power as his most prominent attribute.

The Yankees, of course, were fully aware that their right fielder’s approach at the plate needed an adjustment. Said Yankees assistant hitting coach Marcus Thames during spring training:

“I thought [Judge] started expanding a little too much… At the big-league level, the game’s a little bit more physical, it’s a little bit faster and I thought it sped up on him a little bit and he started expanding.”

A cursory look at Judge’s 2016 batting statistics plate surprisingly suggests that plate discipline may not be as big a problem as one would expect based on Thames’ comments. Among 451 position players with at least ninety plate appearances in 2016, Judge’s O-Swing percentage was tied for 119th at 33.6% (27th percentile), and his Z-Swing percentage of 63.5% ranked nearly identically, at 112th (68th percentile).  Judge, surprisingly, rated fairly well in both measures: he chased far fewer balls than the average hitter, and he swung at a healthy percentage of strikes.

His contact rates, on the other hand, did not inspire quite the same sanguinity. Last season, Judge ranked dead last in overall contact percentage, as well as on pitches outside the strike zone. On pitches inside the strike zone, his contact percentage saw a slight improvement relative to his peers, but still ranked 42nd from the bottom. BaseballSavant’s pitch heatmaps suggest that Judge seemed to have the most difficulty with low and away pitches, both in and out of the strike zone. The following graph displays the locations of Judge’s swinging strikes from 2016 (not including foul balls):
2-Judge[A-SwingingStrikes]

As the preceding heatmap illustrates, the crux of Judge’s contact problems occurs in the low-and-away portions in and around the strike zone. However, a heatmap of Judge’s hardest-hit balls (exit velocity >= 100) shows that Judge’s best contact occurs on pitches that aren’t located anywhere near the low and away sections of the zone. In fact, the pitches Judge hits best are on the inside half of the plate:

2-Judge[B-100MPH]

Now, let’s see where Judge’s weaker contact (exit velocity <= 99) falls in the strike zone.

2-Judge[B-99MPH]

So, low and away pitches not only induce a league-leading whiff rate for Judge, but even when he does manage to connect, he connects with his weakest exit velocity. Marcus Thames’ comments, therefore, may require a slight adjustment: Judge didn’t necessarily expand the zone in 2016, but he certainly didn’t make the most efficient use of it. Courtesy of Brooks Baseball, the following graph illustrates Judge’s 2016 whiff rate by zone:

2-Judge[C-WhiffRateX]

From these charts, we can observe Judge’s whiff rate slowly rising from left to right (inside to outside) across the strike zone. To cut down on his high swinging-strike rate, which was the third-highest in the league among those 451 batters, Judge should reduce his swing rate on low and outside pitches – at least, until the count or game situation demands a more aggressive approach. Ahead in the count, however, Judge should look primarily for the middle-in pitches that have produced better and more frequent contact. He shouldn’t even consider swinging at anything on the outer sections of the plate, as he did last season while ahead in the count (heatmap from FanGraphs):

2-Judge[E-AheadInCount]-FanGraphs


As of Tax Day afternoon, the Yankees are only 11 games into the season, so it’s admittedly a bit early to draw any major conclusions. Even so, we should note that Judge has shown signs of legitimate improvement over last year’s campaign. In 33 at-bats, Judge is slashing .276/.364/.621, and although a 175 wRC+, .345 ISO, and 50% HR/FB rate are all but guaranteed to decline, there’s still reason to believe that Judge has made significant strides in his approach at the plate. Last year, Judge saw the 18th lowest percentage of fastballs in the league at 49.8%, a percentage that this season has dipped even further, to 45.5%. Pitchers, expecting Judge to flail as in 2016, have fed him a steady diet of low and away breaking balls. The following chart reflects all off-speed pitches Judge has faced to date in 2017:

2-Judge[D-17Offspeed]

Even with this steady diet of low and away breaking balls, Judge has managed to cut his O-Swing% from 34.9% to 23.9%, and his swinging-strike percentage has fallen from 18.1% to 12.0%. This is especially impressive considering that, like last year, pitchers have thrown him a fairly low percentage of strikes (about 41%).

The Yankees have lots of reason for optimism regarding their young slugger. As the starting right fielder in Yankee Stadium’s less-than-spacious right field, Judge’s value to his team will derive mostly from his batting output. If Judge can consistently lay off of the low and away pitches that gave him problems last year, he’ll have more opportunity to mash the balls that find the inner half of the plate – like this beauty from last Wednesday. If his early 2017 performance is any indication, Judge’s offseason adjustments have the potential to transform him into a Giancarlo Stanton-caliber power hitter.


Should the Best Team Win Each Year?

The Cubs won the 2016 World Series. Though that hopefully isn’t news to anyone, it is still interesting for a variety of reasons. Notably, it was the Cubs’ first World Championship since 1908. I have nothing new or interesting to add to the conversation about the Cubs’ accomplishment. The reason I want to talk about the Cubs now is because not only are they World Champions, they were also clearly the best team in the MLB this year.

Most fans recognize that those two statements are saying vastly different things. The Cubs won more games in 2016 than any other team, had the greatest run differential and had the highest team WAR total, so it is fairly safe to say that they were, in fact, the best team in 2016. But in 21 seasons from 1995-2015 (wild-card era) the team with the best regular-season record (or tied) has only won the World Series four times: the Red Sox in 2007 and 2013 and the Yankees in 1998 and 2009. That’s a 19% success rate. Also since 1995 only three teams that have led the major leagues in team WAR have won the World Series: again the 2007 Red Sox and 2009 Yankees, and also the 2010 Giants. That’s 14%. So that raises the question: is this a problem? Should the World Series champion more frequently be the best regular-season team? Should MLB change things to fix this problem?

Read the rest of this entry »


2016 Cubs Run Differential

In this post, I take a look at the 2016 Chicago Cubs though their first 100 games. I’ll start out by focusing on the Cubs’ run differential (Runs Scored – Runs Allowed). After a historic start, they reached their pinnacle after the 67th game of the year against the Pirates. At this point, the Cubs were 47-20 and had outscored opponents by 171 runs! Since then, the ball club is 13-20 and their current run differential is at +153.

Still, the Cubs’ +153 mark is 42 runs better than the next-closest team (Washington Nationals). The Cubs and Nationals are the only clubs to have a run differential that is greater than +100. The second-place Cardinals rank third in the league at +95 right now. While the Cubs dominate the top end of the spectrum, the Reds and Braves are running away with the worst run differentials in the league. The Reds have a -143 mark, largely due to the thrashings they have taken at the hands of the Cubs so far in 2016. The Braves have the second-to-worst differential at -134 runs.

Projected Runs to Wins

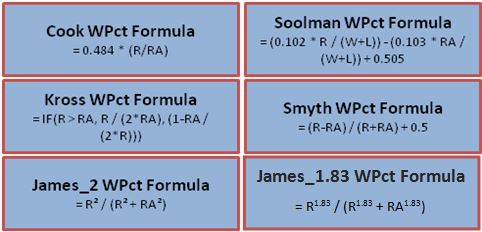
In another place, I introduced the “Pythagorean Theorem’s of Baseball” which basically tries to determine the number of games a team will win based on their number of runs scored and number of runs allowed. Here are the formulas for six of the most common win-percentage projection formulas:

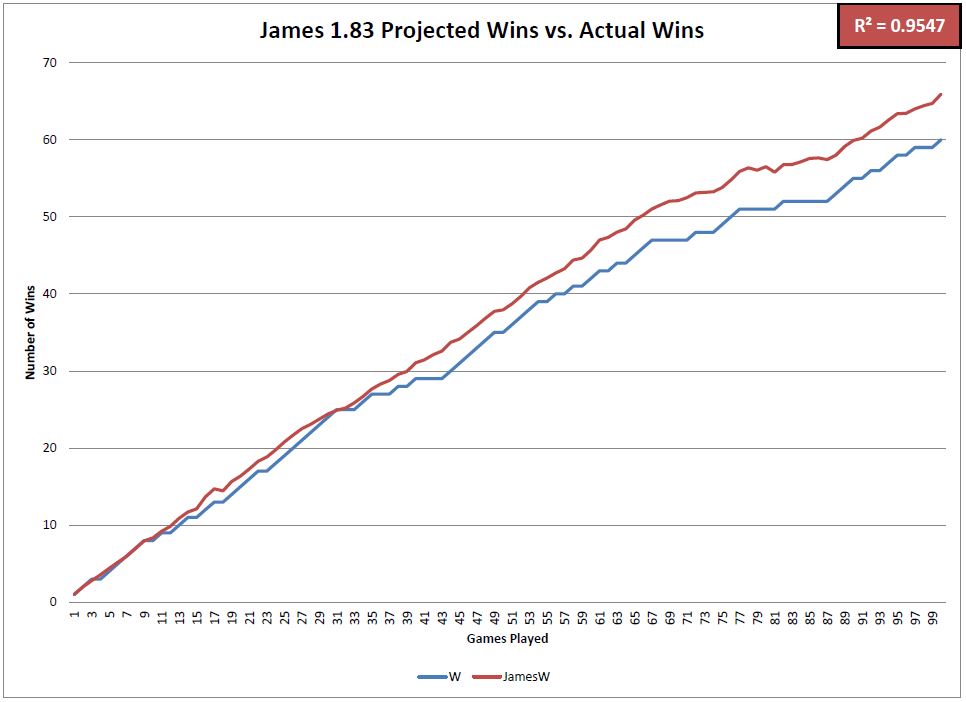
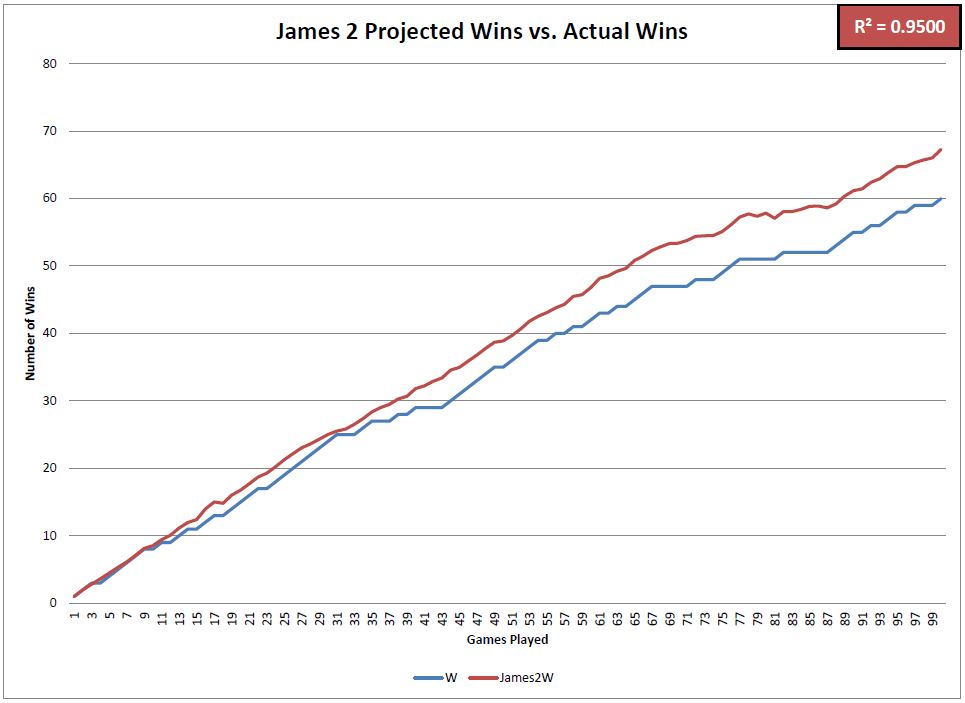
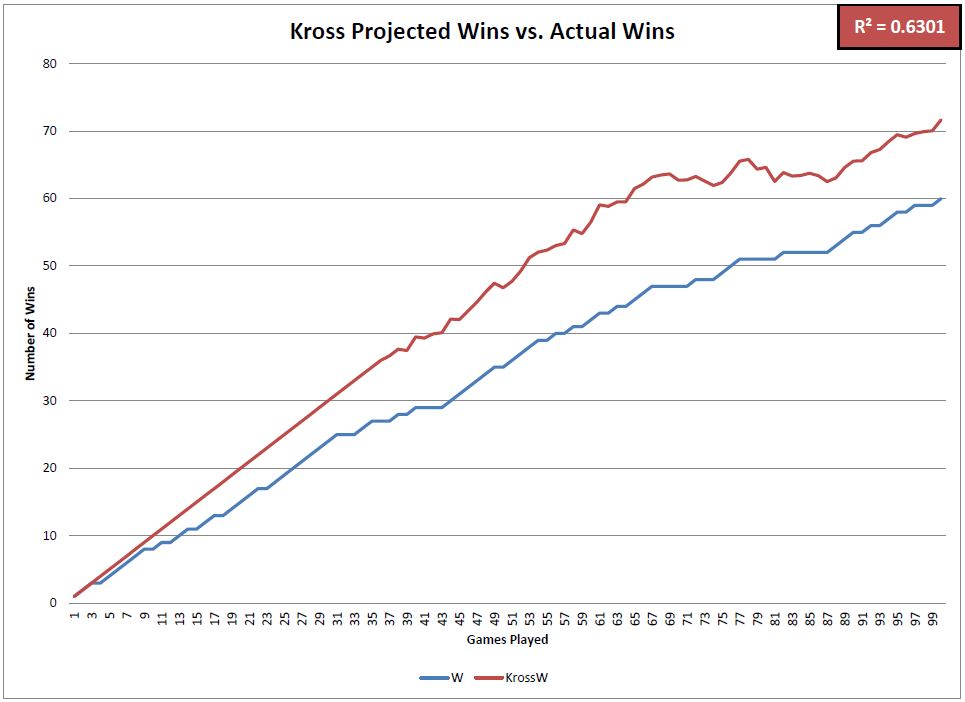
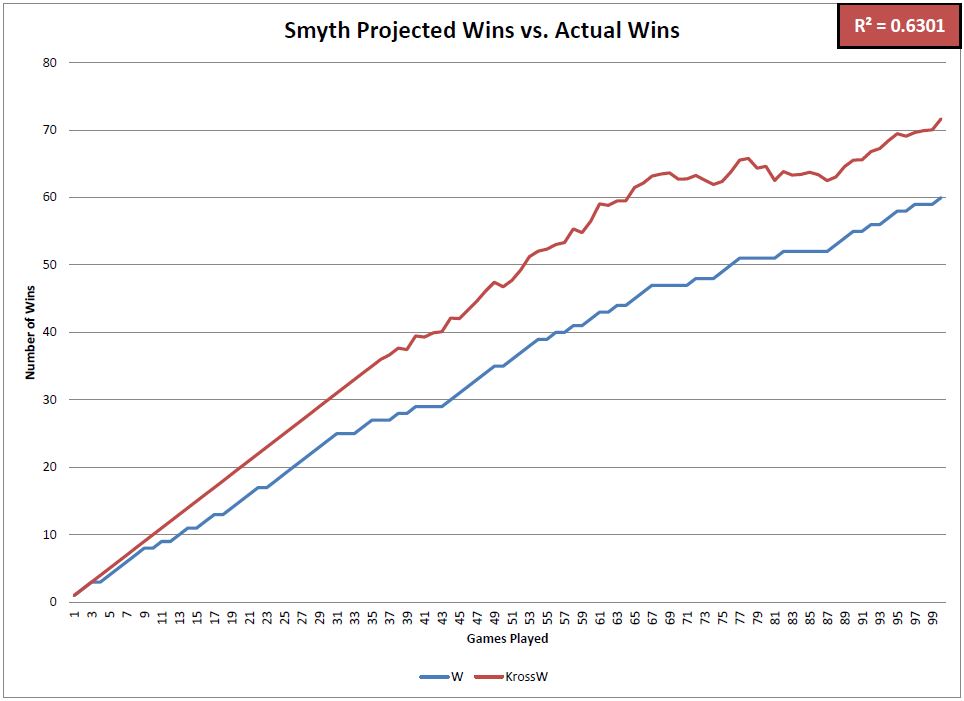
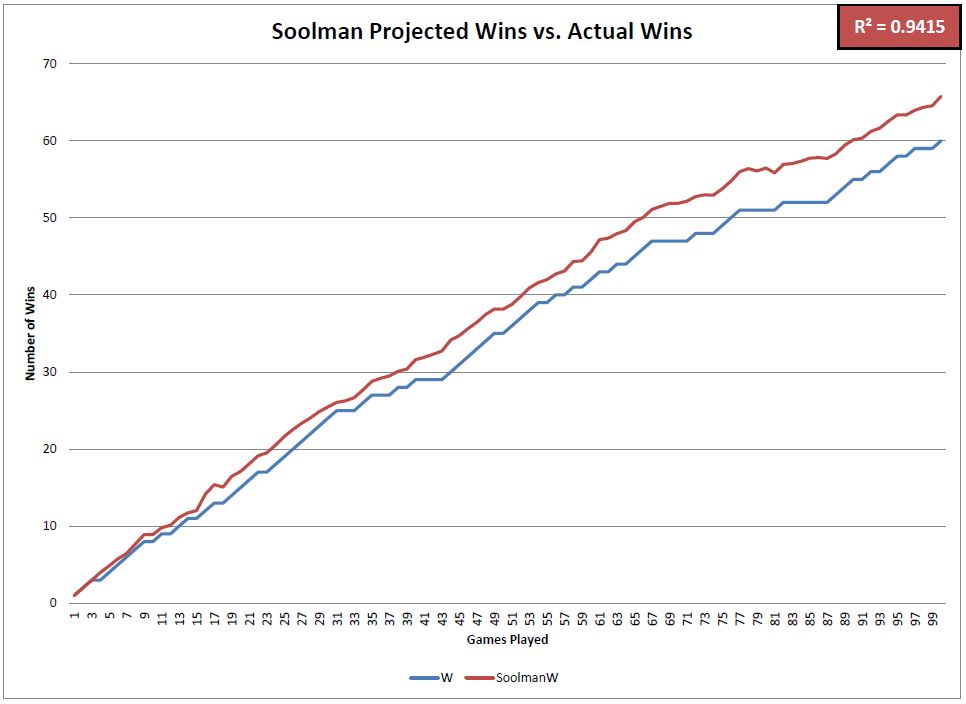
I added up the Cubs’ total runs scored and total runs allowed after each game this year and compared their actual number of wins to the projected number of wins based on each formula. These charts visualize the differences between those numbers.

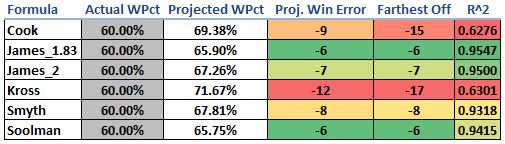
This matrix summarizes how accurate each of the projection formulas has been in predicting the Cubs’ winning percentage and total number of wins so far in 2016. The most accurate formulas was the James_1.83 followed by the James_2 and Soolman. Four of the six formulas were very good predictors, but the Cook and Kross formulas overforecasted the number of wins that they expected the Cubs to have. Notice that at one point this year, each of those formulas projected the Cubs to have over 15 more wins than they actually had. The R^2 value (coefficient of determination) is indicative of how well the projected win percentage matched up to the actual win percentage after each game this season.

All in all, the Cubs have should have at least six more wins this year based on these formulas. Scoring as many runs as they have (4th most in the MLB) and allowing as few runs as they have (T-1st in the MLB) should result in an even better record than 60-40. We knew it was unlikely that they would keep up their record-setting start in the run-differential category, but it will be interesting to see how these numbers match up as the season progresses.

@CubsAdvMetrics on Twitter


The Good and the Bad: David Price Isn’t Sinking

You know his story: David Price is a $217-million man with a 4.74 earned run average, and the people of Boston aren’t happy. It’s another Crawford-Sandoval-Ramirez waste of money. Things are headed downhill for the 31-year old veteran. Or are they?

First, the bad news: the 2016 version of David Price has been worse than the 2015 David Price, and way worse than the top-caliber pitcher Boston signed him to be. And the ERA shows it.

The suspect is pitch selection, and the culprit is a sinker that doesn’t sink. Price has a two-seam fastball that over his seven-year career he has thrown some 30% of the time. In his prime, it clocked in at 94-95 mph, but since then he’s dropped almost two mph.

Usually, that level of velocity leak wouldn’t be a big deal, because if there’s enough movement and deception, batters will be fooled either way. But Price’s sinker is different.

Brooks Baseball reports that “His sinker has well above-average velocity, but has little sinking action compared to a true sinker and results in more fly balls compared to other pitchers.” Uh-oh. “Little sinking action?” There needs to be at least some element of vertical movement for a sinker to be fully effective, or, in Price’s case, a little extra velocity. But now he has neither.

The results show it. Last month, he surrendered 10 home runs, more than the previous two months combined. Also in June: 31% of his pitches were sinkers, nearly 10% more than the month before. Coincidence? I think not. He’s also allowing a .241 Isolated Power on sinkers, only three points less than Mike Trout this season. And maybe the most convincing statistic: hitters are pulling the ball 10% more than they did last year, which means they are making more solid contact and not having to stay back on his fastball. Price’s pitches are slower, and it’s making a difference.

Why is he losing velocity? There’s two possibilities and they point in completely opposite directions. The first is age. Price is 31 and he’s nearing the point where most starting pitchers start to fall on the aging curve and eke velocity. If this is the case, it’s going to be a long seven years for the Red Sox. But there is another possibility. Price has played in Tampa Bay for most of his career, where the temperatures are never 40 degrees like Boston in April. It’s entirely possible that the cold ‘froze’ him up this spring and as the season continues, he’ll regain his speed. Most likely, it’s a combination of both. But either way, it’s never a good sign when pitchers slow down.

Price has always gotten away with leaving sinkers up in the zone because they showed 94-95 mph on the radar gun. But now hitters are seeing 92mph fastballs fly straight down the middle of the plate and stay there.  Why doesn’t he just put the ball on a tee? Nine out of 10 major-league hitters will knock that pitch into the stands every time. Just look at the stats: He’s surrendered just two fewer home runs than he did last season even though he’s pitched 112 fewer innings (2015: 17, 2016: 15), and he’s allowed an average of 1.25 home runs per nine innings, which is 32 percent worse than his career average (0.84). Sinkers are sending the man to his grave.

They’re also killing his ERA. 38% of his earned runs are from home runs, and if you set his home runs to eight instead of 17, his ERA would be 4.01 instead of 4.74, a 0.73 difference. (8 is the number he had allowed last year at this point in the season.) In fact, his strikeout and walk totals are even better than last season, but the home runs negate all of it.

But we can’t blame everything on the sinker, either. Price has definitely been unlucky this season. His home run to fly ball ratio is 15.5%, an unsustainable mark, his .323 BABIP .035 more than his career average, and his LOB% 10 percent less than the 2016 league average. These will balance out in time. But his sinker is the real problem.

The only way to truly limit home runs is to limit fly balls, and for Price, the only way to limit fly balls is to stop throwing sinkers that don’t sink. The solution is (1) throw harder, or (2) find another pitch to replace his sinker. Option one is still TBD. Option two could be filled with either a change or slider — two pitches that he has used to complement his fastball but never to the level that he uses his sinker. The outlook is grim either way.

Price is still a very experienced pitcher, and once his HR/FB, LOB%, and BABIP rates come down to earth, things will even out. But if he wants to be successful for the Red Sox for the entirety of his stay, there’s a longer-term issue at stake, and if his velocity continues to leak, I’m not sure what type of David Price we’ll be looking at a year from now.


Exploring Uncharted Territory with Leonys Martin

Edit: Since this piece was submitted (May 23), several developments in the Martin narrative have arisen, notably some more astute analyses than mine (namely Jeff Sullivan’s great piece on Martin’s batted-ball profile & an extremely in-depth look at his swing mechanics by Jason Churchill over at ProspectInsider, do go check him out) as well as this walk-off dinger against the Oakland A’s. 


A lot has gone right for the Seattle Mariners in new GM Jerry Dipoto’s first season. At time of writing, they sit in first place in the AL West with the third-best record in the American League and the best road record in baseball. One potential factor in Seattle’s success that has, until recently, taken a backseat to Robinson Canó‘s resurgence and Dae-Ho Lee’s power-hitting heroics is the sudden onset of what could turn out to be an offensive breakthrough for outfielder Leonys Martin.

The Mariners’ acquisition of Martin and Anthony Bass in exchange for Tom Wilhelmsen, James Jones, and a PTBNL (Patrick Kivlehan) is one of several moves last offseason that seem to follow a common guiding principle: bring in players who’ve struggled in recent seasons but demonstrated real value in seasons past. This category includes the likes of Steve Cishek and Chris Iannetta, both of whom seem to have (thus far) rebounded from uninspiring 2015 campaigns.

Meanwhile, Leonys Martin is having the best season of his life. This is mostly remarkable due to the fact that his hitting isn’t, and has never really been, the source of his value. He’s never topped 89 wRC+ in any season, and his career high for home runs in a year is eight. He’s also been historically abysmal against left-handed pitching. From 2012-15, Martin slashed .233/.274/.298 with 53 wRC+ against southpaws; no outfielder in baseball posted fewer wRC+ in that same span (min. 300 PAs). His poor performance in the second half of 2015 (.190/.260/.190 with 22 wRC+ after the All-Star break) earned him a demotion in early August. That lackluster second half, coupled with the emergence of Delino Deshields Jr. as a capable replacement, made it a lot easier for the Rangers to part with him in the offseason (incidentally, DeShields was demoted in early May and Wilhelmsen has been the worst reliever in the majors this year by fWAR, so that’s something).

Going into this season, Steamer projected him for around 492 PA with a .241/.292/.350 slash line and 79 wRC+, in addition to eight homers and 22 stolen bases, putting him on course for 1.2 fWAR. While not exceptional, this likely would have been an adequate season for Jerry Dipoto given the cost, especially at Martin’s $4,150,000 salary, but Martin’s already managed to match that mark, posting 1.4 fWAR as of May 23rd, and he’s providing a great deal of that value with his bat.

Martin seems to have shook off a bit of whatever seemed to be plaguing him at the tail end of 2015. He’s slashing .252/.331/.467, which would, over a full season, leave him with a career-best OPS of .798 and 124 wRC+. He still hasn’t been able to hit lefties, but that’s what platooning is for. But by far the most eye-popping aspect of Martin’s game this year is what looks like a sudden influx of power. Martin’s mark of .215 ISO is easily the best of his career — his eight home runs have already matched his career-best single-season total — and it’s not even June yet. With no context, one could look at Martin’s line thus far and notice that he might be on pace to post a 30 HR/30 SB season, if not for the slight inconvenience called “At No Point In His Career Has Martin Demonstrated That He Might Even Touch 30/30”. And yet this is baseball, and this is 2016, the Year of the Bartolo Colón Home Run. Anything is possible.

So — what’s changed for Martin? And perhaps more importantly, where the heck did all these home runs come from?

We turn first to Martin’s batted-ball profile. For the last two-and-some seasons, Martin’s fly-ball percentage has actually increased. His 2015 mark of 33% was actually a career-best at the time, especially considering it was brought down by his abysmal second half. He’s picked it back up in 2016, with a gaudy 45% fly-ball rate. Of course, the sustainability of this figure is questionable (one might also point out Martin’s likely inflated HR/FB rate of 20.5% — opposed to a current league average of 12.1%), but at no point in his career has Martin hit fly balls with such consistency:

Other indicators of improved power add credence to this positive trend. Martin’s quality of contact also seems to have improved this year, as his hard-hit ball rate of 34.4% is vastly superior to his pre-2016 range of about 23 – 25%. It’s also true that home/road splits affect the narrative somewhat, as only one of his eight home runs occurred at Safeco Field. But I suspect that there may be more to Martin’s offensive resurgence than just hitting balls harder.

One of the feel-good narratives of this season is the positive influence that new hitting coach Edgar Martínez has introduced to the Mariners offense, which currently ranks 2nd in the AL in runs scored. Martinez was brought in to replace Howard Johnson in June 2015, hoping to fix an anemic Mariners offense that struggled early and often. To date, that new appointment has been received with praise from Seattle media and fans, but more importantly from the players themselves. Could it perhaps be the case that Edgar’s tutelage, along with Jerry Dipoto’s promise to mold the 2016 Mariners to fit his “Control the Zone” philosophy, has brought about a positive change in the way Leonys Martin approaches hitting?

Overall, Martin’s plate discipline metrics show that his approach at the plate hasn’t changed too drastically from last season. If anything, his 70.4% contact rate is his lowest since 2012. One other thing sticks out here, namely that Martin seems to be more patient on pitches out of the zone and more aggressive on pitches in the zone. Compare the percentage of pitches he swings at in 2015 (left) to 2016 (right), courtesy of BrooksBaseball.net:

There is a relatively noticeable difference here, especially on high and outside pitches. According to PITCHf/x, his O-Swing% of 27.9 is easily the lowest of his career. Likewise, his Z-Swing% of 67.0 is his highest since 2012. These are generally good indicators that Martin is seeing the ball better or, at least, cut down on his tendency to chase pitches out of the zone.

And then there’s the matter of his batting stance.

Take a look at his stance for this home run on May 27, 2015, facing off against Scott Atchison:

Now check out his stance almost a year later, on May 22, 2016 in this at-bat against John Lamb.

An important thing to note about these stills is that I picked them mostly because of their similar camera angles. Martin’s foot position in other highlights is often obscured by the pitcher, or the pitcher is already in the middle of his wind-up, giving Martin time to square up before the pitcher’s delivery (as is slightly apparent in the at-bat against Lamb). But the vast majority of video evidence from this season is consistent with the idea that Martin has generally closed off his stance and now begins pretty much every at-bat with his feet squared to the pitcher. Now, I am aware that the batting stance is a rather fluid component of any baseball player’s oeuvre and can change for a number of reasons, not all of them being deliberately engineered to improve performance. I can’t seem to find anything about Martin having changed his stance online, aside from this ESPN piece from February of this year — but the focus of that article is on a legal issue Martin dealt with over the offseason, and the only comments offered on Martin’s approach seem to indicate that his stance hadn’t actually changed:

Martin also worked with a hitting instructor during the offseason in Miami. He altered his approach at the plate — his stance remains the same, he said — and he was pleased with the results when he faced pitchers in winter ball.

The most significant changes I’ve noticed as a result of comparing film from 2015 to film from 2016 are the aforementioned foot positioning and the fact that his hands are a little bit closer to his body this year. Generally speaking, though, it’s hard to really quantify the connection between a player’s stance and his performance. If this change in stance is deliberate, we can only really speculate as to the reasoning behind it. There are certainly good reasons to make the adjustments Martin has made. Bringing the hands closer to the body is often a nice starting point for a player who wants to make his swing a little more compact and less erratic. As for the foot positioning, there are a few benefits to batting with an open stance, especially for a left-handed hitter. One is that it enables left-handed hitters to see the ball better, especially when facing a left-handed pitcher. Another is that it eliminates the problem of the front foot stepping away from the plate on the swing, as batting from an open stance requires you to bring your front foot towards the plate in order to square up to hit the ball. It’s hard to say if Martin has previously had this issue in the past, but the fact that he’s changed from an open stance to a square stance likely indicates to me that whatever advantage he gained from an open stance may no longer be necessary. We don’t know if Martin has made these adjustments for the reasons listed above or if he has made them for any real reason at all, but he’s still made them all the same, and as it happens, they’ve been working out quite nicely for him.

That said, let’s not go overboard about a quarter-season of statistics just yet. Though Martin is posting career bests in almost any meaningful batting metric, there is still reason to believe he might still turn out to be an average or below-average hitter for the rest of the season. His on-base record is rather inflated by recent performances, he strikes out too much, and he continues to sport uninspiring numbers against left-handed pitching. All the same, his eight home runs this season aren’t going away, even if his fly-ball rate might. It’s unlikely, barring injury, that he’s not going to hit any more home runs for the rest of the year, so 2016 will most likely be a career year for him in the power department, and if his BABIP mark of .302 this year can regress back to his 2013-14 average of .326 rather than his poor 2015 mark of .270, 2016 may turn out to be a career year for him across the board. Martin’s offensive production has certainly been a pleasant surprise for the Mariners, and it would be interesting to know if altering his batting stance was a deliberate factor in producing an improved approach at the plate. If the Leonys Martin we’ve seen so far this year is anything like the Leonys Martin we’re going to see for the rest of the year, Jerry Dipoto may have stumbled upon a surprisingly high return on what was initially a low principal investment.


Will the Real Tyler Goeddel Please Stand Up?

Similarly to a large portion of the FanGraphs community, I am a Philadelphia Phillies fan.  I was born in South Jersey just 20 minutes away from the stadium and grew up watching every game.  I was there for the tough times in the late 90’s / early 2000’s, and I was there for the glory days of 2007-2011.  After an abysmal last few seasons of baseball in Philadelphia, we have finally seen some promise this season leading us to believe that better days are coming soon.  One of the bright spots on the team so far this year has been Rule 5 pick, Tyler Goeddel.

After being selected in the first round of the 2011 MLB Rookie Draft, Tyler Goeddel began his professional career with the Tampa Bay Rays.  Goeddel was drafted out of high school as a third baseman and for the first three years of his minor league career that would be the only position he played.  In 2015, however, the Rays decided to move Goeddel to the outfield.  His athleticism allows him to play all three outfield positions and that type of versatility is very sought after by big league clubs.  While defense was never his problem, Goeddel’s bat didn’t develop as quickly as the Rays had hoped.  He was a career .262 hitter with 31 home runs across four full seasons in the minor leagues.  Ultimately the Rays made a tough decision and left him off their 40-man roster, knowing there was a great chance another team would select him in the Rule 5 Draft.  Shortly after, the Phillies did just that and selected Goeddel with the first overall pick of the 2015 Rule 5 Draft.

The Philadelphia Phillies have historically been excellent in finding talent in the Rule 5 Draft.  (2004 – Shane Victorino, 2012 – Ender Inciarte, 2014 – Odubel Herrera).  In the early going, I (like most Phillies fans) was very skeptical as to whether or not Goeddel could follow in the footsteps of players like Shane Victorino and Odubel Herrera and become a valuable contributor to our big league team.  Goeddel had a mediocre spring training but with no other serious competition in the corner outfield spots, there was no harm in keeping him around for a rebuilding year and seeing what the kid could do.

The beginning of Tyler Goeddel’s major league career could not have gone much worse.  Take a look below at his stats through his first nine games:

4:6 - 4:19 Stats

In only 16 at-bats, Goeddel recorded only one hit (a single), and struck out a whopping eight times!  Now obviously this is a VERY small sample size, and we should expect some struggles while adjusting to big league pitching.  Up until this point, Goeddel has never seen pitching above the Double-A level.  Now let’s take a look at his plate discipline stats over the same time frame:

4/6 - 4/19 Plate DisciplineO-Swing % – Percentage of time a batter swings on pitches outside the strike zone
Z-Swing % – Percentage of time a batter swings on pitches inside the strike zone
Swing % – Percentage of time a batter swings at a pitch, regardless of location
O-Contact % – Percentage of times a batter makes contact with a ball when swinging outside of the strike zone
Z-Contact % – Percentage of times a batter makes contact with a ball when swinging inside of the strike zone
Contact % – Percentage of times a batter makes contact with the ball when swinging
Zone % – Percentage of overall pitches thrown to batter that were in the strike zone

There is nothing noteworthy about his swing percentages as they are all just about equal to the league averages, but the contact percentages are quite alarming.  Through his first nine games, Goeddel only made contact 53% of the time he swung his bat.  Rather than just writing this off as a rookie being over-matched by big league pitching, I decided to dig deeper into these stats and figure out exactly where Goeddel was struggling.  Check out the video below that I put together which basically sums up the beginning of Goeddel’s career in 30 seconds:

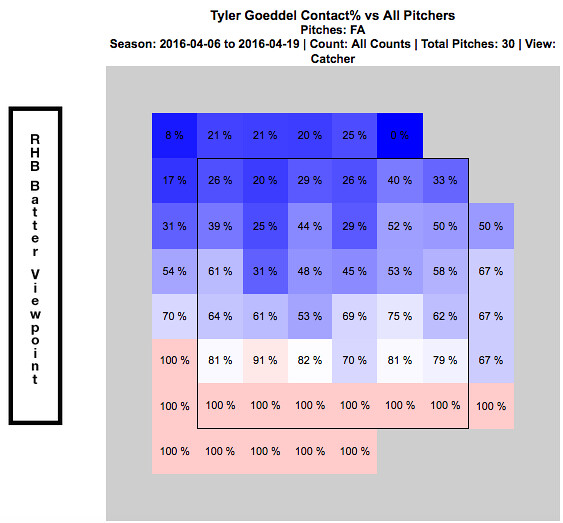
Whether or not you realized from watching the above video, every one of these swing and misses came on a fastball.  They all also came in the upper portion of the strike zone.  Just by watching Goeddel’s at-bats through this point of the season, it was clear as day to see opposing pitchers were attacking Goeddel with fastballs up in the zone.  The chart below shows every fastball that was thrown to Goeddel over his first nine games.  It is broken up by hot and cold zones and shows his contact percentage versus the fastball at every portion of the strike zone:

4:6 - 4:19 Contact % vs Fastball

This chart verifies for us what we saw in the video…Goeddel really struggled to hit fastballs up in the zone to begin the season.  At this point, everyone was frustrated.  Tyler Goeddel was frustrated because he knew he was much more talented than his results thus far have showed.  The Phillies organization was frustrated because they had such high hopes for Goeddel entering the season.  And most importantly, the Phillies fans were frustrated and began questioning what the Phillies could possibly see in this guy.  (Search for Tyler Goeddel’s name on Twitter and read old tweets from this time period if you don’t believe me!!)

An important thing to remember while looking at these stats, is that up until this point of his career Goeddel has been an every-day player.  Not only is he adjusting to big league pitching, but he is also trying to adjust to not having consistent at-bats.  Since the Phillies unexpectedly got off to such a hot start, an important decision needed to be made.  On one hand, they have this young promising player who will need consistent at bats in order to show his true potential.  But on the other hand, this team is surprisingly in the hunt in the NL East and may not want to allow Goeddel to go through his growing pains while they are competing for the division title.  Eventually, a decision was made and manager Pete Mackanin started to put Goeddel in the every-day lineup. Below are some quotes from Goeddel at this time speaking of the decision:

“Getting regular playing time and the confidence [from that] is huge, but I try to get started a little earlier on my swing so I can be on time with the fastball. You need to hit the fastball if you want to play up here, obviously. I feel like I’ve made that adjustment and it’s been a huge help.” – Tyler Goeddel

“I didn’t play how I wanted to play in April.  And I’m glad he’s (Pete Mackanin) giving me a chance, because I really didn’t play my way into a chance; he just gave it to me. So I’m trying to make the most of it.” – Tyler Goeddel

The video below (from 4/23/16) summarizes Goeddel’s early season struggles and the decision to give him more playing time:

The Phillies coaching staff deserves a lot of credit.  They recognized early on that Goeddel was struggling with fastballs up in the zone and prior to this game really worked with him in that area and promised him more playing time moving forward.  Here is a video of his next at bat in the game, where the pitcher tries once again to attack Goeddel with some high heat:

Goeddel responds with another base hit and his first RBI of the season.  Take a look below at how his stats over his next seven games compare to his stats from his first nine games.

4:23 - 5:6 Stats

4:23 - 5:6 Contact %

You can very easily see that Goeddel drastically improved his contact percentage over this time frame, which resulted in a huge drop in his strikeout rate.  The video below is from 5/8/16, right after the stretch of stats we just evaluated.  Goeddel had a big hit late to tie the game for the Phillies and later came in to score the winning run.

As you could see, the hit came on a high fastball.  A few weeks ago, Goeddel could not touch this pitch…but all of a sudden he is beginning to prove that he can.  The next video is from after that game.  Tyler discusses the adjustments he has made and also how playing every day has contributed to his recent success:

This hit was the start of a new Tyler Goeddel.  Pitchers continued to attack him with fastballs up in the zone and Goeddel really started to make them pay.  This is what he did to a Brandon Finnegan fastball just a few days later:

Ever since that hit on May 8th against the Marlins, Goeddel has been the player the Phillies could have only hoped he one day would become.  He has flashed signs of brilliance in just about every game since that have Phillies fans drooling over what the future outfield could look like.  Even though he has made adjustments and is seemingly now catching up to big league fastballs, opposing pitchers continue to test him.  Check out the video below that I put together showing what Goeddel has done to fastballs in the upper portion of the strike zone over the last few weeks.

As you can clearly see, this is a different player than we saw early on in the season.  Take a look at how his recent stats compare to those early on:

5:6-5:20 Stats

5:6-5:20 Contact %

Goeddel’s contact percentage over his first nine games was only 53%.  Over his last 10 games, it is 91%.  That is an incredible difference and clearly his adjustments are paying off.  In turn, his improved contact has led to a strikeout percentage of only 5.4% over his last 10 games.  The chart below shows how Goeddel has fared against the fastball since he noted his adjustments on April 23, 2016.

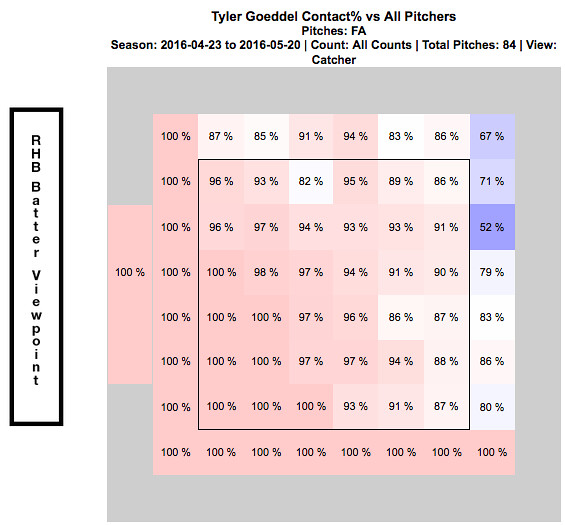
4:23 - 5:20 Contact % vs Fastball

Now go back up to the top of the article and compare this chart to what it looked like at the beginning of the season.  More consistent at bats have clearly translated into him catching up to the fastball and the results thus far have been phenomenal.  I have to admit that I was a doubter early on, but I am now completely on board the Tyler Goeddel bandwagon.  This kid is only 23 years old and the fact that he was able to so quickly make an adjustment like this and immediately see results is remarkable.  Now that he is having some success, opposing pitchers will start to change their game-plan against him.  While the pace he is on now may not be sustainable over the course of a full season, I am confident that Goeddel will continue to make the necessary adjustments and help this Phillies team continue to find ways to win ball games.  Although the video below doesn’t exactly relate to his success at the plate, I had to throw this in here and it is a must watch if you have not seen it already:

The last video I will show features Goeddel’s post game interview after this throw:

Recent Quotes:

“It’s exciting.  Coming to the field everyday I’m expecting to see myself in the lineup. That’s a feeling I didn’t have last month. It’s a lot more relaxing, less stressful.” – Tyler Goeddel

“It was definitely a big adjustment, going from playing everyday my whole career to having a specific role, and then not performing well in my role, it was a little tough.  But, you know, they’re giving me an opportunity now and I feel like I’m playing better, which is nice. I’m happy for myself. I always knew I could play up here, but I needed some results to prove it to myself. I’m glad, finally, there are some results to show.” – Tyler Goeddel

I love how confident Goeddel is when he speaks of his game and I am so glad the numbers back him up.  I continue to be blown away watching him play every day, especially due to the fact that he has only been playing the outfield for one year.

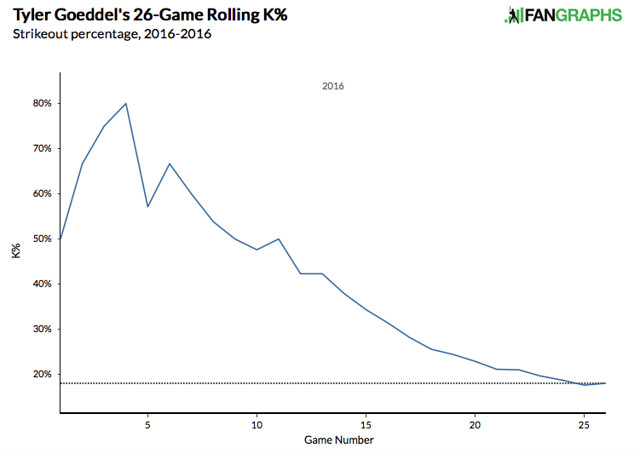
Lastly, I want to show a few graphs.  The first one shows a rolling total of Goeddel’s strike out percentage so far this season.  The statistics earlier show you that it has decreased, but this graph makes it much easier to see his progression:

Rolling K%

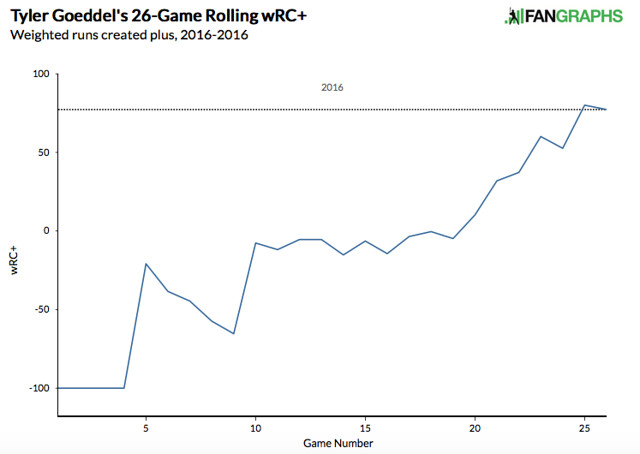
The next graph is another rolling total showing how Goeddel’s wRC+ has progressed throughout the season.  For those of you who are unfamiliar with the stat, wRC+ stands for weighted runs created plus.  It attempts to quantify a player’s offensive value in terms of runs.  An average wRC+ is 100.  Check out how Goeddel’s wRC+ has improved throughout the season:

Rolling WRC+

What do you think, Phillies fans?  Can Tyler Goeddel keep this up?  Is the Tyler Goeddel that we have seen over the last few weeks the real Tyler Goeddel?  Are you ready to hop on the bandwagon yet or do you need to see more from him to believe?  Only time will tell, but I’m buying into the hype and am excited to see what the future holds for this promising young player.

Twitter – @mtamburri922