Author Archive

Exploring Uncharted Territory with Leonys Martin

Edit: Since this piece was submitted (May 23), several developments in the Martin narrative have arisen, notably some more astute analyses than mine (namely Jeff Sullivan’s great piece on Martin’s batted-ball profile & an extremely in-depth look at his swing mechanics by Jason Churchill over at ProspectInsider, do go check him out) as well as this walk-off dinger against the Oakland A’s. 


A lot has gone right for the Seattle Mariners in new GM Jerry Dipoto’s first season. At time of writing, they sit in first place in the AL West with the third-best record in the American League and the best road record in baseball. One potential factor in Seattle’s success that has, until recently, taken a backseat to Robinson Canó‘s resurgence and Dae-Ho Lee’s power-hitting heroics is the sudden onset of what could turn out to be an offensive breakthrough for outfielder Leonys Martin.

The Mariners’ acquisition of Martin and Anthony Bass in exchange for Tom Wilhelmsen, James Jones, and a PTBNL (Patrick Kivlehan) is one of several moves last offseason that seem to follow a common guiding principle: bring in players who’ve struggled in recent seasons but demonstrated real value in seasons past. This category includes the likes of Steve Cishek and Chris Iannetta, both of whom seem to have (thus far) rebounded from uninspiring 2015 campaigns.

Meanwhile, Leonys Martin is having the best season of his life. This is mostly remarkable due to the fact that his hitting isn’t, and has never really been, the source of his value. He’s never topped 89 wRC+ in any season, and his career high for home runs in a year is eight. He’s also been historically abysmal against left-handed pitching. From 2012-15, Martin slashed .233/.274/.298 with 53 wRC+ against southpaws; no outfielder in baseball posted fewer wRC+ in that same span (min. 300 PAs). His poor performance in the second half of 2015 (.190/.260/.190 with 22 wRC+ after the All-Star break) earned him a demotion in early August. That lackluster second half, coupled with the emergence of Delino Deshields Jr. as a capable replacement, made it a lot easier for the Rangers to part with him in the offseason (incidentally, DeShields was demoted in early May and Wilhelmsen has been the worst reliever in the majors this year by fWAR, so that’s something).

Going into this season, Steamer projected him for around 492 PA with a .241/.292/.350 slash line and 79 wRC+, in addition to eight homers and 22 stolen bases, putting him on course for 1.2 fWAR. While not exceptional, this likely would have been an adequate season for Jerry Dipoto given the cost, especially at Martin’s $4,150,000 salary, but Martin’s already managed to match that mark, posting 1.4 fWAR as of May 23rd, and he’s providing a great deal of that value with his bat.

Martin seems to have shook off a bit of whatever seemed to be plaguing him at the tail end of 2015. He’s slashing .252/.331/.467, which would, over a full season, leave him with a career-best OPS of .798 and 124 wRC+. He still hasn’t been able to hit lefties, but that’s what platooning is for. But by far the most eye-popping aspect of Martin’s game this year is what looks like a sudden influx of power. Martin’s mark of .215 ISO is easily the best of his career — his eight home runs have already matched his career-best single-season total — and it’s not even June yet. With no context, one could look at Martin’s line thus far and notice that he might be on pace to post a 30 HR/30 SB season, if not for the slight inconvenience called “At No Point In His Career Has Martin Demonstrated That He Might Even Touch 30/30”. And yet this is baseball, and this is 2016, the Year of the Bartolo Colón Home Run. Anything is possible.

So — what’s changed for Martin? And perhaps more importantly, where the heck did all these home runs come from?

We turn first to Martin’s batted-ball profile. For the last two-and-some seasons, Martin’s fly-ball percentage has actually increased. His 2015 mark of 33% was actually a career-best at the time, especially considering it was brought down by his abysmal second half. He’s picked it back up in 2016, with a gaudy 45% fly-ball rate. Of course, the sustainability of this figure is questionable (one might also point out Martin’s likely inflated HR/FB rate of 20.5% — opposed to a current league average of 12.1%), but at no point in his career has Martin hit fly balls with such consistency:

Other indicators of improved power add credence to this positive trend. Martin’s quality of contact also seems to have improved this year, as his hard-hit ball rate of 34.4% is vastly superior to his pre-2016 range of about 23 – 25%. It’s also true that home/road splits affect the narrative somewhat, as only one of his eight home runs occurred at Safeco Field. But I suspect that there may be more to Martin’s offensive resurgence than just hitting balls harder.

One of the feel-good narratives of this season is the positive influence that new hitting coach Edgar Martínez has introduced to the Mariners offense, which currently ranks 2nd in the AL in runs scored. Martinez was brought in to replace Howard Johnson in June 2015, hoping to fix an anemic Mariners offense that struggled early and often. To date, that new appointment has been received with praise from Seattle media and fans, but more importantly from the players themselves. Could it perhaps be the case that Edgar’s tutelage, along with Jerry Dipoto’s promise to mold the 2016 Mariners to fit his “Control the Zone” philosophy, has brought about a positive change in the way Leonys Martin approaches hitting?

Overall, Martin’s plate discipline metrics show that his approach at the plate hasn’t changed too drastically from last season. If anything, his 70.4% contact rate is his lowest since 2012. One other thing sticks out here, namely that Martin seems to be more patient on pitches out of the zone and more aggressive on pitches in the zone. Compare the percentage of pitches he swings at in 2015 (left) to 2016 (right), courtesy of BrooksBaseball.net:

There is a relatively noticeable difference here, especially on high and outside pitches. According to PITCHf/x, his O-Swing% of 27.9 is easily the lowest of his career. Likewise, his Z-Swing% of 67.0 is his highest since 2012. These are generally good indicators that Martin is seeing the ball better or, at least, cut down on his tendency to chase pitches out of the zone.

And then there’s the matter of his batting stance.

Take a look at his stance for this home run on May 27, 2015, facing off against Scott Atchison:

Now check out his stance almost a year later, on May 22, 2016 in this at-bat against John Lamb.

An important thing to note about these stills is that I picked them mostly because of their similar camera angles. Martin’s foot position in other highlights is often obscured by the pitcher, or the pitcher is already in the middle of his wind-up, giving Martin time to square up before the pitcher’s delivery (as is slightly apparent in the at-bat against Lamb). But the vast majority of video evidence from this season is consistent with the idea that Martin has generally closed off his stance and now begins pretty much every at-bat with his feet squared to the pitcher. Now, I am aware that the batting stance is a rather fluid component of any baseball player’s oeuvre and can change for a number of reasons, not all of them being deliberately engineered to improve performance. I can’t seem to find anything about Martin having changed his stance online, aside from this ESPN piece from February of this year — but the focus of that article is on a legal issue Martin dealt with over the offseason, and the only comments offered on Martin’s approach seem to indicate that his stance hadn’t actually changed:

Martin also worked with a hitting instructor during the offseason in Miami. He altered his approach at the plate — his stance remains the same, he said — and he was pleased with the results when he faced pitchers in winter ball.

The most significant changes I’ve noticed as a result of comparing film from 2015 to film from 2016 are the aforementioned foot positioning and the fact that his hands are a little bit closer to his body this year. Generally speaking, though, it’s hard to really quantify the connection between a player’s stance and his performance. If this change in stance is deliberate, we can only really speculate as to the reasoning behind it. There are certainly good reasons to make the adjustments Martin has made. Bringing the hands closer to the body is often a nice starting point for a player who wants to make his swing a little more compact and less erratic. As for the foot positioning, there are a few benefits to batting with an open stance, especially for a left-handed hitter. One is that it enables left-handed hitters to see the ball better, especially when facing a left-handed pitcher. Another is that it eliminates the problem of the front foot stepping away from the plate on the swing, as batting from an open stance requires you to bring your front foot towards the plate in order to square up to hit the ball. It’s hard to say if Martin has previously had this issue in the past, but the fact that he’s changed from an open stance to a square stance likely indicates to me that whatever advantage he gained from an open stance may no longer be necessary. We don’t know if Martin has made these adjustments for the reasons listed above or if he has made them for any real reason at all, but he’s still made them all the same, and as it happens, they’ve been working out quite nicely for him.

That said, let’s not go overboard about a quarter-season of statistics just yet. Though Martin is posting career bests in almost any meaningful batting metric, there is still reason to believe he might still turn out to be an average or below-average hitter for the rest of the season. His on-base record is rather inflated by recent performances, he strikes out too much, and he continues to sport uninspiring numbers against left-handed pitching. All the same, his eight home runs this season aren’t going away, even if his fly-ball rate might. It’s unlikely, barring injury, that he’s not going to hit any more home runs for the rest of the year, so 2016 will most likely be a career year for him in the power department, and if his BABIP mark of .302 this year can regress back to his 2013-14 average of .326 rather than his poor 2015 mark of .270, 2016 may turn out to be a career year for him across the board. Martin’s offensive production has certainly been a pleasant surprise for the Mariners, and it would be interesting to know if altering his batting stance was a deliberate factor in producing an improved approach at the plate. If the Leonys Martin we’ve seen so far this year is anything like the Leonys Martin we’re going to see for the rest of the year, Jerry Dipoto may have stumbled upon a surprisingly high return on what was initially a low principal investment.

Austin Jackson’s Bothersome Batted-Ball Bind

On July 30, 2014, the Seattle Mariners found themselves in the interesting position of being in playoff contention. The Mariners sported a 32-23 record, only 2.5 games back of the AL West-leading Los Angeles Angels, and owned the third-best Pythagorean record in the American League. Seattle’s newfound position as postseason hopefuls meant that they were suddenly buyers at the trade deadline – not drastically so, but in the sense that the Mariners were only a couple of upgrades away from assembling themselves a nicely well-rounded playoffs roster. Chief among these desired upgrades was a serviceable everyday center fielder, one who could replace a revolving door of below-average outfielders that included Abraham Almonte, James Jones, Stefen Romero, and Endy Chavez.

Jack Zduriencik sought to remedy the Mariners’ outfield issues with a pair of trade deadline deals. The first involved packaging Almonte and minor-league pitcher Stephen Kohlscheen to the Padres in return for Chris Denorfia, a rather unsexy deal to be sure, but one that was a success at the time in that the acquired player was not Almonte. The second deal, a three-way transaction between the Rays, Tigers, and Mariners, was collectively more sexy, but a large share of the sexy went to the Tigers, who landed Rays ace David Price. The other major components of the deal were the Rays’ acquisition of young Mariners middle infielder Nick Franklin and Tigers pitcher Drew Smyly, as well as Seattle’s prospective answer to its outfield problem: Detroit center fielder Austin Jackson.

Since his move to the Mariners, Jackson has racked up 277 plate appearances for Seattle, and the results have been fantastically underwhelming. Of the center fielders who amassed more than 100 plate appearances for the Mariners in 2014 – an uninspiring triumvirate of Jackson, Abraham Almonte, and James Jones – Jackson produced the worst offensive performance by wRC+. Jackson’s 2014 performance also disappointed even by more conventional measures:

  • Jackson totaled 34 extra-base hits in 416 plate appearances for the Tigers in 2014. For the rest of the year, in 240 plate appearances for the Mariners, Jackson managed 6.
  • Jackson’s ISO dropped from .127 to a paltry .031 with the move from Detroit to Seattle.
  • Jackson’s 2014 OBP/SLG/wOBA with Detroit: .330/.397/.321. With Seattle: .271/.264/.243.

Not great for a player only two seasons removed from a 5-win campaign.

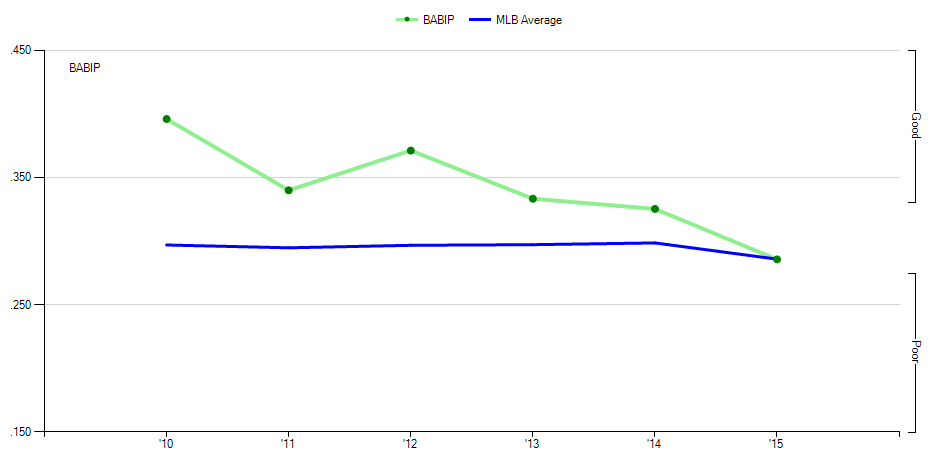
Ostensibly, something was fundamentally different with Jackson in 2014, something that can hopefully be determined by closely examining his recent performance. Looking first to Jackson’s approach, it seems that there hasn’t been too much change over the course of his career. His K/BB ratio has generally hovered around league average and his contact rates haven’t fluctuated all that much from year-to-year. If anything, Jackson’s approach metrics look like they’re trending positively – he actually posted career bests in Z-contact% and SwStr% in 2014. If we examine Jackson’s batted ball data, however, we begin to get a little closer to the root of Jackson’s troubles of late. The most easily identifiable aspect of Jackson’s game can be somewhat distilled in the following graphic:

Over the course of his career, Jackson’s BABIP has been way above league average. He managed an absolutely ridiculous .396 BABIP in his 2010 rookie season over 675 PA, and his career-best 2012 season, in which he posted a 134 wRC+, was bolstered by a BABIP of .371. That figure would predictably fall after 2012, but between 2013 & 2014, Jackson’s BABIP only declined by .008, whereas in the same period, his wOBA fell from a very good .332 to a mediocre .292. This might suggest that in 2014 specifically, it may not have been the frequency with which Jackson was able to put balls in play so much as the quality of those batted balls that limited Jackson’s production.

Unfortunately, batted ball data is out of the scope of my access. The closest I can get to Jackson’s batted-ball profile is  by pulling data from this pre-season piece on Jackson by Jake Mailhot over at Lookout Landing, and indirectly from Jeff Zimmerman’s work on hitter analytics at RotoGraphs (the relevant batted-ball spreadsheet now seems to be unavailable for some reason).

To quickly explain – this table charts batted-ball rates expressed as a percentage of league average. Batted balls are separated into three categories (line drive, groundball, fly ball) which are then further divided into subcategories of contact quality (Well-Hit, Medium, and Weakly-hit). These categories are ordered left-to-right from highest to lowest based on xBABIP.

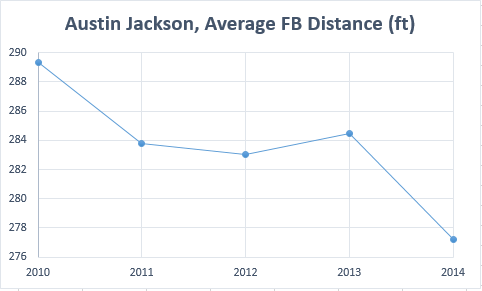
Mailhot astutely notes an alarming drop in well-hit groundball rate – from 64% above league average in 2012 to 11% below league average in 2014. This is accompanied by a commensurate rise in weakly-hit groundballs. Jackson’s well-hit line-drive rate also drops by a sizable amount, hovering around league average in 2014, while his rate of medium-hit line drives balloons to 198% of league average in 2014. Mailhot also points out possibly the most substantial shift: an immense drop-off in well-hit fly-ball rate in 2014 to 56% of league average, a trend corroborated by data pulled from Baseball Heat Maps on Jackson’s average fly ball distance over his career:

Jackson’s high rate of well-hit line drives and ground balls prior to 2014 puts into perspective the aspects of his game that brought him success earlier on in his career, and his sharp decline in those metrics in 2014 even more so. To put it in exceedingly simple terms, Austin Jackson just didn’t really hit balls hard in 2014, something he was quite good at doing before that season. Judging by the splits, most of the not-hitting-balls-hard occurred after the move to Seattle.

Jackson’s 2013 was much better than his 2014, but it is the beginning of a short trend of BABIP decline. From examining batted-ball data, we can infer that quality of contact has a significant bearing on BABIP, and this makes sense using conventional logic as well. Hard-hit line ground balls are more likely to find gaps between defenders, hard-hit line drives are more likely to drop in for hits, and hard-hit fly balls are more likely to turn into extra-base hits (although BABIP ignores home runs). The easy explanation is that Jackson lost some power in 2014. I don’t have enough film on Jackson to know for sure if there’s a visually concrete reason for this (if, for example, there’s something off in his swing mechanics), but data from 2014 indicates that Jackson just hasn’t been making good contact.

Jackson’s issues are probably best explained by his batted-ball troubles, but park factors likely play some part as well, with Comerica Park being relatively more hitter-friendly than Safeco Field. Safeco’s pitcher-friendly park factor and the ‘dead ball effect’ of Seattle’s marine air probably have something to do with Jackson’s decline in fly-ball distance, although Jackson is himself contributing to that same decline in some measure.

At the time of his acquisition, a merely average performance from Jackson would have been a significant upgrade over the convoluted mishmash that had previously taken the field for the Mariners. Unfortunately, he was unable to even provide replacement-value production after coming to Seattle, totaling -0.4 wins above replacement in 2014. The Mariners traded for an above-average player and received the production level of a player who theoretically wouldn’t cut it in the big leagues altogether.

The prospect of 2015 being a bounceback year for Jackson has not gone over too well in these first few weeks. ZiPS (R) and Steamer (R) still think Jackson could manage 1.7-2.1 WAR on the season, which is a bit below his peak, but I think the Mariners would take that statline in a heartbeat. I’ve gone this far without mentioning Jackson’s other tools, but as a 28-year-old without a concerning injury history, there’s not as much reason to worry about his defense and baserunning as there is to worry about his offensive output. Jackson was a below-average defender by UZR in 2013/2014 and has been worth approximately 4 baserunning runs above replacement in each of the past couple of years, neither of which have dictated his value nearly as much as his offense, or lack thereof. Using those numbers as a serious predictive measure from year-to-year is simply not very useful at this point.

Lloyd McClendon was Jackson’s hitting coach back in Detroit, and suffice it to say he probably has a better grasp on Jackson’s habits as a batter than most. If anyone’s able to get Jackson back on track this season, it’s probably McClendon. At time of writing (the 18th of April), Jackson managed a slightly encouraging 2-hit, 1-walk performance against the Rangers. It’s early yet in the season, and there’s time for Jackson to hopefully figure things out. Alternatively, if Jackson can’t find some of his pre-2014 form this season, the Mariners might once again find themselves in the same trade deadline predicament from last year – only this time, there’s not an obvious trade chip à la Nick Franklin. Then again, 2015 is Jackson’s last year under team control, so the Mariners may simply choose to let him walk after the year is over if they’re not satisfied with his performance. If that’s the case, it’s hard to imagine looking back on the 2014 Jackson trade with anything but the same tinge of regret and frustration that has colored so many other Mariners transactions of the last decade.


A Primitive Call for a Sabermetric Foray Out of the US

Advanced metrics in baseball have by and large proven useful for the evaluation of players and teams in the American pyramid of professional baseball, generally comprised of Major League Baseball franchises and their minor-league affiliates. This means that at least in the mainstream sabermetrics community, the vast majority of work in advanced analytics has taken place within the borders of the United States. It’s no secret, however, that MLB franchises have vast scouting networks all across the globe – baseball has always been a sport with tons of growth potential, and especially over the last half-century, MLB has imported talent from an incredible geographic range. Teams have long-running infrastructure for scouting, acquiring, and developing young players from other nations – a trend which is almost certainly guaranteed to continue in the future.

Major League teams with their own analytics departments no doubt have a wealth of resources for the evaluation of foreign talent, but for the average sabermetrician who does not have access to baseball academies in Latin and Central America or who can’t regularly view other professional leagues in countries like Korea, Japan or Taiwan, the requisite data are hard to come by. Baseball-Reference has a wealth of information on other leagues such as Nippon Professional Baseball, but only relatively traditional statistics are available, limiting the extent to which those who aren’t involved with professional organizations can observe and interpret those figures.

It’s easy to look up anyone’s batting average with RISP in NPB, but we’ve not yet arrived at a point where we (we being a fan of modest statistical background with access to free data on the internet) have been able to easily produce, say, a run expectancy table, or calculate a replacement level, for a non-MLB league without much more effort than should be necessary. At the very least, we can derive the most basic of metrics – here I’ve compiled a list of last year’s  Nippon Professional Baseball leaders and calculated FIP (min. 48 IP), which thankfully wasn’t at all difficult to do because the statistics necessary to calculate FIP are simple and easily available. It’s not as if it’s impossible to achieve the level of analytical proficiency with NPB that we have with MLB, it just hasn’t happened yet.

There’s logical explanations for this, but given the data available to us, it should only be a matter of time before sabermetrics begin to thrive outside of the United States for amateur statisticians and professional sports organizations alike. I would venture that there’s definitely a growing interest in international baseball from the American fan community; personally, I’m all for a sweeping movement in statistical analysis for international baseball leagues – not just to find the next Masahiro Tanaka or José Abreu, but with a real vested interest in other incarnations of America’s national pastime. We’re a long way from it, but it’s not out of the question to imagine an international baseball dynamic where fans follow the NPB with the the same fervor of an American soccer fan who might support a club in the English Premier League or the German Bundesliga. In that hypothetical scenario, sabermetric analysis is thriving, and most importantly, it’s thriving just as much outside the MLB as in it.


A Decade of DH: The Mariners Post-Edgar Martínez

Edgar Martínez is kind of a demigod in Seattle. If you drive west past Safeco Field, parallel to the first-base line, you’re doing so on Edgar Martínez Drive (hang a right at home plate and you’re on Dave Niehaus Way).

He’s the only one of the franchise’s most celebrated players, besides hopefully Felix, to have spent his entire career with the Mariners organization, something Ken Griffey Jr. and Ichiro can’t lay claim to. His game-winning double in the 1995 ALDS is the Seattle Sports Moment to many, and it was just a quarterfinal, Super Bowl/’79 NBA Finals/1917 Stanley Cup be damned.

He’s also the greatest designated hitter of all time, and if not the greatest (which he is, in a completely objective manner of speaking untainted by my personal preferences) the player who perfectly typifies the designated hitter position. For years he has been the barometer of the DH, the mark by which all who came before and all who shall come after will be evaluated – Frank Thomas and Jim Thome weren’t purebred designated hitters the way Edgar was. Although Edgar won his first batting title playing third base, a hamstring injury relegated him to the DH role, so he was the only one of the three to primarily play designated hitter for most of his career, unlike Thomas and Thome, who spent much more time in the field. Also, Frank Thomas was an absolutely filthy pitcher in Backyard Baseball 2003, as well as complete garbage as a hitter in that very same game, so don’t you tell me that designated “hitter” is his primary position.

seriously this makes no sense

But whatever Edgar Martínez meant to the DH position went tenfold for the Mariners. For me Edgar’s retirement was in a way the turning of a page for the franchise, but his loss as a Mariners icon could ostensibly be counteracted somewhat by roster stalwarts Ichiro, Dan Wilson, Bret Boone, and Jamie Moyer (duh), among others.

What would change almost irreparably was the Seattle Mariners’ designated hitter slot that Martínez vacated when he retired.

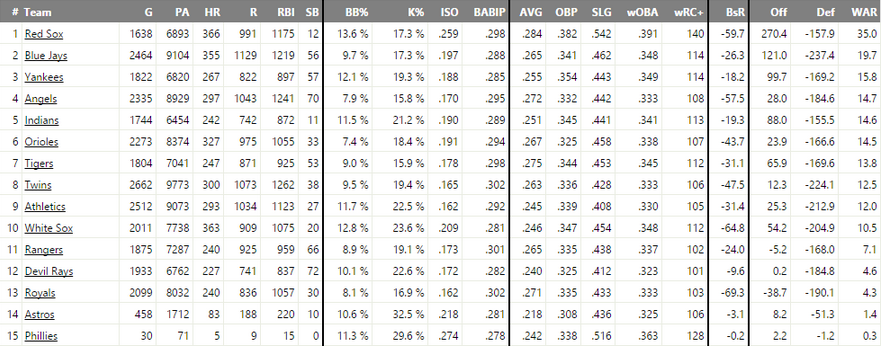
2015 marks the Mariners’ eleventh season since Martínez’s retirement, meaning that a full decade has passed in the majors without Edgar on the Mariners. The first step in our journey into an Edgar-less world begins with a ranking of cumulative fWAR at the DH position by team from 2005 (the Mariners’ first season without Martínez) to 2014.


The first thing you’ll notice seems pretty intuitive, which is that the top 15 teams are all American League teams – this obviously makes sense because the DH rule is only applicable in the American League, so it would logically follow that the fifteen American League teams would have accrued the most Wins Above Replacement in the major leag-

wait, hold up – philadelphia????????

where are the mariners

um

ok

lemme just scroll down to find them, one sec

..

….

…………

uhhhhhhhhhhhh

So Mariners designated hitters rank 27th, which means that between the Mariners and the Astros, twelve – TWELVE National League teams, who only employ a designated hitter for a handful of games per season (interleague away games to be exact), have produced more fWAR at that position over the last decade than the Mariners, who use a designated hitter on pretty much a daily basis.

In fairness, the explanation for this seems logical: the defensive fWAR penalty for the designated hitter position (the highest of any defensive position) is cumulative – it increases with the amount of innings played at any given position. The Mariners have accrued ungodly of amounts value above below replacement by trotting out consistently bad DH production, whereas the magnitude of damage a National League DH can do to his team’s aggregate replacement value is limited by sample size. Something that I don’t completely understand is that FanGraphs’ data on National League players DHing seems to be incomplete, but maybe it just has something to do with eligibility not lining up with FanGraphs data or the fact the sample size of National League DHs is inadequte. Perhaps having all National League DHs accounted for just wouldn’t be worth the effort or be statistically significant.

Even if we remove the National League from the equation, the Mariners are still dead last in their own league by quite a bit. The next-worst team, Houston, has been in the American League for all of two full seasons and has managed to comfortably outpace Seattle (upon further examination this is made more impressive by the fact that one of those seasons, Chris Carter’s 37-dinger campaign in 2014, doubles Seattle’s cumulative fWAR over the entire decade in magnitude). But then again as stated before, Seattle have incurred a penalty for having adhered to the DH rule since its inception, whereas Houston have only had two seasons to let the DH penalty pile up.

In order to ascertain exactly what shenanigans could have gone down with the M’s DH position such that all Seattle DHs from 2005-2014 collectively managed to produce fewer wins than Edgar’s farewell 2004 season (his worst by fWAR, totaling -0.5), here’s a fond look back at some of the Mariners’ highlights at DH over the past decade (min. 100 PA), ordered by total fWAR produced for the Mariners.

1. Russell Branyan, 2009 & 2010, 125 wRC+, 3.4 fWAR

FanGraphs lists Branyan first in highest total accumulated fWAR post-Martínez for any Seattle DH, which makes sense, because his 2009 116-game stint with the Mariners was quite good-until you realize that he played all of those games for the Mariners at first base, meaning that 2.7 wins of these 3.4 weren’t even put up from the designated hitter slot. Fun fact: Branyan’s 2009 season, in which he swatted 31 homers and posted 126 wRC+, is the only season since 2006 in which a Mariners player has hit 30 homers (2013 Ibañez missed this mark by just one home run).

On the bright side, Branyan returned to the Mariners via trade in June of 2010, and this time he actually put in some time at DH. He managed to do quite well for himself, with 121 wRC+ in 238 plate appearances, and 25 of his 44 hits went for extra bases. After a couple 2011 stints with Arizona and Los Angeles, he then decided that playing for Seattle had ruined the major leagues for him and went on to play only in minor-league and Mexican league games for the rest of his career.

2. John Jaso, 2012, 143 wRC+, 2.6 fWAR

Jaso shared catching and DH duties with Jesus Montero in 2012, and in only 108 games became the second-most valuable position player on the team by fWAR behind Kyle Seager. Jaso also had the third-highest walk of rate of any position player in baseball (min. 350 PA) in 2012 and was Felix Hérnandez’s batterymate for his perfect game against the Tampa Bay Rays.

The Mariners then infamously dealt Jaso to division rival Oakland in a three-team deal that yielded a return of Michael Morse, former Mariner just coming off a career year with Washington in 2011. Morse played half of the 2013 season before injury caught up to him and he was shipped off to Baltimore.

Jack Z could lead the Mariners to 4 consecutive titles and be the executive of the year each of those years and Mariners fans (myself included) would probably still find time to complain about the Jaso-Morse Trade for some reason. Jaso is currently back with Tampa Bay and is currently injured, but his 2013 and 2014 seasons were still much better collectively than what the Mariners fielded during that same time period.

3. Mike Sweeney, 2009-10, 111 wRC+, 0.7 fWAR 

At the same time Russell Branyan was busy dirtying himself in the field and hitting big hits, the Mariners extended 2 non-roster invites in 2 consecutive years to great Royals player, great hitter, and great all-around guy Mike Sweeney (who doesn’t have a picture on his Wikipedia profile, but Yuniesky Betancourt does….?). Making the team both times, Sweeney was a productive hitter for the Mariners in 2009 and 2010 and was traded to the Phillies, they of the 15th-ranked DH fWAR, in time for the NLDS, where he was able to collect a hit in his first and only postseason at-bat (against Aroldis Chapman, no less). He then signed a one-day contract to retire a Royal. It’s nice to feel good about something tangentially Mariners-related every once in a while, especially because after we move past Sweeney on this list things start to get a little dicey.

4. Kendrys Morales, 2013 & 2014, 108 wRC+, 0.2 fWAR

Morales was one of the better hitters on a largely uninspiring 2013 Mariners team, boasting a .342 wOBA and a 119+ wRC, both of which would have led the team if not for an incredibly strange Raul Ibañez season. The Twins signed Morales as a free agent the following offseason for $7.6 million, which was kind of strange but made sense if they could turn that value into something. It turns out that something was the Mariners’ Stephen Pryor, and Morales ended up back in Seattle, where he had effectively iced his chances of cashing in on a qualifying offer from the Mariners a year ago. In 2014, Morales put up -0.8 fWAR for Minnesota and -1.0 fWAR for Seattle, by far the worst year of his career.

5. Jack Cust, 2011,  97 wRC+, -0.1 fWAR

A profile of Jack Cust came up on the Jumbotron at Safeco Field once while I was in attendance at a Mariners home game, in which he stated that his favorite quote was “play hard”, a nugget of wisdom Cust attributed to himself. The combination of that Jumbotron quote and Cust’s .116 ISO for the Mariners in 2011 continues to be one of the more perplexing relationships I’ve observed to date, as is the 97 wRC+ (Cust’s wRC on the season was 20).

6. Jose Vidro, 2007-08, 94 wRC+, -0.2 fWAR

Vidro, who leads the players on this list in plate appearances with 955, spent almost two seasons with the Mariners (2007 & 2008). His 2007 season with Seattle wasn’t bad – his .775 OPS was just above league average, his 10.1 BB% was just above league average, and his .345 wOBA was just above league average. Vidro decided to use 2008 to erase most of the solid work he had done in the previous year, cutting his walks in half, getting on base 70% as often, and found himself designated for assignment and later released that summer.

7. Greg Dobbs, 2004-06, 74 wRC+, -0.3 WAR

Dobbs didn’t really play enough to be remembered as outright terrible, usually taking backup duty at third base and then being relegated to a pinch-hitting/DH role in 2005/2006. Before we move on, there’s a couple interesting notes about Dobbs.

First, Greg Dobbs hit a home run in his first at-bat with the Mariners (and his first major league at-bat), which would turn out to be the only home run he would hit in 2004. This isn’t particularly notable except for the fact that it always reminds me that Miguel Olivo also homered in his first major league at-bat, which I will never forget for some incredibly frustrating reason. “Miguel Olivo homered in his first major league at-bat. He was with the Chicago White Sox and the home run was off Andy Pettitte”. This useless piece of information has been wasting my neural capacity ever since I read it on some Mariners gameday program, which I think had Richie Sexson on the cover, so I’m jointly blaming Sexson and Olivo both for forcing me to remember that information and also for being pretty underwhelming with the Mariners.

The second thing is Dobbs’ 2006 season, in which he was only around for 28 PA in 23 games, 18 of which he came in as a pinch-hitter. In those games he managed 150 wRC+ on a cool .435 BABIP. He also walked 0 times. Ultimately it was only 28 PA, an absurdly silly sample size, and clearly the Mariners felt similarly, because they waived out of him in 2007, whereupon Pat Gillick, now with the Phillies, decided to take a second chance on Dobbs long enough for him to earn a World Series ring in 2008.

8. Jeff Clement, 2006-09, 90 wRC+, -0.3 fWAR

Yeah, let’s just not go there.

9. Milton Bradley, 2010-11, 83 wRC+, -0.5 fWAR

Bradley contributed -0.5 fWAR in his time with the Mariners and interestingly enough, being bad at baseball may have been one of the better things he did in Seattle.

10. Carl Everett, 2006, 72 wRC+, -0.8 WAR

Carl Everett was a two-time All-Star in Boston, put up a six-win season with the Astros, and found himself signed by the Mariners for the 2006 season, where he had his worst offensive season by far. Everett was league-average in B% and K% and that was about it. Everett was released in July of 2006 at the age of 35, having posted -0.8 fWAR in 92 games. You could say he was getting to be a bit of a dinosaur, but don’t tell Carl Everett anyone said that about him.

11. Ben Broussard, 2006-07, 88 wRC+, -0.8 fWAR

Broussard was acquired by the Mariners from Cleveland in the second half of the 2006 season, filling in mostly at DH after Carl Everett’s dismissal; in that time-frame Broussard’s figure of 78 wRC+ is not particularly inspiring, and only slightly bests Everett’s. Broussard then spent most of his first and only full season (2007) for the Mariners switching between first base and the corner outfield spots, His overall 88 wRC+ was a slight improvement but still not great, especially while the man Bill Bavasi gave up to acquire Broussard, Shin-Soo Choo, has produced 24.3 fWAR since the 2007 season.

Back to Broussard, though:

12. Eduardo Perez (2006), 48 wRC+, -0.8 fWAR

I don’t think I really have to say anything here.

13. Jesus Montero (2012-), 83 wRC+, -0.9 fWAR

Jesus Montero is now somewhat of a tragic figure among Marinerds. In the 2012-2013 offseason, Montero claimed that he had a coach who had helped him ‘learn to run’, which I guess if you haven’t yet is probably a good idea. He then cut his 2013 season short by getting suspended for his involvement in the Biogenesis snafu. Last August, he got into a bizarre altercation. Montero’s role in the organization has strayed far from the top hitting prospect the Mariners traded Michael Pineda(who’s now the #3 in New York) for. Montero continues to toil away in the Mariners’ farm system (reports out of Tacoma yesterday were that he legged out an infield single), in the hopes he can top 2013’s terrible 64 wRC+. Montero is still only 25, so it’s not as if all hope is lost, but the fact remains that his on-field production at the major league level has been nothing short of disappointing.

14. Ken Griffey, Jr. [1989-99(omitted), 2009-10], 84 wRC+, -0.9 fWAR

Nobody was expecting 90s Griffey Jr. the ballplayer, which was convenient because he didn’t show up. Griffey was only mediocre in 2009, with a wRC+ of 97 and a wOBA of .324, rendering him merely replacement-level (0.0 fWAR). 2010 was a different story. Griffey Jr. posted a depressingly bad 32 wRC+ in 108 plate appearances. Amid issues with Don Wakamatsu restricting his playing time and the bizarre rumor of Griffey napping during a potential pinch-hit opportunity, things came to a head in June of 2010, when Griffey abruptly left the club, drove home, and announced his retirement before the next days game. The Kid’s return to Seattle was a welcome dip into the nostalgia-drenched coffers of yesteryear for a struggling ballclub, and before anyone had time to process it, the sweetest swing in baseball was silenced in a flash.

15. Corey Hart (2014), 70 wRC+, -1.1 fWAR

Hart has the lowest single-season WAR of any player on this list. The Mariners paid $6 million with $7 million in undisclosed incentives for a year of Hart coming off a knee surgery that caused him to miss all of 2013, which at the time seemed to be a reasonable gamble for a high-risk commodity that could potentially have paid great dividends. Unfortunately, Hart struggled to stay healthy and perform. playing only 68 games in the season; the midseason acquisition of Kendrys Morales certainly didn’t help. Ultimately the Mariners’ front office decided to take a gamble with Hart and lost.


BONUS ROUND (fun with small sample sizes): Scott Spiezio in 2005

Scott Spiezio in 2004 was simply a bad infielder and player, posting a miserable .288 OBP, 67 wRC+, among other poor statistics on his way to putting up a below replacement-level season of -0.1 fWAR.

Big deal though – it’s one bad season. Besides, if you look up on that same list, Carl Everett put up -0.8 fWAR in 92 games. Eduardo Perez did it in 43!

This is nothing to Scott Spiezio.

Again, the sample size here is ridiculously small, but the absurdity of the numbers he managed to log in 29 games is honestly kind of impressive. The Mariners released him from here and he then went on to win the World Series with St. Louis, even hitting a game-tying triple in Game 2 of the 2006 NLCS, so fortunately he was of some use to a team after that 2005 season.


In fairness, the designated hitter is not an incredibly stable position in today’s game. It doesn’t make sense to pay a premium for a skill that can be replicated by other hitters who can also play competent defense. There are only a handful of “conventional” designated hitters in the league, and even Victor Martinez and his -31.1 UZR/150 in 2014 are called upon to play defense every once in a while. For whatever reason – be it sentimentality with Griffey or having the odds stacked against them with Hart or just because Bavasi (Clement, Broussard), the Mariners have gotten an extraordinarily poor level of performance out of their designated hitters in an Edgar-less world, with some bright spots (Jaso, Branyan, 1 season of Kendrys Morales).

This season, Seattle will call on 2014 home-run king Nelson Cruz to fill in most nights at DH (at least as long as Seth Smith and Justin Ruggiano are healthy enough to man right so Cruz doesn’t have to). In 10 years of trying to fill Edgar’s place, the Mariners haven’t quite succeeded and probably won’t ever do so, but wouldn’t it be something to see them come close?