2016 Cubs Run Differential
In this post, I take a look at the 2016 Chicago Cubs though their first 100 games. I’ll start out by focusing on the Cubs’ run differential (Runs Scored – Runs Allowed). After a historic start, they reached their pinnacle after the 67th game of the year against the Pirates. At this point, the Cubs were 47-20 and had outscored opponents by 171 runs! Since then, the ball club is 13-20 and their current run differential is at +153.
Still, the Cubs’ +153 mark is 42 runs better than the next-closest team (Washington Nationals). The Cubs and Nationals are the only clubs to have a run differential that is greater than +100. The second-place Cardinals rank third in the league at +95 right now. While the Cubs dominate the top end of the spectrum, the Reds and Braves are running away with the worst run differentials in the league. The Reds have a -143 mark, largely due to the thrashings they have taken at the hands of the Cubs so far in 2016. The Braves have the second-to-worst differential at -134 runs.

Projected Runs to Wins
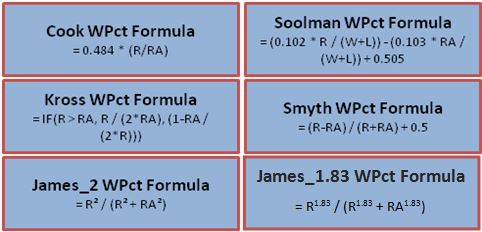
In another place, I introduced the “Pythagorean Theorem’s of Baseball” which basically tries to determine the number of games a team will win based on their number of runs scored and number of runs allowed. Here are the formulas for six of the most common win-percentage projection formulas:
I added up the Cubs’ total runs scored and total runs allowed after each game this year and compared their actual number of wins to the projected number of wins based on each formula. These charts visualize the differences between those numbers.

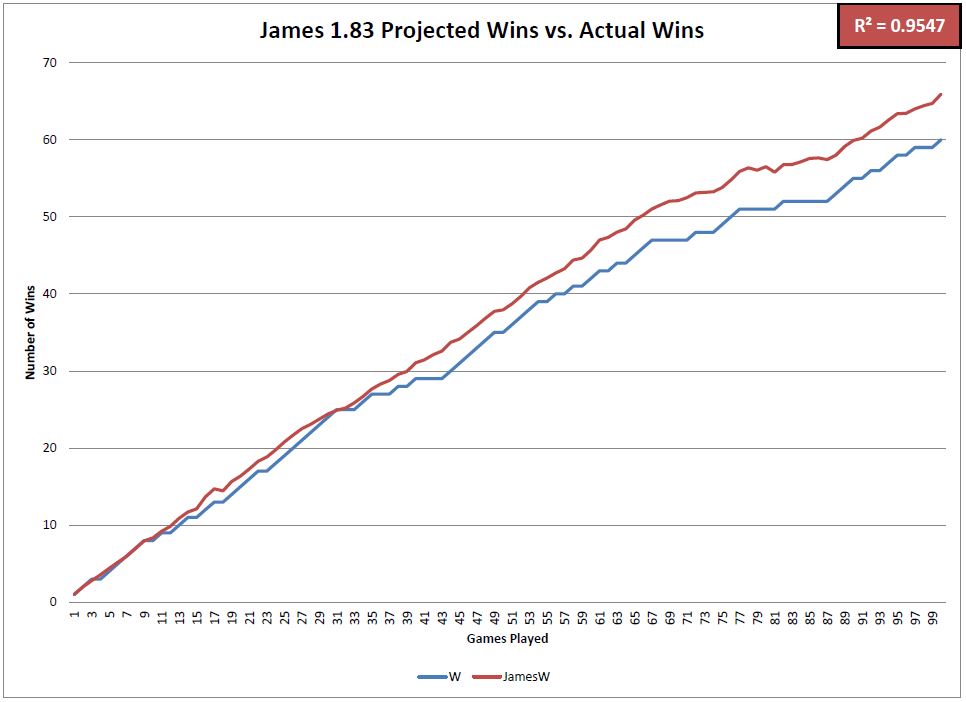
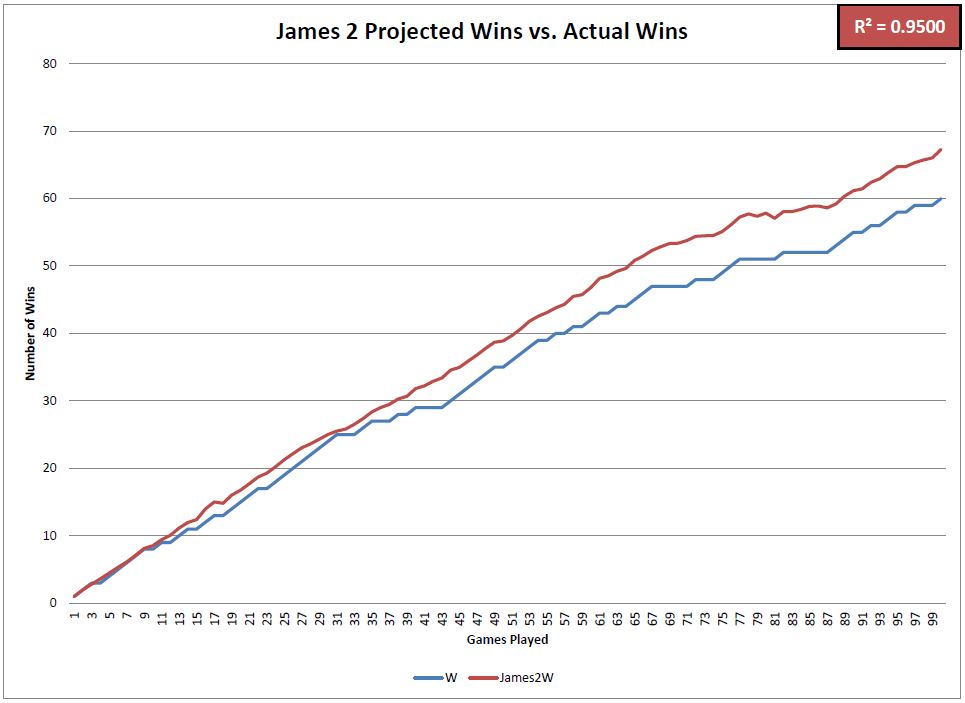
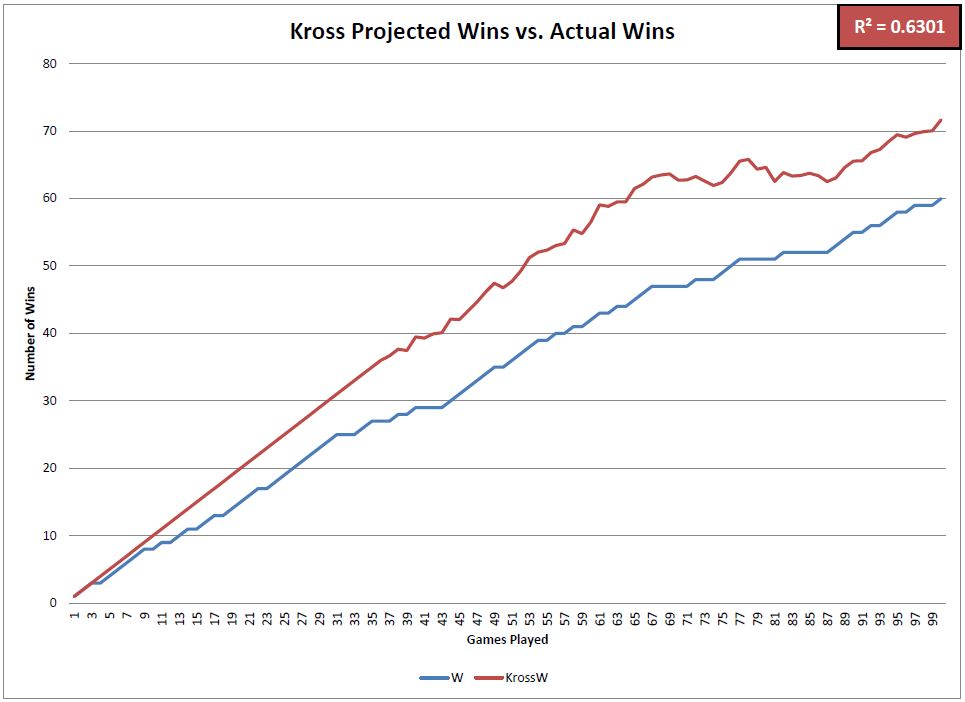
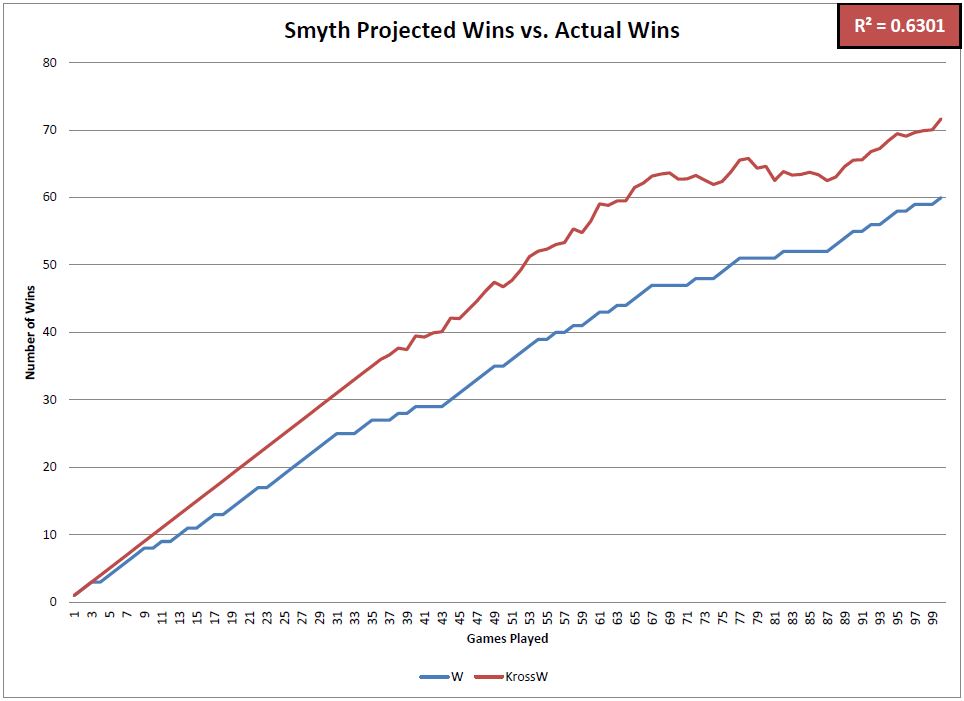
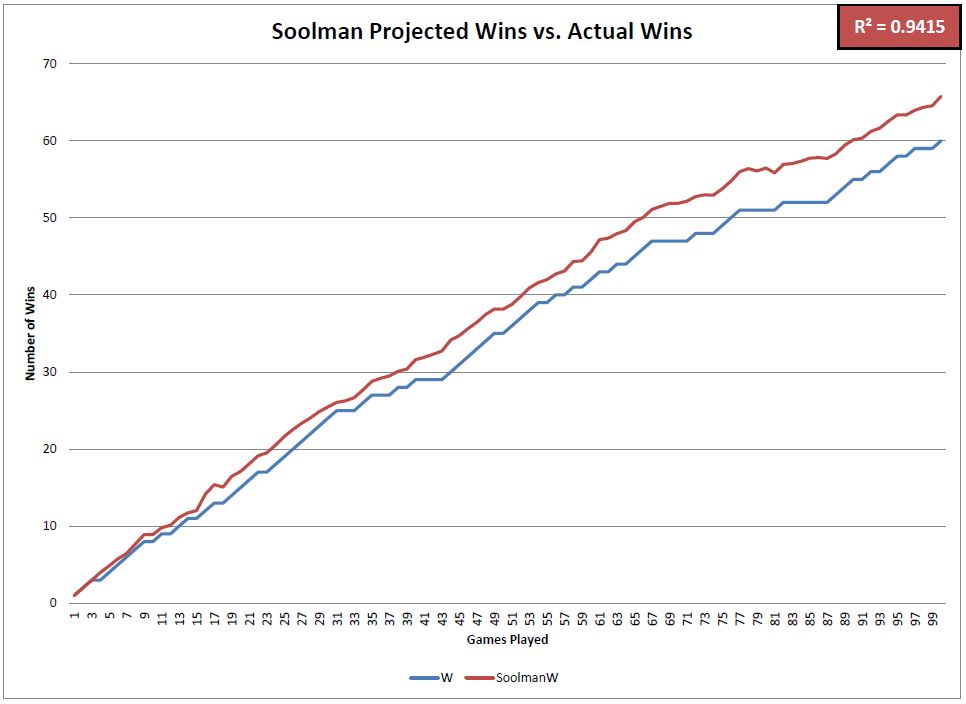
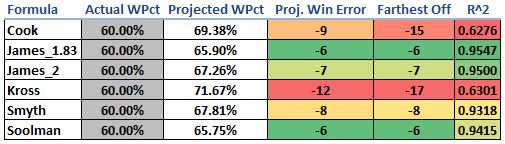
This matrix summarizes how accurate each of the projection formulas has been in predicting the Cubs’ winning percentage and total number of wins so far in 2016. The most accurate formulas was the James_1.83 followed by the James_2 and Soolman. Four of the six formulas were very good predictors, but the Cook and Kross formulas overforecasted the number of wins that they expected the Cubs to have. Notice that at one point this year, each of those formulas projected the Cubs to have over 15 more wins than they actually had. The R^2 value (coefficient of determination) is indicative of how well the projected win percentage matched up to the actual win percentage after each game this season.
All in all, the Cubs have should have at least six more wins this year based on these formulas. Scoring as many runs as they have (4th most in the MLB) and allowing as few runs as they have (T-1st in the MLB) should result in an even better record than 60-40. We knew it was unlikely that they would keep up their record-setting start in the run-differential category, but it will be interesting to see how these numbers match up as the season progresses.
@CubsAdvMetrics on Twitter