Archive for milwaukee brewers

Corbin Burnes, Spin Rate, and Evolving a Generic Arsenal

He throws a fastball. He throws a slider. He introduces the subtle slight-of-hand with a curve ball. The description could fit one of many relief pitchers who have walked through the doors of Miller Park in Milwaukee. The description is also specific to the debut of Corbin Burnes; a 95 MPH fastball, 2,900 RPM curveball pitcher who paints the plate with spinning fire. The diverse intersection between his fastball, curveball, and more commonly used slider makes Burnes another stable relief pitcher. However, the potential of a changeup with dazzling mechanics have Burnes on pace to fulfill his long-term projection as a starter. The 2018 extended relief situations are only a fine-tuning process, so his meticulous approach will become elegantly meticulous as a starter.

Burnes sample-size is small; three games small. Eventually, as all relievers do, one-bad pitch will create a problematic scenario. The question becomes how Burnes reacts toward that controversy, defining his understanding of strategy negotiation in the MLB. Mechanically, Burnes has the fundamentals to skillfully react, deriving strike-outs with a fastball hitting an average 95.3 MPH, his 87.7 MPH slider with control of a whistling 2,909 RPMs, and his curve ball at an equally mesmerizing 2,922 RPMs.

Comparatively, his slider is one revolution less than Luis Severino, and his curveball has greater spin than Rich Hill or Justin Verlander. Regard, greater effective spin rate does not intrinsically make a pitcher better, but it provides the mechanical solution and optimal projection to build intrinsic control. Spin rate is an essential sign of manipulating batters.

Burnes makes his spin rate effective with a quick release. His pace of pitching further assists in pitch disguise, sitting at 22.8 seconds above the average of 25 seconds. Release points are fairly-well grouped, albeit, the fastball does tend to be released a bit higher than the slider. Maybe more importantly is his curveball is released from the same position as his fastball. Hypothetically, once the change up is released, pitching charts should show that his fastball, curveball, and changeup are released from the same slot. Add in pace of play, and Burnes manipulates batters with intensity and deception.

There are two projection points for Burnes, both unfairly high in Severino and teammate Josh Hader. The purpose is not to heap on all-star expectations early in Burnes’ career, rather to show two optimal styles he can evolve into.

The Severino projection is based upon the quick-pace of play, spine rate, and indication Milwaukee prefers Burnes as a starter. Under this theory, he would need to add in a changeup that can assist in disguising his fastball, forcing batters to swing too early. Severino rose to all-star status on the changeup/slider interlay with distinguished velocity, presenting a velocity map that shows greater control of velocity as he advanced his career. Severino has added two MPH to his fastball (96 to 98 MPH) and increasingly tweaked his changeup – Burnes has the fundamentals to follow this model.

The Hader projection leaves Burnes in the bullpen if his changeup is slow to evolve or a curveball which falls to mediocre control. Hader built a deadeye slider into his arsenal to become a definitive relief pitcher. He has precise control over velocity and placement to set-up pitch one with a fastball, then strike back with a contrasting fastball or slider. Burnes has the fastball quality to match Hader and the ability to control left or right-handed batters. Add in a changeup, and Burnes complements Hader in Milwaukee by becoming a three-pitch, set-up pitcher for innings six through eight.

Through three games in the MLB, Burnes has a swinging-strike rate of 20.5 percent and a first-strike rate of 61.9 percent while hitting the zone 38 percent. His game arsenal shows a favorability to begin with an inside-pitch, then overwhelmingly attack the shadow of the zone. Five of his 20 sliders which have hit the corners of the zone have gone for swinging-strike outs, while another resulted in a ground-out. Six more went for balls, one for a foul, and seven for strikes. Hence, batters have had a hard-time locating his moving slider.

Burnes’ performance against the Los Angeles Dodgers offers insight into his awareness. He relieved Chase Anderson in the fifth with bases loaded and no outs. In a bamboozling play, he worked with catcher Erik Katz to obtain an out on Clayton Kershaw at home. He then threw two sliders to Matt Kemp resulting in swinging-strikes, a fastball outside resulting in a ball which set-up a slider for the final swinging-strike. More importantly, these were pitches with low-contact probability – the one thing which had to be avoided was Kemp obtaining a pop-up to scuttle Joc Pederson or Manny Machado home. Obtaining the punctual strikeout allowed Burnes freedom to throw inside the zone against Max Muncy – any result, including the resulting fly-out, was appropriate, thus Burnes hit Muncy with his 97 MPH fastball.

If Burnes maintains the elegance he showed against Los Angeles, he qualifies to build a skillful foray for Milwaukee either as a starter or reliever. He might be another generic reliever for now; time in the MLB, however, is the one-factor holding him back from creating powerful uniqueness with generic presentations.


Alex Cobb Will Be One of the Gems of This Free Agent Class

Of the pitchers hitting the free-agent market this winter, Alex Cobb is not likely to receive the most fanfare.

Aces Yu Darvish and Jake Arrieta will command contracts north of $100 million. Closers Wade Davis and Greg Holland will do their best to secure four-year deals with big price tags. The whole world is watching every development in the Shohei Ohtani saga. Hell, among midmarket starting pitchers, MLB Trade Rumors predicts Lance Lynn to receive a more lucrative contract than Alex Cobb.

Cobb, who broke in as a full-time starter with Tampa Bay in 2012, has historically shown great promise and good-but-not-great results. He averaged 2.5 fWAR from 2012-2014, lost the next two seasons to Tommy John surgery, then came back with a 2.4 fWAR season in 2017. Cobb has never started 30 games in a season, nor has he ever thrown 200 innings. These facts are concerning to some, but I would argue that he is one of the wisest investments one can make this offseason.

Alex Cobb has evolved as a pitcher through pitch selection. Cobb has a great curveball. You either already know that, or you’re about to find out. He also mixes in a four-seam fastball, a splitter, and a sinker. Right now, curveballs are all the rage in baseball, resulting in tremendous success for pitchers like Rich Hill, Trevor Bauer, and Lance McCullers. They throw their curveballs so often that we can consider the breaking ball, not the fastball, to be their primary pitch. Like Hill, Bauer, and McCullers, Cobb has a quality breaking ball, so it stands to reason he should throw it more often and perhaps eschew his mediocre offerings. With Brooks Baseball, we can track the usage rate on each of his pitches throughout the season.

Look at the first couple data points for the usage rates on his pitches, and then compare them to his points at the end of the season. It’s clear that Cobb began to realize he works best by using the fastball and the curveball exclusively, so he increased his usage rate on those pitches and gradually phased out the splitter and sinker.

The question for Cobb is whether this was a good idea. In Cobb’s career, he’s only posted a strikeout-to-walk percentage (K-BB%) above 15% twice, and only ever so slightly so. He’s not bad in that regard, but it’s not where he makes his bread and butter. Fortunately for Cobb, he is one of the better pitchers in the league at inducing ground balls, which we know is favorable contact. The more grounders Cobb induces, the better he gets, and his curveball is a ground-ball machine. Consider the correlation between the rate at which Cobb increased his curveball usage and his ground-ball rate (GB%) throughout the season:

That’s a pretty strong correlation. It seems that Cobb is ready to join the Hills, Bauers, and McCullerses of the world and ride a high breaking-ball-usage rate to breakout success. Of course, it’s never going to be that easy for Cobb or anybody, but let’s go through one of his starts and parse what we can from the good and bad.

On September 4, Cobb pitched against a red-hot Minnesota Twins lineup and had one of his better starts of the season. His first batter of the game was second-half monster and fly-ball connoisseur Brian Dozier, and he managed to get him out on the first pitch.

It’s been proven that batters from the “fly-ball revolution” can be neutralized if you throw them high fastballs. These hitters are swinging up to lift the ball, but it’s difficult to put much lift on a high pitch coming in fast.

We’re going to focus on the curveball throughout this piece, but here is a fun fact about his fastball. Cobb’s heater sits at 92 MPH and had a spin rate of 2101 RPM this season, which seems pretty pedestrian. However, among starting pitchers with at least 100 batted-ball events involving fastballs, Alex Cobb’s has the 31st lowest exit velocity (87.1 MPH). To put this in perspective, that’s a better mark than James Paxton, Chris Sale, Max Scherzer, Jon Gray, Justin Verlander, and Luis Severino.

Cobb was smart to bait Dozier here, and he reaped the benefits with a first-pitch out to begin the ballgame.

In the second inning, we see Cobb pitching out of the stretch and unleashing a curveball that Ehire Adrianza buries into the ground. This will be the common theme today.

I mentioned earlier that Cobb doesn’t have the K-BB% of Chris Sale or Corey Kluber, so every once in awhile he walks batters. The common thought is that Cobb, who throws so many breaking balls, might end up behind in the count thanks to misplaced curves. Then, to get back in the count, he throws his 93 MPH fastball in the zone, which gets crushed by every hitter expecting it.

This would be a bad habit for Cobb to fall into, but he certainly didn’t in 2017. Consider the list of pitchers who threw the most curveballs while behind in the count this season (via Baseball Savant):There’s Cobb, in fifth place, not far behind Rich Hill himself. All five of these guys have great curveballs, so it makes sense for them to Trust the Process™ and continue dropping the hammer rather than submitting to doom and throwing a predictable fastball in the zone.

After walking the leadoff batter to start the third inning, Cobb knew Joe Mauer could make him pay. So rather than giving Mauer the fastball he wanted, Cobb began the at-bat by dropping a curveball for a strike that even froze the great Mauer.

This changed the whole at-bat, because now Mauer didn’t know whether Cobb would be coming at him with the curve or the fastball. Cobb took advantage of his opportunity, used the fastball to get him in an ideal 1-2 count, and then he went back the curveball and got Mauer to ground into a double play.

Cobb is comfortable throwing the curveball both behind in the count and with runners on base, so he can reap the rewards and induce quite a few double plays. That is an asset. Additionally, Cobb is comfortable throwing his curve from both the stretch (as we saw against Adrianza and Mauer) and from his big windup, as you can see here.

Eddie Rosario is a good hitter who made great strides late in the season, but even he found himself to be another ground-ball victim of Cobb’s curveball.

By the fifth inning, Cobb was almost through his second time against the Twins’ batting order. At this point, they weren’t sure whether to expect the curveball or the fastball, so Cobb was often ahead in the count. Here, he has Eduardo Escobar in a 1-2 count and throws a high fastball that Escobar swings right through.

Everyone in the park was expecting Cobb to throw the curveball to finish Escobar off. From a look at Escobar’s swing, it’s safe to say he was expecting a curveball himself. Cobb’s fastball isn’t necessarily anything special, but the way he uses it to pitch off the curveball can be.

With two outs in the inning, Cobb faced his 18th batter (which would complete his second time through against the opposing batting order). He quickly got Ehire Adrianza into an 0-2 count and then unleashed his best curveball of the night, which Adrianza pounded into the ground for another easy out.

At this point, Cobb had gone through the opposing order twice, pitched five innings, and only given up one run. Teams around the league are beginning to realize that most of their starters simply shouldn’t go out for the third time through the order, even if they are rolling. The Houston Astros just rode using Lance McCullers, Brad Peacock, and Charlie Morton in tandems all the way to the World Series. Those three guys are valuable pieces, and if Cobb is utilized liked this, so is he.

Unfortunately for Cobb, his pitch count was at 85, so his manager decided to bring him out for another inning. The Twins got their third look at Cobb, and I don’t need to cite the statistics to you about what happens at this point. Hitters are smart, so they can pick up on the tendencies of a pitcher if they see him so many times. Alex Cobb, as great at he was through five innings and two times through the order, is no exception to this rule.

Here is Joe Mauer taking an 0-2 curveball from Cobb and driving it into the gap in center for a double.

The important question here is, “was that Cobb’s fault or just a good piece of hitting from Joe Mauer?” Of course, the answer in baseball is always going to be both, but you can see in the embedded GIF that Cobb doesn’t necessarily leave the pitch up. In fact, if you compare it to the curveball that Cobb threw earlier in the game to get Mauer to ground into a double play, it doesn’t look much different — maybe an inch or two higher, at worst. The bigger change is Mauer, who swings like a guy fighting to stay alive in the first GIF, then like he knew exactly what was coming and how to handle it in the second.

This is the “third time through the order” effect in a microcosm. Pitches that fool batters earlier in the game become cookies, so the key is to relieve your pitcher while his pitches still fool the batters. Cobb should not be penalized by us for giving up a double to Mauer there; in 2018, analytical teams will be bringing in a new pitcher in these situations.

In this sense, Cobb is the first free-agent test case for the newest pitching trend in the industry — the tandem starter — one who pitches twice through the order, hopefully gets 15-18 outs, and then gives way to someone else. The Mets, who hired progressive Indians pitching coach Mickey Callaway to be their new manager, have made it clear that all starters not named deGrom or Syndergaard will be shielded from facing lineups more than twice in a game. Baseball has never experienced a shortage of five-inning pitchers in its history, but these changes in pitcher usage are leading to new premiums for these specialists.

It’s as simple as this: every team wants to stock their pitching staff with Alex Cobbs. To be clear, every team wants a Justin Verlander, but there is only one Justin Verlander; even horses Chris Sale and Corey Kluber showed significant wear and tear in October. To combat this dilemma, the Houston Astros deployed Lance McCullers, Brad Peacock, and Charlie Morton in five-inning tandems and rode them all the way to the last out of Game 7.

I expect Alex Cobb will fit into this role quite nicely for whichever team he signs with.


MLB to Across the Pacific and Back

The player that all Milwaukee Brewers fans, and baseball fans for that matter, should be watching most closely this spring is Eric Thames. Thames, after three incredible seasons in the KBO, signed a three-year, $16-million deal to man first base for the Brewers. The front office likes what they see from the 2015 KBO MVP, but admittedly did not scout him in person while he was playing overseas; instead, they relied on video to make their assessment of his game. I’ll admit, I can’t wait to see Thames play this year; the mystery, concerns, and potential all make for great theater, but there is one question that keeps haunting me at night: How do former MLB payers fare when they play overseas and then return? As much as this post is about Thames, it is also about those few players who have done what he is doing.

I approached this by looking at all the major-league players who have played in both Korea and Japan over the past 10 years. I could have gone further back to the days when Cecil Fielder was playing in Japan, but the game, both in North America and across the Pacific, has changed significantly since then. The argument could be made that the game has changed significantly over the past 10 years — it changes every season — but that is the beauty of baseball.

I wanted to isolate Korea only, but, perhaps not surprisingly, there were too few players to make anything of that. Out of the several hundred total players in both these leagues over the past 10 years, only a total of 11 players who began their career in MLB returned to MLB after an overseas hiatus. That’s 11 between the KBO AND NPB. 11! Four players from the KBO and seven from NPB. Here’s a graph that shows their names and WAR before and after their careers in Japan and Korea:

Pre WAR MLB Season(s) Pre Post WAR MLB Season(s) Post
Joey Butler 0 2013-2014 0.5 2015
Brooks Conrad -0.1 2008-2012 -0.5 2014
Lew Ford 8.4 2003-2007 0 2012
Andy Green -1.2 2004-2006 0 2009
Dan Johnson 4.0 2005-2008 -0.8 2010-2015
Casey McGehee 1.6 2008-2012 -0.4 2014-2016
Kevin Mench 5.8 2002-2008 -0.4 2010
Brad Snyder -0.1 2010-2011 0.1 2014
Chad Tracy 5.7 2004-2010 -0.3 2012-2013
Wilson Valdez 0.7 2004-2005, 2007 -1.1 2009-2012
Matt Watson -0.5 2003. 2005 0.1 2010
Total WAR: 24.3 -2.8
Eric Thames -0.6 2011-2012 ? 2017-?

(Numbers courtesy of baseball-reference.com)

The outcome for these players is, well, not good. A select few players like Lew Ford and Chad Tracy carry the “pre-Japan/Korea WAR” section thanks to longer, successful careers in MLB before they changed leagues. It also seems unfair to compare these players to each other due to their careers, or lack thereof, upon their return. For example, Ford’s 79 plate appearances are incomparable to Wilson Valdez’s 966. But, in every case, the story arch is the same: Begin their professional baseball career in North America, make it to the majors as a 20-something, decline at the major- and minor-league level, go to Japan/Korea, return to North America in a very limited capacity and fail to make an impact with a major-league-affiliated team.

If the careers of these 11 players is a trend, then Eric Thames is in for a lot of trouble.

But there is reason to believe that Thames is the exception to the rule. Will Franta wrote a convincing Community Research article about the reason to believe that Eric Thames will do well. Additionally, various projections believe that Thames could be anywhere from a 1.2 to 2.2 WAR player with mid- to high-20 home-run totals and an above-average wRC+. Dave Cameron wrote an article analyzing the projections for Thames and concluded that he has the potential to be “the steal of the winter,” and for three years and $16 million, that could very well be true.

But there are factors going against Thames. It isn’t all too often professional players find their footing at the major-league level in their 30s (Thames will be 30 on Opening Day). Plus, with several other corner infielders in the form of Hernan Perez, Travis Shaw, Jesus Aguilar and others who could fill in at first if need be such as Ryan Braun and Scooter Gennett, a team in the middle of a rebuild might not completely be opposed to disposing the incumbent starting first baseman if another star emerges. Even comparing career KBO and NPB players to their transitions to MLB, we can see that there are a lot more Tsuyoshi Nishiokas than Jung-ho Kangs, which is why players like Kang, Ichiro Suzuki, Hideo Nomo, and Yu Darvish are lauded when they succeed in the majors.

I believe that Eric Thames will not be like the 11 others who, by and large, failed in their returns. Thames is intriguing and there is a lot to like about him — and a lot to worry about with him. There are pros and cons to his game. I believe that he will be a great addition to a team that, honestly, could afford to wait for him to assimilate completely to the game.


Eric Thames: The Ideal Gamble

It was in November, yet we may already have the most fascinating free-agency signing of the offseason. Traditionally, free agency is for contending major-league clubs looking to overpay players in hopes that they can deliver a championship. The Milwaukee Brewers went off the beaten path and may be using free agency as a vessel to help their rebuild.

This year’s free-agent class, headlined by Edwin Encarnacion (34) and Carlos Beltran (39), has a shortage of quality bats. The 2016-2017 free-agent class will more than likely be defined by complementary players rather than typical studs who will impact a pennant race. This lack of possible assets forced the Milwaukee Brewers to get creative. The Brewers’ signing of KBO baseball star Eric Thames, four years removed from his last MLB at-bat was…genius?

First, let’s see how we got here.

The Brewers were unhappy with Chris Carter manning the first-base position. It is not often a team will cut a player after he hit 41 home runs, but that is exactly what happened. Carter’s overall lack of production outweighed the power output. Posting a .218 batting average, coupled with a 33.1% strikeout percentage, Carter performed slightly better than a replacement-level player. After cutting ties with Carter, Milwaukee looked at its free-agent options.

With his coming off a 47-home-run season, it is unrealistic for the Brewers to sign All-Star Mark Trumbo (30). The only other impact bat would be Mike Napoli (35). Napoli should benefit from the scarcity of sluggers this offseason. In 2016, Napoli had a nice bounce-back campaign, launching 35 home runs and making headlines such as “Party at Napoli’s.” However, the party stops at first base. Napoli is a below-average baserunner and defender, causing his VORP (Value Over Replacement Level Player) to total just 1.0.

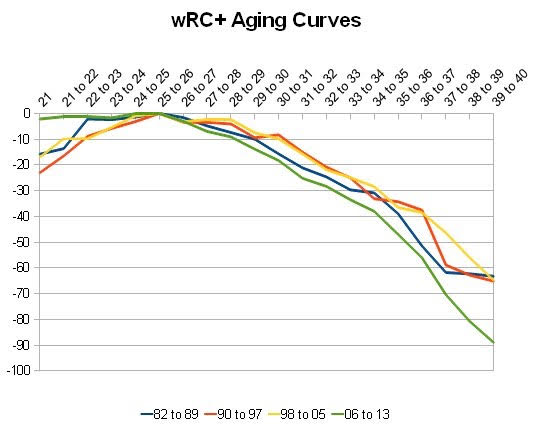
aging-curvesThe Brewers would have to be in love with Napoli’s ability to swing the stick for the club to decide to pull the trigger. But a 35-year-old slugger with poor defense is likely not a good fit for any National League team, let alone the rebuilding Brewers.

As for the rest of the free agents, there is a theme of mediocrity. Moreover, each of them will be over the age of 30 by opening day. Even if the remaining players are able to defy the odds and maintain their levels of performance, it will be nothing more than a stop-gap signing.

After a 73-89 campaign in 2016, the Brewers are not in “win now” mode. Over the past two years, the Brewers have sold, sold, and sold some more. Each trade Milwaukee made brought in quality talent, and according to MLB.com Milwaukee now has MLB’s #1 farm system. Milwaukee has eight players cracking the top-100 prospect list that will be making themselves known as soon as next year. So for a team in rebuilding mode, why sign Eric Thames? Low risk; high reward.

Per Adam McCalvy, Thames will make $4 million in 2017, $5 million the year after, and $6 million in 2019. The team also holds an option on his contract for 2020 for $7.5 million, with a $1-million buyout. That totals out to $16 million guaranteed. Fiscally, it boils down to this: Approximately $25 million for two years of Carter or 3-4 years of Thames for $16-$24.5 million, including bonuses.

In 181 major-league games, Thames posted a .250 batting average with 21 home runs. He had a respectable .727 OPS in that time. This bodes well in comparison to recent Cubs signee Jon Jay who had a similar .774 OPS in his first two seasons. Thames found himself out of the league, while Jon Jay continued his successful career. After 2012, Thames found work in the aforementioned KBO. Over three seasons, Thames averaged 42 home runs while hitting .347 and earned an MVP award in 2015. Oh, and there’s a 30-minute highlight reel of just home runs.

Pitching in Korea cannot be compared to the talent in Major League Baseball. There is a big difference between putting up numbers in Korea and doing so in MLB. However, Jung Ho Kang and Hyun Soo Kim are supporting evidence that succeeding can be done. One thing is evident when watching Thames swing: he has raw power to all fields.

If Thames performs similarly to his 2011-2012 form, then Milwaukee has lost nothing. The deal would simply mean they swapped two replacement-level first basemen while simultaneously saving money. But if Thames shows that he truly is a new player, Milwaukee will once again be front and center during the trade deadline. Thames could be the premier left-handed bat on the trade market while also having a dream contract for contending clubs. The value of his bat along with contractual control over him through 2020 at only $16 million guaranteed could bring in multiple top prospects. This is the dream scenario of course, but hey, it can’t hurt to dream.


Being Sunny About the Brewers

There is a lot of talk about tanking in baseball and the Milwaukee Brewers headline the conversation along with the Atlanta Braves and Philadelphia Phillies. The Brewers, unlike their counterparts in the cellar of baseball, are a respectable team as it stands. They are not a playoff a contender, but they are not a bad team; they are not a scourge; they are an average major-league team in a very good division.

The link the Brewers have to being a very bad baseball team revolves around what we assume they will do, and really, what they should do. But, before speaking of what they will do, it’s worth examining what David Stearns has done since taking over control of the team. The off-season has been a flurry of facially insignificant moves. Here, is a list of them:

  • Luis Sardinas was exchanged for Ramon Flores, an outfield prospect with the seemingly equivalent middling value of Sardinas as an infield prospect, in a trade with the Mariners
  • Javier Betancourt, a younger infield prospect of middling value, was acquired from the Tigers in return for Francisco Rodriguez
  • Jonathan Villar was acquired from the Astros in return for a Cy Sneed, a low-level pitching prospect
  • Jason Rogers, a 27 year old first base prospect sure to see some MLB playing time this year, was traded to Pittsburgh in return for Keon Broxton, an extremely athletic prospect that profiles as a potential versatile and competent fourth outfielder, in addition to pitcher Trey Supak
  • Adam Lind was sent to the Mariners in return for a trio of young, but not highly touted pitching prospects who have struck batters out at low-levels. Carlos Herrera (18), Daniel Missaki (19), and Freddy Peralta (19) are all lottery tickets, but one could always be a winner

They then went about picking up all your favorite team’s former favorite prospects, much like the Astros did when Stearns was working for them. Garin Cecchini was acquired from the Red Sox for cash; Will Middlebrooks was signed to a minor league contract; and Josmil Pinto was claimed off waivers.

Most recently, they replaced Jason Rogers and Adam Lind with Chris Carter, leaving them nearly where they started at first base, except they received five respectable prospects in return for the two first basemen sent out. Steamer projects Carter to post the best wOBA of the three (.333). There’s no loss occurring for the Brewers presently, with the potential of a marginal to hefty gain in the future.

The shuffling of first basemen has Milwaukee walking away with four young starters and a defensively capable outfielder. If one of those starters turns into a back-of-the-rotation pitcher and Broxton turns into a reliable major-league bench player then Milwaukee has won. Really, they win if any of these guys provide only one year of some sort of average major-league contribution, and they only lose if Rogers has an against all odds late-aged prospect emergence.

All of this happened before the re-build. The Brewers managed to maintain their same level of mediocrity, except they gained seven prospects to fill a depleted, and for the most part barren, farm system.

That’s the most exciting part of this. Stearns turned two prospects (Sardinas and Sneed) and three players that offered no value above what is currently on the roster (Francisco Rodriguez, Adam Lind, and Jason Rogers) into seven young prospects and a respectable utility infielder (Villar). The Brewers maintained all of their assets during the process. Now Stearns can focus on moving the real value for the type of players needed to drive a successful re-build.

First, take stock of what the Brewers have.

Jonathan Lucroy is still a very good catcher; Ryan Braun is still a very good outfielder; Khris Davis is an above average outfielder; Jean Segura and Scooter Gennett are an average middle infield; Chris Carter is a powerful first baseman; Wily Peralta and Jimmy Nelson resemble the kind of pitchers that are getting $70-$80 million in guaranteed contracts this winter, and the bullpen has capable arms in Will Smith, Michael Blazek, Jermey Jeffress and Corey Knebel.

Lucroy and Smith stand out among this group. They are very good players on very good contracts.

Jeff Sullivan wrote an article attempting to determine Lucroy’s value in a trade with the Rangers. In the end, he settled on a prospect package of Dillon Tate and Lewis Brinson. This seems right. These are two prospects you find in the second-half of Top 100 lists.

This would be a similar return to what the Brewers received from the Astros last year in the Carlos Gomez trade. They acquired Domingo Santana and Brett Phillips, two good-to-very-good outfield prospects. Gomez and Lucroy bear some similarities, in the sense that they field positions with limited talent and are above-average hitters and very good fielders at their positions. They both share an injury history that is not scary, but does give you pause, and they are both on below-market contracts for two more seasons (Gomez had two years on his contract entering 2015).

Just like teams do not have a wide selection of center fielders in the middle of the season, they have less of a selection of catchers that could add one to two wins after the trade deadline. If Lucroy stays healthy and plays like he did in 2012 and 2013, even less than his prime 2014, he is a rare commodity for a team that could upgrade at catcher.

You wouldn’t have much reason to know about the Milwaukee Brewers’ setup man, but you should know more Will Smith. He’s likely to close for the team this year after posting a declining 3.25 and 2.47 FIP over the past two seasons. He’s doesn’t light up a radar gun (with an average fastball velocity of 93.3 mph), but his slider has ranked the 10th-most effective among qualified relievers over that period (12.2 runs above average). His fastball leaves a little to be desired and it may keep him from being a dominant closer, however, he is a near elite left-handed reliever that is capable of pitching successfully against right-handed hitters as well (he actually did much better again right-handers in 2015, allowing a .545 OPS against right-handed hitters and a .785 against left-handed hitters, but did the opposite in 2014). Those kind of relievers fetch a lot in return at the trade deadline, particularly with an additional three years of team control beyond 2016.

In 2015 the Athletics received Corey Meisner from the Mets for Tyler Clippard, an aging, soon to be free agent Tyler Clippard. Two years ago the Orioles surrendered Eduardo Rodriguez to the Red Sox for soon to be free agent Andrew Miller. Smith isn’t Miller, but with continued success in 2016 he’ll be much more than Tyler Clippard was last July. Any acquisition in between the type of players Meisner and Rodriguez were at the time they were traded would be a haul for the Brewers.


This is the kind of situation that gets turned around quickly if the right decisions are made because of the small decisions made by Stearns and the new Brewers regime this off-season. Trades that will send Lucroy and Smith away from the team should return prospects that will slot into the top half of the farm system which already includes Domingo Santana, Brett Phillips, and Orlando Arcia. Stearns stacked the lower end of the system with a bunch of lottery tickets this off-season and if any hit the Brewers will accelerate the pace of their re-build even further.

Milwaukee is not a wealthy team, but they have proven in the past that they are not allergic to spending on free agents. If they catch the right breaks then they could be a couple of big free agent signings from being a competitive team in a competitive division a couple seasons from now.


You can see the path this team is taking by examining what they have done since October ended. Fans should enjoy the excitement of potential and embrace the pain of losing for now because it shouldn’t last that long. The wins will be all the sweeter when they start to come.

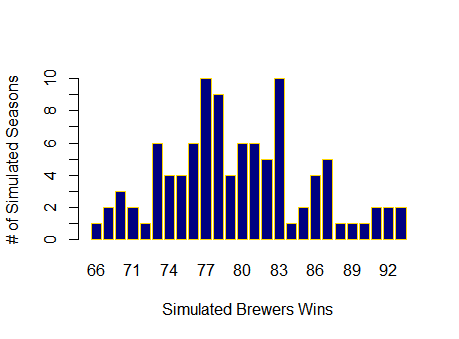
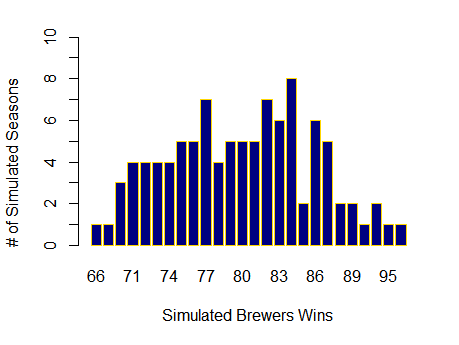
The following projections for 2016 were made using Steamer Projections. The projections are based on their roster as of 1/22/16, not on how it will change throughout the season.

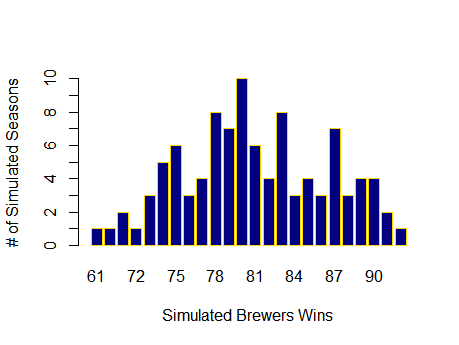
The graphs shown below are three separate simulations of the Brewers playing a 162 game season 100 times. It represents the range of outcomes a team with their projected winning percentage could experience. 

2016 Brewers wOBA Expected Runs — 680 (.313 wOBA)

2016 Brewers FIP and Def Expected Runs — 687 (4.2 FIP, -18.8 Def)

2016 Brewers Pythagorean W-L — 80–82


The Pittsburgh Pirates and Two Missed Opportunities

1. The Pirates finished the year with a 98-64 record, the second best in all of baseball. That ties them with the 1979 and 1908 clubs for the third most wins in franchise history. (The 1909 Pirates won 110 and the 1902 club won 103.) The Pirates’ record, however, included a losing record against two of the worst teams in the game, the Cincinnati Reds (8-11) and the Milwaukee Brewers (9-10).

Let’s break that down. In games in which the Reds didn’t play the Pirates, they were 53-90. In games in which the Brewers didn’t play the Pirates, they were 58-85. So in their non-Pirates games, the two clubs combined for a 111-175 record, a .388 winning percentage. Had they played at that pace in their 38 games against the Pirates, they would have won .388 x 38 games = 15 games, losing 23. Turned around, the Pirates would have gone 23-15 against the Reds and Brewers.

The Pirates were 81-43 in their games that weren’t against Cincinnati or Milwaukee. Had they gone 23-15 against the two clubs–that, is had they been as successful as the rest of the teams in the majors were–their record would have been 104-58. That would have given the Pirates the best record in baseball. They would be enjoying four off days, looking forward to Wednesday’s wild-card game between the Cardinals and Cubs to see whom they’d face at home to kick off the Division Series on Friday.

2. The Pirates had four relief pitchers who pitched at least 60 innings: Mark Melancon, Tony Watson, Jared Hughes, and Arquimedes Caminero. Of the four, the pitcher with the lowest average leverage index when entering a game was Caminero, wasting his namesake’s leverage expertise.


The Cleveland Indians as a Fringe Playoff Contender

It’s been a disappointing year thus far for the Cleveland Indians. They are currently 42-46 heading into the All-Star Game, and are in 4th place in the competitive American League Central division. They are underperforming their BaseRuns projection by 4 wins, meaning the computers view this team as much more of a playoff threat than they actually have been thus far. Although they have the third-highest remaining projected winning percentage in the AL at .532, their rough first half has them only finishing with about 81 wins. As wide open as the wild card race is, a .500 finish would clearly not be enough. What has happened to everyone’s preseason sleeper team? Besides Sports Illustrated jinxing them of course.

Well as expected, they have had stellar starting pitching from the likes of Corey Kluber, Carlos Carrasco, Trevor Bauer, and Danny Salazar, and even have gotten good outings recently from under the radar prospect Cody Anderson. Everyone knew they had a bad defense, but many thought that the Indians’ offense could support the great starting pitching enough to propel them into the postseason. Thus far, however, that has not been the case. They are at league average or below in almost all offensive categories. They are not a power hitting team by any means, and have the 10th lowest FB% in the MLB, which makes sense seeing as to hit for power you need to get the ball in the air. However, they still run the 7th lowest BABIP in baseball, which insinuates that they have a lot of hitters who tend to roll over a lot. Lo and behold, they are 3rd in Pull %, and have a lefty heavy—heavy being an understatement—lineup.

Essentially, the Indians have amassed a lineup with a bunch of pull-happy hitters who don’t hit for much power, which doesn’t work in a league that nowadays uses the shift religiously. I think all Cleveland fans know where I’m going with this, because the phrase has been overused by Tribe fans for almost a decade now. Yes, Cleveland is lacking an impact right-handed bat. Brewer’s prized prospect Matt LaPorta was supposed to be that guy when the Indians traded C.C. Sabathia for him and others—including player to be named later Michael Brantley. However, his MLB career was as successful as Kim Kardashian’s first marriage. Ironically or not, Milwaukee has another player that I believe can push the Tribe over the hump; his name is Carlos Gomez.

The 29 year old native of the Dominican Republic, known for his fiery personality, has been extremely productive for the Brew Crew since 2011, racking up 18.4 WAR in that 4 year span. With Milwaukee sitting at the halfway point with the second worst record in all of baseball, they will most definitely be sellers at the trade deadline. I recently tweeted FanGraphs’ Jeff Sullivan asking him if Gomez would be dealt, to which he responded, “Gomez is probably moving. Lucroy not.” That doesn’t mean it is set in stone, but that shows that there is a decent chance he gets traded. Let’s just assume for arguments sake that the Indians and Brewers have mutual interest in being trade partners. Why should the Indians’ make the move?

One plus is that Gomez wouldn’t be a rental. He is under contract through 2016, and is only set to make 9 million dollars next year. If you consider 1 WAR to be worth roughly 7 million dollars, Gomez’s average of 6.6 WAR per year the last two seasons would be a huge bargain for the Tribe. With the contracts of David Murphy and Ryan Raburn likely to be coming off the books next year, an extra 9 million dollars on the payroll will be inconsequential for the notoriously conservative Dolan family. Gomez also would provide a major upgrade from primary Tribe center fielder, Michael Bourn. I have included a chart that compares their averages from the last two seasons. Why two seasons? Because that’s when Bourn signed with Cleveland, where he has not been the same player he once was.

Name Avg. WAR Avg. wRC Avg. RISP Avg. DEF Avg. ISO Avg. SLG Total PA
Bourn 1.3 53 0.298 -3.3 0.101 0.360 1,062
Gomez 6.6 93 0.298 17.2 0.208 0.492 1,234


It is easy to see who has been the more valuable player. The reason I included ISO and SLG was to demonstrate Gomez’s excellent power, not necessarily to compare it to Bourn’s (because that is not the type of hitter he is). Gomez would provide a major upgrade defensively – where the Indians struggle – and at the plate, where he is a key catalyst in manufacturing runs. Gomez has created almost 40 more runs per season than Bourn the last two years. If you take into account how every 10 runs scored or given up equates to a win or a loss, those extra 40 runs would essentially add on about 4 more wins to the Indians win total (assuming those averages hold up throughout the 2015 season). So that would take the roughly 81 win Indians and make them an 85 win team; better yes, but still not a playoff contender.

Although Bourn and Gomez have been equally as good with RISP, this season has been a different story; Bourn is hitting .216 in 68 PA and Gomez is hitting .381 in 65 PA with RISP. The Indians have the 7th worst average with RISP this season at .230, with the MLB average being .255. For a team that struggles to score runs, this would be a huge difference. Slotting Gomez in the lineup everyday behind a guy like Michael Brantley would also take a ton of pressure off of him to carry the team day in and day out.

So what does this all mean? Could Carlos Gomez really propel the Tribe into October baseball this season? Probably not. Here are their season splits against teams above and below .500.

               Wins Losses Winning Percentage
Teams ≥ .500 24 32 0.429
Teams < .500 18 14 0.563


They struggle against good teams, and beat bad ones. That is not the mark of a playoff team. In the last 74 games of the season, the average winning percentage for teams they play is .515. While I fully believe the team could make a strong second half push – I actually believe they will make the playoffs – it is not likely. Still, a trade for Carlos Gomez would not only aid them in the second half of this season, but for next season as well. Clevelanders are sick of hearing “we’re building for the future.” The Indians have an extremely strong core, one that is young and locked into team-friendly contracts. It is time to win now, because they would hate to look back years from now like a reminiscent ex-lover and say, “That was the team that got away.”


John Axford: the Cardinals’ newest reclamation project

On Friday the Cardinals acquired Brewers reliever John Axford for a player to be named later. While dominant in 2010 and 2011, Axford’s lackluster performance since 2012 has many Cardinals fans uninspired by the move. In fact, most of the media attention has centered around his public farewell to Milwaukee fans.

Bernie Miklasz of the St. Louis Post-Dispatch offered his own analysis of the deal, calling it a “smart gamble” for the Cardinals. In addition to acknowledging Axford’s well documented HR/FB% struggles, Miklasz highlighted that the former closer has been particularly challenged by an ineffective fastball and poor performance in high-leverage situations.

PITCHf/x data on Axford’s fastball:

Year

Pitches

LD%

OPS

wOBA

2011

838

18.0%

.670

.300

2012

1018

24.1%

.844

.360

2013

636

31.9%

.835

.367

Axford’s performance in high-leverage situations:

Year

IP

LD%

OPS

wOBA

2011

30.1

7.2%

.427

.202

2012

26.2

28.1%

.772

.336

2013

11.1

28.6%

1.094

.450

FanGraphs readers will know that Cardinals GM John Mozeliak and his organization’s pitching staff have developed a reputation in recent years for quietly acquiring mediocre pitchers and helping them reach previously unimagined levels of success on the mound. To the extent that Mozeliak and company have similar designs for Axford, one must ask how they plan to help him reclaim his once dominant form.

The Cardinals may suggest any number of tweaks to Axford’s approach, but smart money has them coaching him to focus on throwing more first-pitch strikes. Jeff Sullivan recently reminded us of the importance of pitching ahead, and its import is surely not lost on manager Mike Matheny and pitching coach Derek Lilliquist. Since 2012, Redbird pitchers rank tops in the majors in terms of throwing first-pitch strikes.

Team

IP

F-Strike%

Reds

2682.1

62.4%

Cardinals

2670

62.4%

Yankees

2649.2

62.4%

Phillies

2663.1

62.3%

Braves

2659

62.2%

Diamondbacks

2674.1

61.8%

Rays

2657.2

60.7%

Tigers

2661

60.7%

Rangers

2656.1

60.7%

Pirates

2665

60.6%

In the same piece, Sullivan also noted that since arriving in St. Louis in July 2012, Edward Mujica has established himself as the league leader in first-pitch strikes, increasing that figure from a pedestrian 60.9% in 2011 to an elite 75.6% in 2013. Doing so has no doubt played a large part in his improved performance in high-leverage innings.

Mujica in 2011 with the Marlins:

Split

IP

OPS

wOBA

Low Leverage

31.1

0.556

0.242

Medium Leverage

29.2

0.656

0.284

High Leverage

15.0

0.781

0.325

Mujica in 2013 with the Cardinals:

Split

IP

OPS

wOBA

Low Leverage

20.2

0.561

0.244

Medium Leverage

16.2

0.518

0.222

High Leverage

20.0

0.529

0.234

While Mujica’s 2011 performance in high-leverage situations was not nearly as poor as Axford’s has been in 2012 and 2013, there exists a similar opportunity for improvement.

Specifically, Axford is getting absolutely crushed when behind in the count this season.

Axford’s 2013 pitching splits:

Split

IP

OPS

wOBA

Through 3 – 0

1.2

0.855

0.440

Through 3 – 1

3.1

1.383

0.555

Through 3 – 2

8

0.948

0.409

Through 2 – 0

8

0.981

0.412

Through 1 – 0

24.1

0.960

0.410

As they did when acquiring Mujica last year, look for the Cardinals to initially deploy Axford into low-leverage situations in which he can regain his confidence and focus on getting ahead in the count. If successful, one would expect the club to move Axford into higher-leverage situations, particularly if Mujica or Trevor Rosenthal wears down or runs into trouble down the stretch.


Does Your Team Have a Winning Core? Profiling Sustainable Roster Construction

Thanks to an atrocious month of May, the 2013 Milwaukee Brewers were abruptly transformed from a fringe contender into a rebuilding baseball club.

Most people agree that the Brewers need to build a new core, but what does that mean? Many teams have young players in the midst of an above-average season, but that doesn’t necessarily translate to sustainable success for the roster as a whole. And the opinions expressed about so-called core players are usually subjective and not expressed in a way that allows direct comparisons between teams.

We could really use a metric to compare the rosters of teams who are developing potentially sustainable talent with those who aren’t. My effort to do this is called Core Wins, which summarizes the extent to which a team’s success is being driven from players most likely to constitute core talent, as opposed to players on their way out the door, probably in decline, or both.

To do this, we need define what it means to be a core player, and specifically the factors by which we evaluate a core player’s respective contributions to the team.

The Core Player

In my view, core players do three things: (1) contribute significantly to their team’s success, (2) do so while under extended team control, and (3) do so at or before they reach their peak ages of likely productivity. Each of those attributes needs to be mathematically summarized to reduce these contributions to a measurable value.

The first factor is the easiest: a core player is expected to contribute, and to do so above what could be found in an entry-level minor-league call-up. A major league player’s ability to do so over the course of a season is commonly summarized in some version of the wins above replacement (WAR) metric, which attempts to combine the player’s batting, fielding, and if applicable, pitching contributions. A counting statistic also fits our needs best, since we are looking for aggregate contributions over the course of a single season. So, we’ll use WAR, as calculated by Fangraphs (fWAR).

The second factor, team control, is more complicated. Player control comes in two primary forms: (1) players under club control due to the terms of baseball’s collective bargaining agreement, and (2) players who have signed freely-negotiated contracts. The collective bargaining agreement keeps players under club control for at least six major league years. Free agent contracts range from one-year stop-gaps to those lasting a decade or longer. Most ballclubs are a collection of young players under sustained club control, long-term (and typically expensive) free agents, and stopgap players on value contracts. But teams with a sustainable core should be drawing significant production from players who will actually be around in future years. If too much production is coming from departing or declining players, the club is asking for trouble.

The third factor — player age — is less significant, but still important. Younger players are cheaper than older players, and thus easier to afford and keep around. Younger players are less frequently injured, meaning they will be in the lineup more often. Younger players who have not yet reached their peak production age will also probably continue to improve, whereas players beyond their peak age will probably decline.

However, age can be overemphasized. The primary advantage of youth— extended club control — is already being considered. Moreover, mature players signed to long-term contracts tend to be some of the most valuable players in the game — Joey Votto, Felix Hernandez, and their peers. And while prospects are important, most ballclubs would strongly prefer Joey Votto over a 22-year old prospect who may, but probably won’t, someday turn into Joey Votto. So while age matters, it is not as important as control.

So to summarize: we need to weigh player value, but do it in a way that primarily emphasizes team control while still placing some value on a player’s age.

Method

Player Contributions

All WAR figures were drawn from Fangraphs. The figures for batting fWAR (which incorporates fielding) and pitching fWAR were combined into one spreadsheet for each team year. When a player generated values for both batting (plus fielding) and pitching WAR, those values were summed, including the effect of any negative values. Once a net value was obtained for all players on a team roster for the year, all zero or net negative WAR values were disregarded.

Player Control Index

Player control numbers were drawn primarily from Cot’s Contracts, and cross-checked with Baseball Reference, other sources, and common sense as needed. Cot’s provides individual player contract data from 2009 onward, so only data from 2009 through 2012 was used. Control years were weighted identically, regardless of whether they arose from the CBA or a free agent contract. A player subject to a club option was considered to be under club control for that year. The author’s best estimate of remaining club control was necessary in a few cases when contract details were unclear, but not surprisingly, most of those players were fringe contributors that would not constitute core talent anyway.

A player was assigned one control year if his contract expired after the current season, two control years if his contract expired after the following season, and so on. For practical reasons — including the frequent shuffling from the minors experienced by young players, and the oft-diminishing returns of the longest contracts — the maximum number of control years considered for a player was 5. A Control Index was then calculated for each player in each roster year, with the number of control years as numerator, and an assigned denominator of 2 — for the minimum years that would constitute extended organizational control. So, for example, a player with an expiring contract would have a Control Index of 0.5 (1 season left divided by 2), and a typical player in their final pre-arbitration year would have a Control Index of 2.0 (4 seasons of control divided by 2). The maximum Control Index is 2.5.

Age Index

A player’s “baseball age” — their age on July 1 of a given season — was drawn from Fangraphs. An Age Index was then calculated for each player using an assigned value for a typical peak performance age as the numerator and the player’s baseball age for each season as the denominator. There has been some debate on the overall peak performance age for ball players, but, taking a strong hint from one of my reviewers, I used 27. To give some sense of the value range, the Age Index in 2012 for Mike Trout would have been 1.35 (27/20) and for Livan Hernandez would have been 0.73 (27/37).

Determining Core Win Value

In my formula, Core Win value is a weighting exercise. To calculate a player’s Core Win value to a roster, I multiplied the player’s net fWAR for each season by the Control Index and the Age Index. The Control Index has a greater range (0.5 to 2.5) and thus a greater potential weight than the Age Index, which seems appropriate for the reasons stated above. The combined effect of these indices means young prospects that produce at a level of 2 fWAR or higher are weighted the most heavily. This makes sense: players who promptly adjust to the difficulty of the major leagues, yet still have years of probable improvement ahead of them, all while under extended team control, are those most likely to constitute a sustainable core of talent for the ballclub.

Discussion

Now that we have a formula for Core Win Value, we need to decide what it means to have a winning core. That cut-off is ultimately in the eye of the beholder, but I looked to the gold standard: the Tampa Bay Rays. The Rays are widely acclaimed for their ability to acquire and maintain control of young talent, often through early buy-outs of free agent years, combined with club options that retain team flexibility. This has been particularly true over the years covered by this study: 2009 through 2012.

To provide some contrast with the Rays, we will also consider the roster construction during that same time period of the New York Mets and the Oakland Athletics.

The Gold Standard: The Rays

Not surprisingly, the Core Wins formula likes the Rays very much. Indeed, three characteristics of the Rays between 2009 and 2012 suggest a working definition of a team with a strong, sustainable core: (1) the Rays consistently feature five or more players producing a Core Win Value of 5 or higher per season, which is my working definition of a “Core Player”; (2) they have accomplished this feat in multiple consecutive years (all four years I studied, in fact) and (3) at least two of these Core Players were usually pitchers.

Let’s start with 2009. For ease of viewing, in each of these tables, I’ve bolded wins figures for potential Core Players (five or more Core Wins). I’ve also italicized the names of pitchers who cross the Core Wins threshold, to distinguish them from position players.

2009 Tampa Bay Rays

Name fWAR Age Control Years Control Index Age Index Core Wins
Evan Longoria 7.5 23 5 2.50 1.17 22
Ben Zobrist 8.5 28 5 2.50 0.96 20
James Shields 3.5 27 5 2.50 1.00 9
Matt Garza 2.9 25 5 2.50 1.08 8
Jason Bartlett 5.3 29 3 1.50 0.93 7
Carl Crawford 5.6 27 2 1.00 1.00 6
B.J. Upton 2.1 24 4 2.00 1.13 5
David Price 1.3 23 5 2.50 1.17 4

In 2009, the Rays won 84 games, featuring seven players that delivered 5 Core Wins or more. This depth, plus MVP-level performances from Evan Longoria and Ben Zobrist, prepared the Rays for the eventual departure of Carl Crawford, whose dwindling team control was removing him from the team’s core. Note that the team’s two best pitchers in 2009, James Shields and Matt Garza, were both under team control for 5 more years. David Price generated only 1.3 fWAR in 2009, and thus barely missed the Core Wins cut, but he was on the upswing.

2010 Tampa Bay Rays

Name fWAR Age Control Years Control Index Age Index Core Wins
Evan Longoria 7.6 24 5 2.50 1.13 21
David Price 3.9 24 5 2.50 1.13 11
Ben Zobrist 3.7 29 5 2.50 0.93 9
B.J. Upton 3.8 25 3 1.50 1.08 6
John Jaso 2.3 26 5 2.50 1.04 6
Sean Rodriguez 2.1 25 5 2.50 1.08 6
Matt Joyce 1.7 25 5 2.50 1.08 5
James Shields 1.7 28 5 2.50 0.96 4
Carl Crawford 7.4 28 1 0.50 0.96 4
Matt Garza 1.5 26 4 2.00 1.04 3

In 2010, the Rays maintained 7 players at a Core Win level of 5 or more, culminating in 96 team wins and a first-place finish in the AL East. Only one pitcher (David Price) made the Core Win cut-off of 5 this time, but James Shields just missed it. Matt Garza regressed a bit (and was promptly traded to the Cubs for more prospects, without any negative effect). Carl Crawford, despite an MVP-level year of 7.4 fWAR, is discounted out of the team core by the Core Wins formula, due to his team control ending that year.

2011 Tampa Bay Rays

Name fWAR Age Control Years Control Index Age Index Core Wins
Ben Zobrist 6.2 30 5 2.50 0.90 14
Evan Longoria 6.2 25 4 2.00 1.08 13
David Price 4.3 25 5 2.50 1.08 12
Matt Joyce 3.5 26 5 2.50 1.04 9
James Shields 4.4 29 4 2.00 0.93 8
Desmond Jennings 2.3 24 5 2.50 1.13 6

2011 featured more of the same. Carl Crawford was gone, but the Rays did not miss him, as the formula anticipated. Six Rays met the Core Win threshold, two of them pitchers (Price, Shields). Superstar contributions by Zobrist and Longoria, combined with ascending contributions from four others — including Price and Shields — resulted in a highly-successful season from Tampa Bay’s controlled talent, and others. The Rays won 91 games and made a wild-card playoff appearance.

2012 Tampa Bay Rays

Name fWAR Age Control Years Control Index Age Index Core Wins
Ben Zobrist 5.8 31 4 2.00 0.87 10
David Price 4.8 26 4 2.00 1.04 10
Desmond Jennings 3.3 25 5 2.50 1.08 9
Matt Moore 2.4 23 5 2.50 1.17 7
Evan Longoria 2.5 26 5 2.50 1.04 6
Alex Cobb 2.0 24 5 2.50 1.13 6
Jake McGee 2.0 25 5 2.50 1.08 5
James Shields 3.9 30 3 1.50 0.90 5

By 2012, the Rays had developed an astonishing eight players that crossed our Core Win threshold. An incredible five of these players — over half the team’s core, under our formula — were starting pitchers with at least four years of team control remaining. This means that the Rays’ entire starting rotation was under long-term control. Despite a hamstring injury that kept him out for over three months, Evan Longoria still contributed 2.5 fWAR to the effort, and his new contract provided the team with the long-term control to keep him in the team’s core. The 2012 Rays won 90 games: not enough for even a wildcard in the American League that year, but a terrific season nonetheless.

Before the 2013 season, the Rays dealt James Shields to Kansas City for the bat of Wil Meyers and other prospects. As of the publication of this article, Fangraphs projects them to win 93 games in 2013, on a payroll of only $62 million. In sum, the Rays have been, and continue to be, the prototypical team that demonstrates what it means to have a sustainable core of controlled talent.

By Stark Contrast, the New York Mets

The Mets have been bad for years, and the Core Wins formula identifies major flaws in roster construction as a possible culprit.

2009 New York Mets

Name WAR Age Control Years Control Index Age Index Core Wins
David Wright 3.4 26 5 2.50 1.04 9
Johan Santana 3.2 30 5 2.50 0.90 7
Angel Pagan 2.8 27 4 2.00 1.00 6

Dreadful: there is no other way to describe the 2009 Mets. That year, the Mets spent $140 million for 70 team wins, generating only three Core Players under our formula. Even those players gave only ok performances. From a Core Wins perspective, this roster was terrible. One of the three players to meet the Core Wins threshold, and the only starting pitcher — Johan Santana — is heading past his probable prime.

2010 New York Mets

Name WAR Age Control Years Control Index Age Index Core Wins
Ike Davis 3.1 23 5 2.50 1.17 9
Johan Santana 3.6 31 5 2.50 0.87 8
Angel Pagan 5.1 28 3 1.50 0.96 7
David Wright 3.5 27 4 2.00 1.00 7
Jon Niese 2.1 23 5 2.50 1.17 6
Mike Pelfrey 2.2 26 4 2.00 1.04 5

The results for the Mets weren’t much better in 2010 — 79 wins — but their roster at least improved. Six players made Core Player-type contributions, and two of those players were starting pitchers. If these performances proved to be sustainable over multiple years, or at least into 2011, the Mets had some reason for optimism.

2011 New York Mets

Name WAR Age Control Years Control Index Age Index Core Wins
Daniel Murphy 2.8 26 5 2.50 1.04 7
Jon Niese 2.1 24 5 2.50 1.13 6
Ruben Tejada 1.6 21 5 2.50 1.29 5
Ike Davis 1.3 24 5 2.50 1.13 4
Jose Reyes 5.8 28 1 0.50 0.96 3
David Wright 1.7 28 3 1.50 0.96 3

But it didn’t work out. In 2011, the Mets were right back to a pathetic three Core Player performances, with only one starting pitcher among them. In fact, the Mets’s strongest core performance in 2011 came from 2.8-win Daniel Murphy. Not good. Ike Davis promptly regressed out of the core, David Wright fought injuries, and Johann Santana didn’t play all year, which is why Core Wins discounts the value of aging players. Although Jose Reyes provided a superstar WAR of 5.8 and a batting title, as a departing free agent, that performance provided no ongoing value to the team, and the Core Wins formula discounts it accordingly. It all amounted to 77 wins, and low expectations for the following season.

2012 New York Mets

Name WAR Age Control Years Control Index Age Index Core Wins
Jon Niese 2.7 25 5 2.50 1.08 7
David Wright 7.4 29 2 1.00 0.93 7
Ruben Tejada 1.7 22 5 2.50 1.23 5
Matt Harvey 1.5 23 5 2.50 1.17 4
R.A. Dickey 4.4 37 2 1.00 0.73 3

Validating this expectation, the 2012 Mets did even worse, winning only 74 games. Only three players could pass the Core Wins threshold, and one of their best players — R.A. Dickey — could not even quality as a Core Player, despite 4.4 fWAR. The Core Wins formula discounts the going-forward value of 37-year-old performances, and Dickey’s 2013 performance with the Blue Jays has validated that skepticism.

But, the Mets get enough bad news, so let’s focus on some positive aspects. In 2012, David Wright performed at an MVP level. And while the Mets had only four Core Win players in 2011, two of them are starting pitchers, which is an important positive from our study of the Rays. In fact, one starter, Jon Niese, was signed to an early long-term contract a very Rays thing to do, putting a competent starter under extended team control. Matt Harvey also looks to be a championship-caliber ace, and remains under maximum team control.

So far, 2013 is not being kind to the Mets either — Fangraphs currently projects them to finish with 76 wins — but there are hints that things may soon be looking up, particularly if their farm system can continue to develop strong rotation talent, as many project that it will.

Trending in the Right Direction: The Oakland Athletics

Finally, let’s conclude with what turns out to be a Goldilocks example: the team that like the Mets, tried and failed to improve their core, but stuck with it and seems to have gotten the hang of it lately: the Oakland Athletics.

2009 Oakland Athletics

Name WAR Age Control Years Control Index Age Index Core Wins
Brett Anderson 3.6 21 5 2.50 1.29 12
Ryan Sweeney 3.9 24 5 2.50 1.13 11
Rajai Davis 3.7 28 5 2.50 0.96 9
Kurt Suzuki 3.1 25 5 2.50 1.08 8
Dallas Braden 2.7 25 5 2.50 1.08 7
Andrew Bailey 2.3 25 5 2.50 1.08 6

In terms of roster-building, the 2009 Athletics took a fairly solid approach: they ended up with six potential Core Players, and three of them are starting pitchers. All these players offered at least five years of team control. However, the 2009 Athletics also underscore that just because your wins are coming from the right place does not mean you are getting enough of them. The best performance in this group is still only 3.9 fWAR — good, not great. The 2009 Athletics won only 74 games, although at least they didn’t have to pay Mets prices to get there.

2010 Oakland Athletics

Name WAR Age Control Years Control Index Age Index Core Wins
Daric Barton 4.8 24 5 2.50 1.13 14
Cliff Pennington 3.4 26 5 2.50 1.04 9
Gio Gonzalez 2.9 24 5 2.50 1.13 8
Brett Anderson 2.4 22 5 2.50 1.23 7
Dallas Braden 3.3 26 4 2.00 1.04 7
Trevor Cahill 1.6 22 5 2.50 1.23 5

In 2010, the Athletics were better. Leveraging some of the previous year’s young talent, they ended up 81-81. There were six core-type player performances, and four of them pitchers: ordinarily, a good thing. But notably, there was not a significant amount of improvement from 2009’s core contributors. In fact, the strongest core contributors in 2010, Daric Barton and Cliff Pennington, were marginal contributors the year before, raising the possibility of fluke performances. And, only two core performances came from position players, which didn’t leave much room for error going forward in the scoring department. So, the 2010 Athletics showed hints of a developing core, but a fragile one.

2011 Oakland Athletics

Name WAR Age Control Years Control Index Age Index Core Wins
Gio Gonzalez 3.2 25 5 2.50 1.08 9
Jemile Weeks 1.7 24 5 2.50 1.13 5
Trevor Cahill 2 23 4 2.00 1.17 5

And indeed it was. The Athletics rotation was devastated by injuries in 2011: Dallas Braden needed shoulder surgery, and Brett Anderson needed Tommy John surgery. That would be a tough blow for any team, but particularly for Oakland, which did not have much behind them. What was left of the rotation (and roster) collapsed to three core-type players. The two core bats of consequence in 2010, Daric Barton and Cliff Pennington, immediately regressed and revealed themselves to be one-year wonders. The only developing bat remaining was an average, but unspectacular debut by Jemile Weeks, whose own performance later proved unsustainable.

Although two out of the three core players were starting pitchers, there was little to support it. Brandon McCarthy actually had a very good year (4.5 fWAR), but since he was completing a 1-year-deal at the time, he offered the A’s no core value.

Things looked bleak. Fortunately, the A’s stuck to their guns and kept developing young talent. Then, 2012 happened.

2012 Oakland Athletics

Name WAR Age Control Years Control Index Age Index Core Wins
Josh Reddick 4.5 25 5 2.50 1.08 12
Jarrod Parker 3.4 23 5 2.50 1.17 10
Tommy Milone 2.8 25 5 2.50 1.08 8
Yoenis Cespedes 2.9 26 4 2.00 1.04 6
Brandon Moss 2.3 28 5 2.50 0.96 6
Sean Doolittle 1.6 25 5 2.50 1.08 4

2012 found the Athletics again having restocked their core, this time with a balance of bats and pitching talent. Five core players are represented, and their values are not all projection, either: Josh Reddick produced 4.5 fWAR, Jarrod Parker generated 3.4 fWAR, and two other controlled players produced close to 3 fWAR. Two core players are starting pitchers. Furthermore, in 2012, the A’s finally enjoyed a little luck. They outplayed their Pythagorean expectation by a few wins, got 2+ win performances from non-core starters on short-term deals — Brandon McCarthy and Bartolo Colon — and ended up with 94 wins and an AL West title, on top of what appeared to be developing core.

If you thought that the Athletics were finally getting the hang of this roster-building thing, you may be right. The Athletics have spent much of 2013 on top of the AL West, and Fangraphs currently projects them to finish with 91 wins — on a budget of $62 million. A very Rays-like experience all around, which corresponds with quality roster construction.

Conclusion

The Core Wins metric profiles the extent to which team performances are being delivered by so-called Core Players, and also tracks the progression of players in and out of the club’s core over time. Even herculean performances by impending free agents (see Carl Crawford, 2010) tend to wash out of the metric, while young players who initially impress, but fail to sustain (see Ike Davis, 2011) also fall out of the measured core, despite their built-in advantages of youth and team control. As such, Core Wins strikes me as useful and if nothing else, an improvement over the prevailing practice of eyeballing the roster and cherry-picking performances by younger players.

Because it is based on WAR (a counting statistic), Core Wins is primarily backward-looking. But, the general method can also be used prospectively. For example, if you input projections from your preferred player projection system, you could forecast the extent to which your team is likely to get future contributions from sustainable sources — a useful thing to know when deciding between trades, farm system call-ups, or free agent signings. Similarly, if you want to focus on particular positions of concern — (third base, starting rotation) — or skill sets (batter OBP, pitcher FIP) — you can adjust the Age Index to account for the peak performance ages corresponding with those particular positions or skills. Those analyses can be retrospective or prospective.

Of course, superior roster construction does not guarantee superior performance, as the Oakland A’s can attest. Previously healthy players can be felled by injury, and promising talents too often fail to sustain early achievements. But in general, developing Core Players makes good sense, and certainly seems to be delivering results for the league’s most efficient ballclubs. So if your favorite team seems incapable of stacking success, you might check to see how good of a job the front office has been doing in generating Core Wins.

Special thanks to Paul Noonan and Tom Tango, who both offered helpful comments on the general direction of this article. All errors are entirely my own, including some table pasting errors in the original version. Thanks to Andrew Yuskaitis for pointing those out. They have now been corrected.


Rebuilding on a Crash Diet: The Brewers and a Calamitous May

To describe May, 2013 as an awful month for the Milwaukee Brewers would not do it justice.

In fact, the Brewers were downright putrid, winning only six games the entire month.  Their record in May was so bad (6-22) that it tied the worst month in franchise history: the August turned out by the 1969 Seattle Pilots, who ended the following season in bankruptcy, followed by a permanent road trip to become the Milwaukee Brewers.

The Brewers ended the month of April only a half game out of first place.  The Brewers ended the month of May 15 games behind the St. Louis Cardinals, managing the impressive feat of losing 14.5 games in the standings in one month.  Now that is a tailspin.

CoolStandings.Com currently gives the Brewers a 1 in 250 chance of making even the wild-card play-in game.  GM Doug Melvin admitted there is no chance the Brewers will be buyers this year at the trade deadline.  Rather, they will either be in a sell mode, seeking high-ceiling prospects a few years away, or keeping the assets they have, presumably only if they cannot get anything in return.  In short, the Brewers are suddenly rebuilding, and are focusing on  stocking up their farm system and developing controllable rotation talent.

But, rebuilding is a complicated topic in small markets like Milwaukee.  As Wendy Thurm has noted, the Brewers, with their limited geographic reach, have one of the smallest television contracts in the league.  Thus, the Brewers rely upon strong attendance to deliver profits for Mark Attanasio and his ownership group.  In recent years, the Brewers’ attendance fortunately has been some of the most impressive in baseball, particularly in comparison to the size of the Milwaukee metropolitan area.  Over the last five years, the Brewers have consistently approached or exceeded three million fans, despite challenging economic times.  So, one thing the Brewers cannot afford is a collapse akin to the mere 1.7 million fans they drew in 2003 during a terrible season — not if they want to make the investments in future talent required to make the franchise a perennial contender.

So, the Brewers face an obvious challenge: the team needs to lose enough games to obtain a prime draft position, and thereby maximize its chances to draft a top-ceiling player with minimum bust potential.  At the same time, the Brewers need to avoid losing in any drawn-out fashion, because a corresponding and sustained decline in attendance could hemorrhage desperately-needed cash from their balance sheet.  As Ryan Topp and others have argued, this need to maintain attendance in the short term seems to be one reason why the Brewers have systematically traded away what previously was an excellent farm system, with the apparent goal of maintaining the aura of a competitive team.

How does one navigate this problem?  Well, the best solution could be to experience a May like the Brewers just suffered.  Doing so addresses two problems: (1) it abruptly puts the team on course to get a top 5 draft pick, and (2) it achieves this result so abruptly, and in this case so early in the season, that the fan base can still — at least in theory —enjoy much-improved baseball for the remainder of the season without jeopardizing that draft slot.  In short, when you can take your medicine over the course of one month, instead of over an entire season, you really ought to do it.

As to the draft:

Thanks to May, the Brewers currently have the fifth-worst record in baseball at 23–37.  As of the morning of June 8, 2013, FanGraphs predicted that the Brewers will end the season tied for baseball’s fourth-worst record with the New York Mets at 73–89.  Provided that 2013’s top five draft picks all reach agreement with their teams, the Brewers are on pace for a top-5 draft slot in 2014.

The Brewers have not had a top-5 pick in the Rule 4 draft since 2005, when they picked some guy named Ryan Braun.  Before 2013, the top five slots in the draft provided, among others, Buster Posey (#5, 2008), Stephen Strasburg (#1, 2009), Manny Machado (#3, 2010), Dylan Bundy (#4, 2011), and Byron Buxton (#2, 2012) — the types of superstar prospects the Brewers have been denied for years, and which they need to anchor their next generation of players.  At the end of April, and before May occurred, the Brewers were on track for yet another mid-round pick slot.

As to the rest of the season:

It is unlikely that the Brewers will continue to suffer the combination of injuries and dreadful rotation pitching that helped ruin their May.  FanGraphs seems to agree, predicting that the current Brewers roster (or something like it) will essentially play .500 baseball for the rest of the season, even while maintaining one of the five worst records in the game.

Average baseball is not contending baseball, but average baseball at least would offer Brewers fans — already pleased with Miller Park’s immunity from rain delays — a reasonable likelihood of seeing a win on any given day.  In 2009, the Brewers were able to bring in over three million fans, despite finishing under .500 overall.  In 2010, the Brewers ended up eight games under .500, but still brought in 2.7 million fans.  It remains to be seen whether playing .500 baseball for the rest of the 2013 season would be sufficient to keep fans coming through the Miller Park turnstiles, but if so, the increasing remoteness of May could be a significant factor, particularly if the team can convince fans that “one bad month” does not represent the current Miller Park experience or true caliber of the team.

Of course, it is also possible that the Brewers will be able to trade significant assets at the deadline in exchange for the prospects Doug Melvin wants.  If so, their projected record could, and probably would decline.  (This is necessarily not a bad thing, given that 68.5 wins is the average cut-off to secure a top 5 draft spot from 2003 through 2012).  If that happens, the Brewers will have a further challenge on their hands in trying to provide even average baseball for their fans, and maintain the attendance they need.

That said, the Brewers’ remarkable close to 2012 — an incredible .610 winning percentage from August through October — was accomplished after trading away Zack Greinke and calling up minor league talent to plug gaps in the rotation left by Greinke’s trade and Shaun Marcum’s injuries.  If the Brewers are once again able to make advantageous trades at the deadline, and also able to play even .500 ball for the rest of the year, they are still in a position to do so without hurting their chances to get the impact player they need in the 2014 Rule 4 draft.

If they can pull both of these things off, much of the thanks should be given to the horrible month of May.