Archive for kansas city royals

Using Statcast to Substitute the KC Outfield for Detroit’s

As I write this post the KC outfield defense is ranked No. 1 in Defensive Runs Saved (DRS) with 43, and is No. 2 in UZR at 28.6 (first is the Cubs with 29.0).  KC sports one of the best, if not the best defensive outfield in the majors this season.

Detroit on the other hand has a fairly poor one.  They rank last in DRS, with -44, and last in UZR at -31.8.  Though Baltimore gives them a good run for their money, Detroit is probably the worst defensive outfield in the majors so far this season.

So I wondered if we could do an analysis to show what would happen if we substituted them entirely for one another?  How would that work?  Well, one simple approach would be to just use the DRS metrics for each team and basically say that DET would go from -44 to +43, so that’s a swing of +77 runs. Using the 10 runs per win thumb-rule, that’d be a pretty big swing, nearly eight games. Detroit is a whole lot better.  But I’m not sure this method is really the best we can do.  After all, we have all this Statcast data now.  Could we use that?

I set out to try to do just that.  So my first step was to hypothesize that the likelihood of a ball hit to the outfield actually dropping for a base hit could be correlated to the launch angle provided by Statcast and then that this likelihood would change depending on the team.  So to test this theory out I went to Baseball Savant and grabbed all the Statcast data for balls hit to the outfield for KC and for Detroit.

The KC data consisted of 1722 balls hit to the OF (when removing the few points that had NULL data for launch angle).  I took these 1722 points and bucketed them by launch angle in buckets that were 2 degrees each.  I then calculated the percentage of hits to total (hits + outs) for each bucket.  This percentage was the likelihood that a ball hit to the outfield at a certain launch angle would end up being a base hit.  This led me to my first realization, which was that anything that was basically < 8 degrees on launch angle (so including all negative angles), and made it to the OF, was a guaranteed hit.

The results of this analysis for the 1722 KC points made a lot of sense intuitively.  As the launch angle increased, so did the likelihood that it was an out, so my hit percentage trend went down.  Using a simple linear regression projecting the likelihood of a hit by angle had a 92.5% R^2.  This equation was going to work nicely.

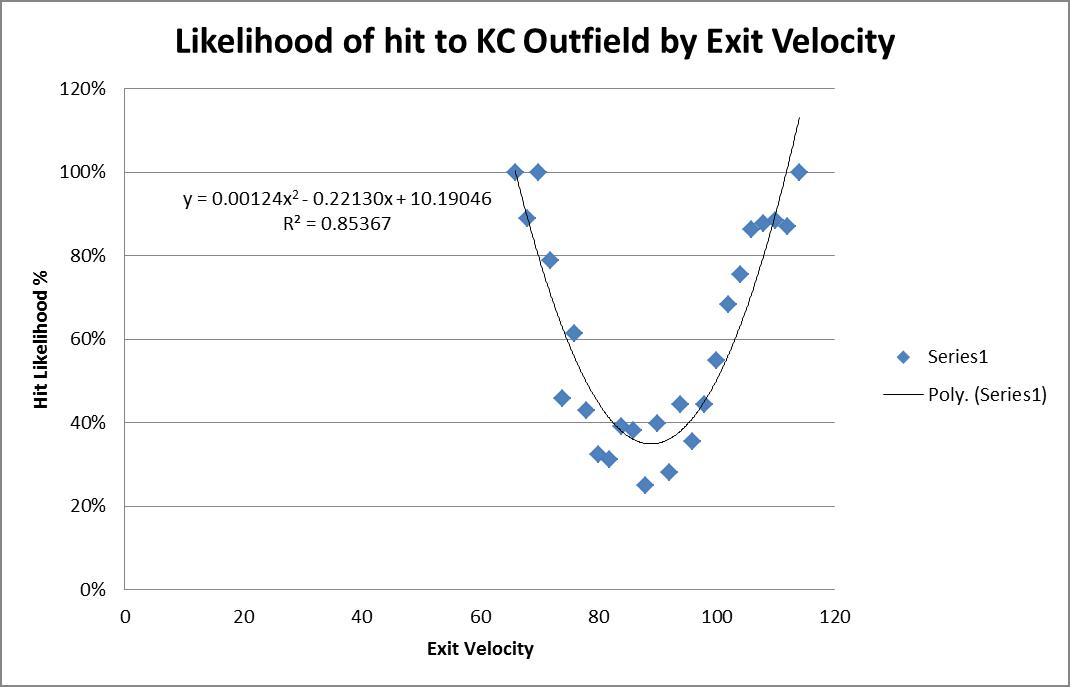
I then considered running the same drill but this time using exit velocity of the hit to see how that impacted the likelihood of a ball being a hit.  There have been at least a couple article written on this topic, and the results I got matched up with the projections I had seen in other articles on the topic.  That’s to say the trend isn’t linear, but more parabolic. Using a simple second-order polynomial trend, a very reasonable projection could again be made of a hit likelihood based on the exit velocity of a ball hit to the OF.
Using these two points of data for any ball put in play to the outfield (exit velocity and launch angle) it seems as though OF defense could be projected fairly reasonably.
I proceeded to re-run those same drills using Baseball Savant’s Detroit outfield data. Launch angle provided another great fit, 95% R^2 and a slightly higher overall trendline than KCs (notice the higher y-intercept or “b” value).  KC’s OF was almost 4% more likely to catch a ball just from the “b” value.
Using a simple second-order poly trend for Detroit’s exit velocity also resulted again in an 85% R^2, very similar to that of KC.  It also showed the expected parabolic action.
What I now had was a way to project the likelihood of the KC outfield or the DET outfield making a play on any ball hit to the outfield.  All I needed to know was what the angle and exit velocity was.  Lucky for us, Statcast gives us all that information.
My next step was to take all the OF plays made by Detroit and, using my newfound Detroit projection system, project the number of real hits based on the hit events to the OF.  My Detroit projection system projected 1089 hits, in reality there were 986 hits. Not perfect, and something that could undergo some more tweaking, but reasonable.  My projection system was overly simplistic — I took the likelihood from the angle * the likelihood from the exit velocity.  If the multiplication was > 25% (i.e. 50% for each as the minimum threshold) then I projected a hit; else, an out.
So my Detroit projecting Detroit resulted in 1089 hits.  When I substituted the KC projection equations in, the Detroit projected hit to the OF dropped to 903.  This was a reduction of 186 expected hits!  Wow.  That’s some serious work the KC outfielders would’ve done.
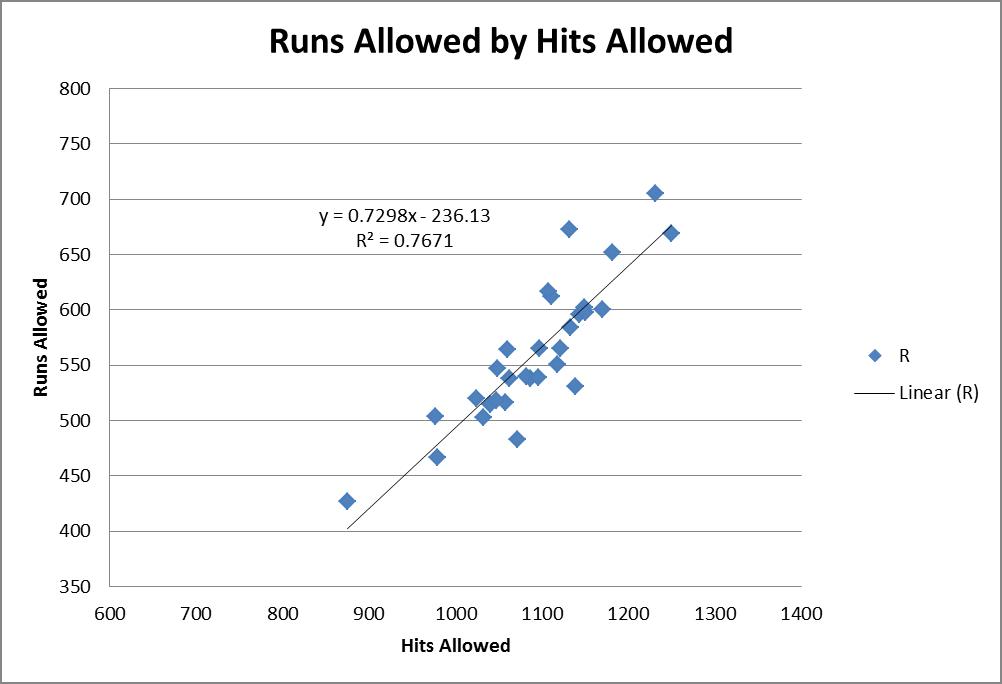
The last step here was then to attempt to convert this reduction in hits to a reduction in runs.  I grabbed FanGraphs’ year-to-date pitching stats by team and used that to do a simple regression on hits allowed to runs allowed.
This showed strong correlation with a ~77% R^2.  Using the slope of this equation it shows that each hit allowed correlates to 0.7298 runs.  This means that a reduction of 186 hits would correlate to a reduction of 136 runs! Again, using the 10-run thumb-rule, that’s a nearly 14-win move.  That’s amazing improvement.   Now of course we are expecting drastic improvement; we’re talking about replacing the worst OF defense in the league with the best!
Conclusions
Are there some bold assumptions made here? Yes.  However, I do think it’s a fairly reasonable approach.  It’s fun to see all the different ways this new Statcast data can be used.  This same drill could be run on all sorts of “swap” evaluations and could be a whole lot of fun for a variety of what-if scenarios.  I enjoyed attempting to answer this question using the new data and hopefully you found this entertaining as well!

A Quick and Dirty Attempt to Find Justin Upton’s Trade Value

Players like Justin Upton aren’t usually available at the trade deadline. Upton ranks 35th in wOBA (.353) and 47th in WAR (8.9) between 2013 to the present.  Also of note, Upton is in his walk year.

So, how many players like Justin Upton have been traded in the past 10 years? I did a quick scan of deals made in June and July since 2005 and I found four similar players who were traded in their walk years.

1. Hunter Pence PHI->SF, 2012 (68th wOBA (.347) and 68th WAR (8.7), 2010-2012)

2. Carlos Beltran NYM->SF, 2011 (19th wOBA (.379) and 74th WAR (8.1), 2009-2011)

3. Matt Holiday OAK->STL, 2009 (4th wOBA (.410) and 6th WAR (18.2), 2007-2009)

4. Mark Teixiera ATL -> LAA (15th wOBA (.396), 17th WAR (14.8), 2006-2008)

The Mets received Zack Wheeler in return for Beltran and the Athletics received Brett Wallace in return for Holliday. Baseball America ranked Wheeler the 55th best prospect pre-2011 and Wallace was ranked 40th pre-2009. In the following years, pre-2012 and pre-2010, respectively, Wheeler was ranked 35th and Wallace was ranked 27th.

The Mets and Athletics did well in each trade. They received top prospects and non-deteriorating prospects (they were not losing value as prospects during the year they were traded for). This is evidenced by the ranking of Wheeler and Wallace in the season following the trade.

The Pence and Teixiera trades did not net the Phillies or Braves prospects. Each team received a major league asset, using “asset” in the loosest of ways.

The Phillies received Nate Schierholtz, who had totaled .9 WAR up to that point in 2012. They also received Seth Rosin, an A Ball pitcher, and Tommy Joseph, a AA catcher. Essentially, they received a replacement level player and organizational depth. 

The Braves received Casey Kotchman. Kotchman had totaled 2.1 WAR in 2008 with the Angels before the trade. He managed 3.7 WAR the year before. The Braves could not expect Kotchman to live up to his past billing (he was Baseball America’s 6th ranked prospect pre-2005), however, from the most optimistic perspective, they may have expected him to be worth 2 WAR per year over the remaining four years of team control. At least this is my best attempt to get in the head of the Braves’ front office seven years after the fact.

Now, I’ll attempt to determine Justin Upton’s trade value based upon these past trades.

Kevin Creagh and Steve DiMiceli published a study on Point of Pittsburgh that analyzed the value and future performance of prospects based on their ranking in the Baseball America’s Top 100 (the ranking was determined by the final appearance of the prospect in the rankings).  The article has a lot of information you should read regarding the dollar value of prospects and their potential to bust, but for purposes of this article, I am concerned with a prospect’s projected WAR over the six years of team control.

Hitters that rank between #26-50, which is Brett Wallace, project to have an average of 6.8 WAR. Pitchers ranked between #51-75 project to have 3.8 WAR. However, based on Wheeler’s fast rise up Baseball America’s list, I’ll factor in that pitchers ranked between #26-50 project to have 6.3 WAR. The average of the two is 5 WAR, which is the value I’ll place on Wheeler at the time the Mets traded for him.

Justin Upton is not Matt Holliday, circa 2009, and he is not quite Carlos Beltran, circa 2011, although he is much less of an injury risk than 2011 Beltran (who would go on to spend time on the DL for the Giants in 2011). Therefore, I project that the Padres should receive between 3.8-5.0 WAR in return for Upton. The return should scale up towards the higher side of that projection based upon an active and interested market for Upton.

Below is a list of potential Upton suitors and their prospects that appeared in Baseball America’s Top-100 rankings before the season began. The rank of the prospect is in parenthesis, followed by their Creagh and DiMiceli projected WAR. The prospects in bold represent the most likely return for Upton, however I included some prospects that are possibilities, but project to have more WAR value than should be expected in return for Upton.

Mets – Brandon Nimmo (45, 6.3), Dilson Herrera (46, 6.3), Amed Rosario (98, 4.1). I excluded Kevin Plawecki (63) and Michael Conforto (80) due to their major league role and rise to prominence, respectively. 

Pirates – Jameson Taillon (29, 6.3); Austin Meadows (41, 6.8); Josh Bell (64, 5); Reese McGuire (97, 4.1)

Cubs – C. J. Edwards (38, 6.3); Billy McKinney (83, 4.1)

Giants – Andrew Susac (88, 4.1)

Orioles – Dylan Bundy (48, 6.3); Hunter Harvey (68, 3.4)

Rays – Daniel Robertson (66, 5); Willy Adames (84, 4.1)

Royals – Raul Mondesi (28, 6.8), Brandon Finnegan (55, 3.4), Kyle Zimmer (75, 3.4), Sean Manaea (81, 3.5)

Twins – Jose Berrios (36, 6.3); Nick Gordon (61, 5); Alex Meyer (62, 3.4)

Astros – Mark Appel (31, 6.3)

A.J. Preller should feel (somewhat) vindicated regarding the Justin Upton portion of his winter experiment if he can get a player he likes that resembles the players on this list. However, it remains to be seen if he will chase after something safer, like the Braves in 2008, or squander an asset like the Phillies in 2012. In that case, he’s probably better off going all-in on the Padres he built for 2015.


Has the Modern Bullpen Destroyed Late-Inning Comebacks?

During the World Series, I submitted an article showing that the team leading Los Angeles Dodger games after six innings wound up winning the game 94% of the time, the highest proportion in baseball. I suggested that maybe that’s why Dodger fans leave home games early; it’s a rational decision based on the unlikelihood of a late-inning rally. (Note: I was kidding. Back off.)

But between the lack of comebacks for the Dodgers and the postseason legend of Kansas City’s HDH bullpen, I wondered: Are we seeing fewer comebacks in the late innings now? The last time the Royals made the postseason, in 1985, the average American League starter lasted 6.17 innings, completing 15.9% of starts. The average American League game had 1.65 relievers pitching an average of an inning and two thirds each. This year, American League starters averaged 5.93 innings, completing just 2.5% of starts. The average game had just under three relievers throwing an average of 1.02 innings each. The reason that starters don’t go as long isn’t my point here, and has been discussed endlessly in any case. But looking at the late innings, today’s batters are less likely to be facing a starter frequently (52% of AL starters faced the opposing lineup a fourth time in 1985, compared to 28% in 2014), reducing the offensive boost from the times-through-the-order penalty. Instead, modern batters face a succession of relievers, who often have a platoon advantage, often throwing absolute gas. The Royals, as I noted, won 94% of the games that they led going into the seventh inning (65-4), and that wasn’t even the best record in baseball, as the Padres were an absurd 60-1. Are those results typical? Has the modern bullpen quashed the late-innings rally?

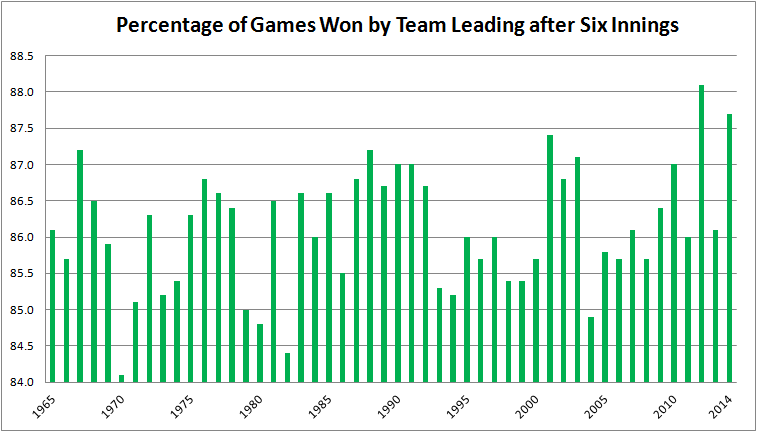
To test this, I checked the percentage of games in each year in which the team leading after six innings was the final victor. (These data are available at Baseball-Reference.com, using the Scoring and Leads Summary.) I went back 50 years, recording the data for every season from 1965 to 2014. In doing so, I got the 1968 Year of the Pitcher; the 1973 implementation of the DH; the expansions of 1969, 1977, 1993, and 1998; the Steroid Era; and the recent scoring lull. This chart summarizes the results:

The most important caveat here is this: In Darrell Huff’s 1954 classic, How to Lie with Statistics, he devotes a chapter to “The Gee-Whiz Graph,” in which he explains how an argument can be made or refuted visually by playing with the y-axis of a graph. This is a bit of a gee-whiz graph, in that the range of values, from 84.1% of leads maintained in 1970 to 88.1% in 2012, is only 4%. That’s not a lot. My choice of a y-axis varying from 84.0 to 88.5 magnifies some pretty small differences. Still, the average team was ahead or behind after six innings 140 times last season, so the peak-to-trough variance is five to six games per year (140 x 4% = 5.6). That’s five or six games in which a late-inning lead doesn’t get reversed, five or six games in which there isn’t a comeback, per team per season.

The least-squares regression line for this relationship is Percentage of Games Won by Team Leading After Six Innings = 85.756% + .015%X, where X = 1 for 1965, 2 for 1966, etc. The R-squared is 0.06. In other words, there isn’t a relationship to speak of. There is barely an upward trend, and the fit to the data is poor. And that makes sense from looking at the graph. The team leading after six innings won 86.5% of games in the Year of the Pitcher, 86.6% when the Royals were last in the Series, 85.7% in the peak scoring year of 2000, and 86.1% in 2013. That’s not a lot of variance. You might think that coming back from behind is a function of the run environment–it’s harder to do when runs are scarce–but the correlation between runs per game and and holding a lead after six innings, while negative (i.e., the more runs being scored, the harder it is to hold the lead), is weak (-0.22 correlation coefficient).

So what this graph appears to be saying, with one major reservation I’ll discuss later, is that the emergence of the modern bullpen hasn’t affected the ability of teams to come back after the sixth inning. Why is that? Isn’t the purpose of the modern bullpen to lock down the last three innings of a game? Why hasn’t that happened? Here are some possible explanations.

  • Wrong personnel. Maybe the relievers aren’t all that good. That seems easy to dismiss. In 2014, starters allowed a 3.82 ERA, 3.81 FIP, 102 FIP-. Relievers allowed a 3.58 ERA, 3.60 FIP, 96 FIP-. Relievers compiled better aggregate statistics. A pitcher whose job is to throw 15 pitches will have more success, on average, than one whose job is to throw 100.
  • Wrong deployment. Analysts often complain that the best reliever–usually (but not always) the closer–is used in one situation only, to start the ninth inning in a save situation. The best reliever, the argument goes, should be used in the highest leverage situation, regardless of when it occurs. For example, when facing the Angels, you’d rather have your best reliever facing Calhoun, Trout, and Pujols in the seventh instead of Boesch, Freese, and Iannetta in the ninth. Managers may have the right pieces to win the game, but they don’t play them properly.
  • Keeping up with the hitters. Maybe the reason teams over the past 50 years have been able to continue to come back in, on average, just under 14% of games they trail after six innings is that hitters have improved at the same time pitchers have. Batters are more selective, go deeper into counts, benefit from more extensive scouting and analysis of opposing pitchers, and get better coaching. So just as they face more and better pitchers every year, so do the pitchers face better and better-prepared hitters.

My purpose here isn’t to figure out why teams in 2013 came back after trailing after six innings just as frequently as they did in 1965, just to present that they did, despite advances in bullpen design and deployment.

Now, for that one reservation: The two years in which teams leading going into the seventh inning held their lead the most frequently were 2012 and 2014. Two points along a 50-point time series do not make a trend, so I’m not saying it’s recently become harder to come back late in a game. After all, the percentage of teams holding a lead were below the long-term average in 2011 and 2013. But I think this bears watching. Pace of game, fewer balls in play, ever-increasing strikeouts: all of these are complaints about the modern game. None of them, it seems to me, would strike at the core of what makes baseball exciting and in important ways different from other sports the way that fewer late-inning comebacks would.


The Unassailable Wisdom of Los Angeles Dodger Fans

Another exit from the postseason deprived the nation of tales of Dodger fandom and their proclivities–Dodger Dogs, Vin Scully, and, of course, leaving the game early. Why they leave early, beats me. Maybe they have premieres to attend. Maybe they’re going to foam parties. Maybe they’re trying to beat the traffic. Me, I don’t know. Like most FanGraphs readers, I’d guess, I have never been invited to a premiere. Or, for that matter, a foam party. (And I’m still not entirely clear as to what one is.) As for beating the traffic, yeah, I get it, average attendance at Dodger Stadium was 46,696 this year, highest in the majors, so I imagine that’s a lot of cars. But Dodger games took an average of 3:14 last year, which means that night games ended well after 10 PM, so one would assume that traffic on the 5 and the 10 and the 101 and the 110 would have eased by then, though I don’t live in a part of the country in which highways are referred to with articles, so what do I know.

Aesthetically, of course, the argument against leaving a game early is that you might miss something exciting–an amazing defensive play, a dramatic rally, last call for beer. That would seem to trump the concerns of early departers.

Especially a rally. A late-innings comeback is one of the most thrilling pleasures of baseball. But that made me wonder: Are they becoming less common? If so, wouldn’t that be an excuse, if not a reason, for leaving early?

During the postseason, you may have heard that the Royals have a pretty good bullpen. (It’s come up a couple times on the broadcasts.*) With Kelvin Herrera often pitching the seventh, Wade Davis the eighth, and Greg Holland the ninth, the Royals were 65-4 in games they led after six innings. Of course, a raw number like that requires context, so here is a list of won-lost percentage by teams leading after six innings:

Team W L  Pct.
Padres 60 1 98.4%
Royals 65 4 94.2%
Nationals 72 6 92.3%
Dodgers 81 7 92.0%
Twins 52 5 91.2%
Giants 62 6 91.2%
Orioles 72 7 91.1%
Indians 67 7 90.5%
Braves 62 7 89.9%
Tigers 70 8 89.7%
Rays 61 7 89.7%
Mariners 68 8 89.5%
Angels 76 10 88.4%
Marlins 51 7 87.9%
Cardinals 69 10 87.3%
Reds 61 9 87.1%
Yankees 67 10 87.0%
Cubs 59 9 86.8%
Brewers 63 10 86.3%
Athletics 65 11 85.5%
Phillies 53 9 85.5%
Mets 64 11 85.3%
Red Sox 52 9 85.2%
Pirates 61 11 84.7%
Blue Jays 61 11 84.7%
Reds 51 10 83.6%
Rangers 45 9 83.3%
Rockies 49 11 81.7%
Diamondbacks 49 12 80.3%
Astros 54 16 77.1%

Sure enough, the Royals did very well. The major league average was 87.7%. Kansas City, at 94.2%, easily eclipsed it. But, as you can see, so did the Dodgers. We certainly didn’t hear about their lockdown bullpen in their divisional series loss to the Cardinals. Presumably, the Dodger bullpen’s 6.48 ERA and 1.68 WHIP over the four games of the series had something to do with that. But during the regular season, the Dodgers held their leads.

How about the other way–what teams were the best at comebacks? Shame on Dodger fans if they were leaving the parking lot just as the home team was launching a rally, turning a deficit into victory. Here’s the won-lost record of teams that were trailing after six innings:

Team W L  Pct.
Nationals 14 54 20.6%
Athletics 12 52 18.8%
Angels 11 48 18.6%
Pirates 11 50 18.0%
Giants 13 60 17.8%
Marlins 14 66 17.5%
Royals 11 58 15.9%
Cardinals 8 47 14.5%
Indians 10 59 14.5%
Tigers 9 54 14.3%
Orioles 8 50 13.8%
Reds 10 64 13.5%
Astros 9 64 12.3%
Mariners 8 57 12.3%
Brewers 8 59 11.9%
Blue Jays 8 60 11.8%
Yankees 7 53 11.7%
Padres 9 71 11.3%
Mets 7 59 10.6%
Twins 9 77 10.5%
Phillies 8 71 10.1%
Red Sox 8 72 10.0%
Diamondbacks 8 73 9.9%
Rays 7 66 9.6%
Cubs 7 71 9.0%
Rockies 7 72 8.9%
Rangers 7 74 8.6%
Reds 5 67 6.9%
Braves 3 60 4.8%
Dodgers 2 54 3.6%

Whoa. Ignoring for now the late-inning heroics of the Nationals, who were able to come from behind to win over one of every five games that they trailed after six innings, look who’s at the bottom of the list! The Dodgers trailed 56 games going into the seventh inning this year, and won only two.

So maybe the Dodger fans who left games early are on to something. I devised a Forgone Conclusion Index (FCI) by combining the two tables above. It is simply the percentage of games in which a team leading after six innings comes back to win the game. For example, the Royals led after six innings 69 times and, by coincidence, trailed after six innings an equal number of times. Their Forgone Conclusion Index is 65 Royals wins when leading after six plus 58 opponents’ wins when the Royals trailed after six, divided by 138 (69 plus 69) games in which a team led after six innings. The Royals’ FCI is thus (65 + 58) / 138 = 89.1%. The team leading Royals games going into the seventh inning wound up winning just over 89% of the time. A Royals fan wishing to leave a game after six innings did so with 89% certainty that the team in the lead would go on to win. (Yes, I know, I should do a home/road breakdown, but this is a silly statistic anyway.)

Here’s the Foregone Conclusion Index for each team last year.

Team FCI   Team FCI   Team FCI
Dodgers 93.8% Rangers 88.1% Giants 86.5%
Padres 92.9% Indians 88.1% Blue Jays 86.4%
Braves 92.4% Tigers 87.9% Nationals 86.3%
Twins 90.2% Phillies 87.9% Diamondbacks 85.9%
Reds 90.1% Red Sox 87.9% Angels 85.5%
Rays 90.1% Yankees 87.6% Reds 85.2%
Royals 89.1% Mets 87.2% Marlins 84.8%
Orioles 89.1% Brewers 87.1% Athletics 83.6%
Cubs 89.0% Rockies 87.1% Pirates 83.5%
Mariners 88.7% Cardinals 86.6% Astros 82.5%

And there you have it. The Dodger patrons leaving the game early weren’t being fair-weather or easily-distracted fans. Rather, they were simply exhibiting rational behavior. They follow the team for which the team leading after six innings was the most likely in the majors to hold on to win. They were the least likely fans to deprive themselves of the excitement of a late-inning comeback by leaving early.

I know what you’re thinking: Single-season fluke. There have to have been more comebacks in Dodger games in recent years, right? As it turns out, yes, but not a lot. The Dodgers were eighth in the majors in Foregone Conclusion Index in 2013 (87.8%) and seventh in 2012 (90.4%). Maybe 2014 is an outlier in which there were an extremely small number of comebacks in their games, but over the 2012-2014 timeframe, only the Braves (91.8% FCI) and Padres (90.9%) have played a higher proportion of games in which the team leading entering the seventh inning has gone on to win than the Dodgers (90.8%).

So keep it up, Dodger fans. Get into your cars during the seventh inning, turn on Charlie Steiner and Rick Monday on the radio, and drive on your incrementally less crowded highways on the way to your premieres and foam parties. You probably won’t be missing a comeback, and by leaving early, you’re expressing your deep understanding of probabilities.


*TBS managed to botch a fun fact about Kansas City’s bullpen. At one point, they posted a graphic stating that the Royals are the first team to have three pitchers–the aforementioned Herrera, Davis, and Holland–to compile ERAs below 1.50 in 60 or more innings pitched. They forgot the key qualifier: Since Oklahoma became a state. The 1907 Chicago Cubs featured three starters with ERAs below 1.50: Three-Finger Brown (1.39), Carl Lundgren (1.17), and Jack Pfiester (1.15). The Cubs’ team ERA was 1.73.


Liberating Liberated Fandom

Reading Joe Posnanski’s latest piece about the struggles of the Royals, in which he opines about the fact that they’re a bad offensive team despite leading the league in batting average and showing no desire to promote two of their more intriguing young players (Alex Gordon and Kila Ka’aihue), I kept being struck with two pervading thoughts: (a) it must be terrible to be a fan of the Royals and (b) why would anyone do it?

Posnanski, of course, has become something of a darling in the sabermetric world not only for his excellent and insightful writing but for his acceptance and use of some of the more involved stats that we use to measure ballplayers. As such, he’s able to look past the fact that his Royals are taking pride in leading the league in hitting and have no interest in advancing beyond using batting average to measure players. Walks to them are res non grata, Posnanski argues, and he does so in the sort of tone that suggests that he has come to believe that there is no hope for change on the horizon. Which, you know, as long as Dayton Moore’s in charge, that does seem to be the case. But in any event, that’s really what made me wonder why Posnanski – and the other fans of the (disproportionately well-represented on the internet) Royals – keep following a team that gives them nothing in return.

Now, I suppose that on the surface, it makes sense: you root for the team you root for, and if you don’t root for the team that you grew up near, then you’re destined to be labeled a fair-weather fan. Such is life. But, perhaps because I adopted the Braves as my favorite team when they were on TBS every day and the Cubs were terrible, I don’t understand why that has to the case. See, sports is entertainment; we watch them because we enjoy the athletic splendor and all, but mostly because we are entertained by our favorite players going out there and plying their trade – because it’s fun.

If I had my copy of FreeDarko’s Macrophenomenal Pro Basketball Almanac with me, I’d quote here from their bit about liberated fandom. As it is, though, there is this post (first two paragraphs being of especial relevance) that will have to suffice for the moment; essentially, it argues for the eschewing of The Home Team in favor of the players that we actually enjoy watching. Are you a Cubs fan, but can’t stand watching a team put runners on third base with fewer than two outs in the 9th 10th and 11th innings and not score them even though come on just hit a freaking sacrifice fly or at the very least try a suicide squeeze*? Don’t concern yourself with it; soak in the good times to be had in watching Carl Crawford steal bases or Vladimir Guerrero defy age or…oh, boy…or Albert Pujols beat down the doors to Cooperstown.

*I petitioned for this to happen in each of the three aforementioned innings. People say the triple is the most exciting play in baseball. People are wrong. The brief burst of drama and immediacy that a squeeze provides is unlike anything else in baseball. And it’s not for only that reason that I don’t understand why we don’t see more suicide squeezes, but also because it seems a really easy way to get a run, no? As long as bat hits ball, your chances of scoring a run are far higher than if you’re just letting the guy at the plate hit.

Two things: (1) Outs are almost always the dominant outcome of any game. Teams simply don’t put 27 men on base very often; they will always make enough outs (sometimes as few as 12; far more often 27) to finish a game. (2) Don’t think of batting average relativistically. Viz., think of them as percentages, not in the context of your baseball experience. A .330 hitter sounds like he’s really good at hitting…but ultimately, it means that he’s been getting hits in one-third of his at-bats and making outs nearly 70% of the time. If you’ve a guy on the team hitting .501, then, sure, let him swing away. But hits simply do not happen all that frequently; bunting is a much easier way to put the ball in play.

That’s the kind of suggestion I can make nowadays, what with the availability of MLB.tv and the internet making it easy to follow any team. During the World Cup – and immediately after – people loved to talk about how this would be the World Cup that got people into soccer. Now, they say this after nearly every Cup where the USMNT doesn’t get totally embarrassed, but this one was Different because we have the Internet and can keep track of our Nation’s Heroes as they play for Club Teams over in Foreign Lands. Similarly, though infinitely more effectively, people can follow any baseball team, or any selection of players, that they choose. At the risk of sounding like a shill for MLB, MLB.tv has a feature where you can select any player in the league, and they’ll alert you when he comes up to bat or in to pitch. I myself follow guys like B.J. Upton, Jay Bruce, Ichiro, Matt Wieters, Colby Rasmus and Pablo Sandoval that I wouldn’t be able to see otherwise – guys whose careers I enjoy more than, say, Melky Cabrera’s*.

*This is perhaps the wrong time for me to be writing this article, because this Braves team is probably the most enjoyable one to watch since Andruw Jones and the Baby Braves ruled the roost. Cabrera and Eric Hinske were the only two guys I could think to speak of derisively and I don’t hold any particular grudge against them. I guess Derek Lowe isn’t all that fun, but it doesn’t seem fair to pick on pitchers.

So why shouldn’t I just declare myself a fan of baseball, rather than the Braves? Everyone knows that Seinfeld bit about how having a favorite sports team is like rooting for laundry; what makes the Braves’ laundry so compelling that I should forego the pleasure of watching Jose Reyes and Hanley Ramirez and Chase Utley and Stephen Strasburg? I imagine the answer to this question is ‘it just is,’ or some similarly vague and far-reaching statement. Perhaps the tribal nature of fandom is so engrained in sports fans’ minds that there’s no turning away from it; perhaps people think there is a greater reward to be gleaned from “suffering”* through a team’s ups-and-downs and winning a championship.

*Y’know, for all the good there is in sports, it sure is a bastion of hyperbole. People love to throw around how Cleveland fans have “suffered” because they haven’t had a team in their city win a title in so long, and don’t have any real prospects of doing so in the near future. With the culture of superlatives that dominate sports, is it any wonder that Dwyane Wade dropped his 9/11 line? I’m going to stop there because the only thing more grating than that hyperbole is the moralizing and holier-than-thou attitude inherent in telling people that they’re not feeling real pain, and turn on the news if you want to see tragedy.

I don’t like that view. Sports isn’t life; sports is a diversion from life – it’s a forum for unparalleled conflict resolution (winners, losers, champions, meticulous documentation and quantified performance) and enjoyment of things we don’t see in everyday life (e.g. 450-foot home runs and diving catches and walkoff celebrations*).

*Though I do think this could (and should!) be brought into offices and schools. Say you just gave a really great presentation; you could have the audience cheering throughout your conclusion and hitting a crescendo as you nail the last syllable of ‘thank you,’ and then they vault over their tables and mob you and everyone jumps around. You could even rig the projector to drop company-color confetti. If this were commonplace I’d almost be excited to graduate soon.

So why do we arbitrarily bring unpleasantness into the equation? Why do we self-identify as fans of a team of guys that we may not like? Why do stat-minded guys like Rany Jazayerli and Rob Neyer and Joe Posnanski put themselves through the drudgery of a Royals team that couldn’t be more antithetical to their baseballing values? It is an inherently jingoistic, paleolithic process, a throwback to the days when the United States was a name and not a realized concept. I do think that there is a place for fandom in sports; I would argue that the incredibly fluid player movement in the NFL leaves fans rooting for teams as the only constants in a league of flux, and that watching a game where you don’t care for (or actively dislike) both teams is painful. But, with all due credit to those exceptions, I do not think that we need to subvert our enjoyment of sports and call ourselves ‘fans’ of a team. We don’t need to slog through inning after inning of uninspired baseball that’s not played to our liking when there are so many options out there. We can cast off the shackles of supporting a last place team and enjoy watching whomever fits our fancy; we can, or indeed should, be a fan of the game without being a fan of a team.